ANANDRATHI
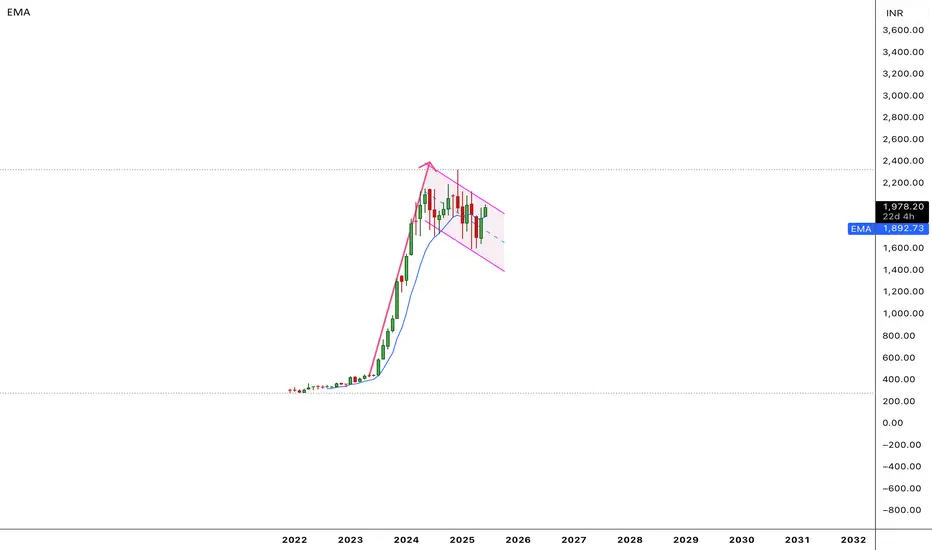
After a consolidation phase since the start of the year 2024, prices have finally broken out of it, thus indicating resumption of up-move.
The volumes during the break of structure has been high.
Recently, price has broken out of a flag formation, indicating continuation of the on-going up-mov
Next report date
—
Report period
—
EPS estimate
—
Revenue estimate
—
38.60 INR
3.00 B INR
9.70 B INR
42.69 M
About Anand Rathi Wealth Ltd.
Sector
Industry
Website
Headquarters
Mumbai
Founded
1995
ISIN
INE463V01026
FIGI
BBG013TG2PP0
Anand Rathi Wealth Ltd. engaged in the distribution and sale of financial products. It offers corporate finance, investment banking, stock broking, and private wealth services. The company was founded on March 22, 1995 and is headquartered in Mumbai, India.
Related stocks

BUY TODAY SELL TOMORROW for 5%DON’T HAVE TIME TO MANAGE YOUR TRADES?
- Take BTST trades at 3:25 pm every day
- Try to exit by taking 4-7% profit of each trade
- SL can also be maintained as closing below the low of the breakout candle
Now, why do I prefer BTST over swing trades? The primary reason is that I have observed that

Anand Rathi - Flag pole patter on monthly chartAnand Rathi share has formed a flag-pole pattern on monthly chart.
Therefore the first target is coming to 2250 and second target of 2500 subject to good quarterly results.
D isclaimer: This analysis is for education purpose only and should not be used for trading and also not for investing objecti
Anand Rathi Wealth Limited (ANANDRATHI) Company: Leading non-bank wealth solutions provider in India with ₹75,291 Cr AUM, serving HNIs/UHNIs with market cap of ₹17,681 Cr.
Technical Pattern: Stock forming descending triangle with resistance at ₹2,300-2,350 and critical support at ₹2,150-2,200; currently down 4.63% at ₹2,218.
Key Levels:

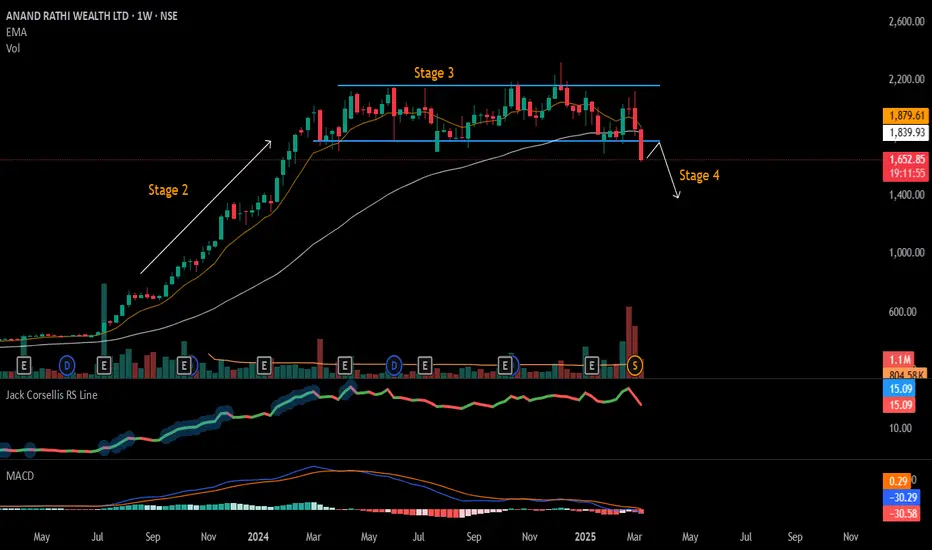
#ANANDRATHI - Stage 4 / Decline The was was in Stage 2 / Growth Stage - Up Trend
Stock entered Stage 3 / Distribution - Side Trend
Now stock entered Stage 4 / Decline - Down Trend
Stage 4 is when we need to exit our investment and protect our capital.
ANANDRATHI // 06-03-2025This share may give 23% Profit, if Entry order triggered after I posted. Take position as per your risk reward ratio and that is not recommended, only for educational purposes.

ANAND RATHI: Enter on pullback!1. Price is strong, already did a trendline breakout.
2. Best entry should have been around 3600 before the BO, but now, we have to wait for the price to retrace back to good entry zones.
3. Overall view is bullish, it has a long way to go on the upside.
4. RRR is not favourable currently.
⚠️ Discl

Anand rathi wealth nearing consolidation endAnand rathi wealth is a fantastic wealth compounder fundamental stock. Company has posted more than 30% growth in sales and profit in Q2. Consolidation will breakout soon with a potential of 50%.

At breakout stockThis stock has broken its consolidation phase, it has taken support of its 200 EMA. If it sustains at this level then a big move is expected of bout 20%.

Triangle pattern breakout Please look into the chart for a detailed understanding.
Consider these for short-term & swing trades with 2% profit.
For BTST trades consider booking target for 1%-2%
For long-term trades look out for resistance drawn above closing.
Please consider these ideas for educational purpose
Please no

See all ideas
Summarizing what the indicators are suggesting.
Neutral
SellBuy
Strong sellStrong buy
Strong sellSellNeutralBuyStrong buy
Neutral
SellBuy
Strong sellStrong buy
Strong sellSellNeutralBuyStrong buy
Neutral
SellBuy
Strong sellStrong buy
Strong sellSellNeutralBuyStrong buy
An aggregate view of professional's ratings.
Neutral
SellBuy
Strong sellStrong buy
Strong sellSellNeutralBuyStrong buy
Neutral
SellBuy
Strong sellStrong buy
Strong sellSellNeutralBuyStrong buy
Neutral
SellBuy
Strong sellStrong buy
Strong sellSellNeutralBuyStrong buy
Displays a symbol's price movements over previous years to identify recurring trends.
SMALLCAP
Mirae Asset Nifty Smallcap 250 Momentum Quality 100 ETF Units Exchange Traded FundWeight
1.31%
Market value
1.00 M
USD
MOSMALL250
Motilal Oswal Nifty Smallcap 250 ETF Units Exchange Traded FundWeight
0.55%
Market value
77.72 K
USD
Explore more ETFs
Frequently Asked Questions
The current price of ANANDRATHI is 2,922.00 INR — it has increased by 1.73% in the past 24 hours. Watch Anand Rathi Wealth Ltd. stock price performance more closely on the chart.
Depending on the exchange, the stock ticker may vary. For instance, on NSE exchange Anand Rathi Wealth Ltd. stocks are traded under the ticker ANANDRATHI.
ANANDRATHI stock has risen by 2.33% compared to the previous week, the month change is a −1.96% fall, over the last year Anand Rathi Wealth Ltd. has showed a 50.90% increase.
We've gathered analysts' opinions on Anand Rathi Wealth Ltd. future price: according to them, ANANDRATHI price has a max estimate of 2,600.00 INR and a min estimate of 1,491.00 INR. Watch ANANDRATHI chart and read a more detailed Anand Rathi Wealth Ltd. stock forecast: see what analysts think of Anand Rathi Wealth Ltd. and suggest that you do with its stocks.
ANANDRATHI reached its all-time high on Sep 18, 2025 with the price of 3,090.40 INR, and its all-time low was 271.00 INR and was reached on Feb 24, 2022. View more price dynamics on ANANDRATHI chart.
See other stocks reaching their highest and lowest prices.
See other stocks reaching their highest and lowest prices.
ANANDRATHI stock is 4.16% volatile and has beta coefficient of 0.67. Track Anand Rathi Wealth Ltd. stock price on the chart and check out the list of the most volatile stocks — is Anand Rathi Wealth Ltd. there?
Today Anand Rathi Wealth Ltd. has the market capitalization of 238.85 B, it has decreased by −1.93% over the last week.
Yes, you can track Anand Rathi Wealth Ltd. financials in yearly and quarterly reports right on TradingView.
Anand Rathi Wealth Ltd. is going to release the next earnings report on Oct 13, 2025. Keep track of upcoming events with our Earnings Calendar.
Anand Rathi Wealth Ltd. revenue for the last quarter amounts to 2.79 B INR, despite the estimated figure of 2.45 B INR. In the next quarter, revenue is expected to reach 2.91 B INR.
ANANDRATHI net income for the last quarter is 936.24 M INR, while the quarter before that showed 734.51 M INR of net income which accounts for 27.46% change. Track more Anand Rathi Wealth Ltd. financial stats to get the full picture.
Anand Rathi Wealth Ltd. dividend yield was 0.55% in 2024, and payout ratio reached 29.13%. The year before the numbers were 0.38% and 25.98% correspondingly. See high-dividend stocks and find more opportunities for your portfolio.
As of Oct 7, 2025, the company has 1.16 K employees. See our rating of the largest employees — is Anand Rathi Wealth Ltd. on this list?
EBITDA measures a company's operating performance, its growth signifies an improvement in the efficiency of a company. Anand Rathi Wealth Ltd. EBITDA is 4.60 B INR, and current EBITDA margin is 45.35%. See more stats in Anand Rathi Wealth Ltd. financial statements.
Like other stocks, ANANDRATHI shares are traded on stock exchanges, e.g. Nasdaq, Nyse, Euronext, and the easiest way to buy them is through an online stock broker. To do this, you need to open an account and follow a broker's procedures, then start trading. You can trade Anand Rathi Wealth Ltd. stock right from TradingView charts — choose your broker and connect to your account.
Investing in stocks requires a comprehensive research: you should carefully study all the available data, e.g. company's financials, related news, and its technical analysis. So Anand Rathi Wealth Ltd. technincal analysis shows the buy rating today, and its 1 week rating is buy. Since market conditions are prone to changes, it's worth looking a bit further into the future — according to the 1 month rating Anand Rathi Wealth Ltd. stock shows the buy signal. See more of Anand Rathi Wealth Ltd. technicals for a more comprehensive analysis.
If you're still not sure, try looking for inspiration in our curated watchlists.
If you're still not sure, try looking for inspiration in our curated watchlists.