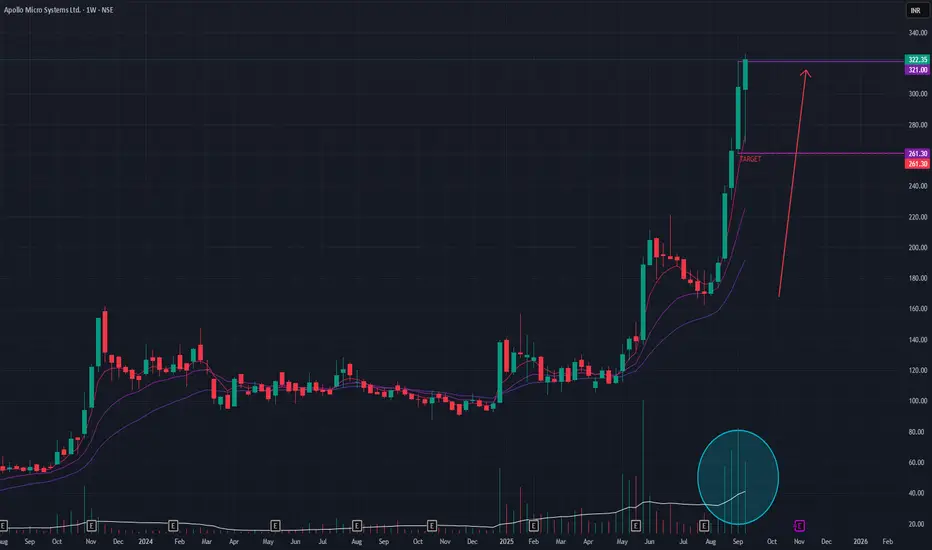
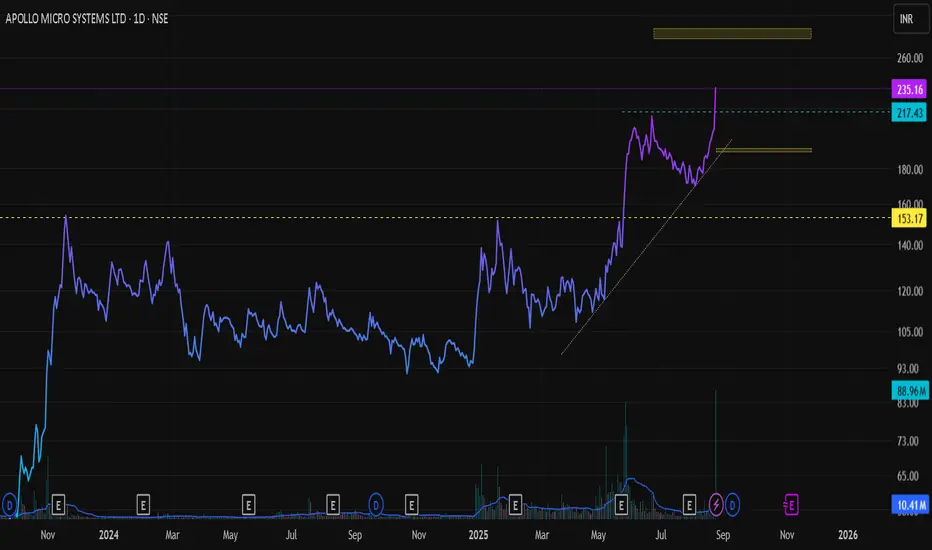
Apollo Micro Systems (Weekly Timeframe) - Momentum to continue ?Apollo Micro Systems has been in a steep, aggressive uptrend since August 2025, delivering a remarkable +92% return in a short period. The stock is exhibiting classic signs of strong bullish momentum, but the velocity of the rise warrants a closer look at its sustainability.
## Bullish Momentum
Next report date
—
Report period
—
EPS estimate
—
Revenue estimate
—
2.60 INR
563.96 M INR
5.62 B INR
161.65 M
About Apollo Micro Systems Ltd.
Sector
Industry
CEO
Karunakar Reddy Baddam
Website
Headquarters
Hyderabad
Founded
1997
ISIN
INE713T01028
FIGI
BBG00JPBZS06
Apollo Micro Systems Ltd. engages in the manufacture of electronic components and systems. It includes electronic manufacturing, hardware design, information technology and software, electronic, and mechanical services. It also offers space, and transportation solutions. The company was founded by Baddam Karunakar Reddy on March 3, 1997 and is headquartered in Hyderabad, India.
Related stocks
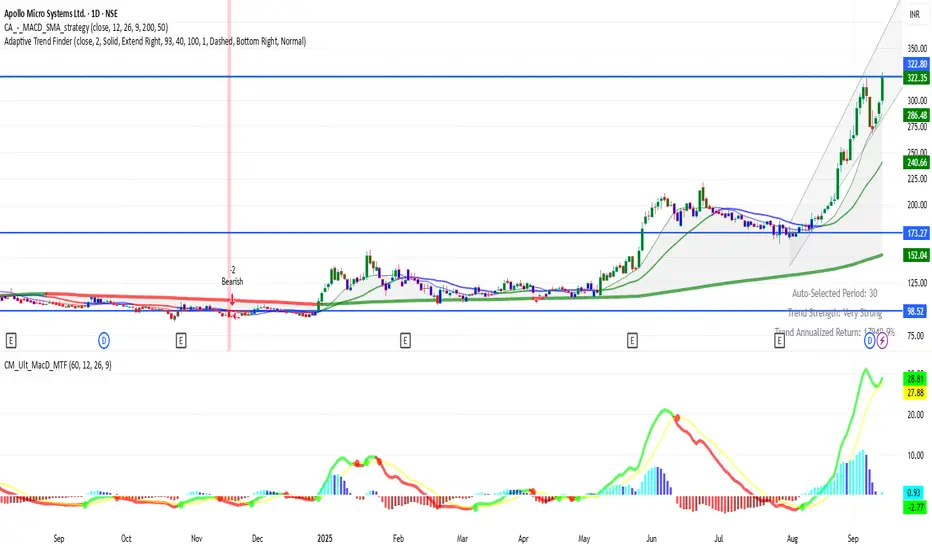
APOLLO 1D Time frame Current Status
Price: ₹322
Trend: Strong uptrend, stock recently made fresh highs.
Momentum: Very strong, but slightly overbought in daily indicators.
Key Levels
Immediate Resistance: ₹326 – ₹330 (recent high zone)
Next Resistance: ₹340 – ₹345 (if breakout continues)
Immediate Support: ₹300
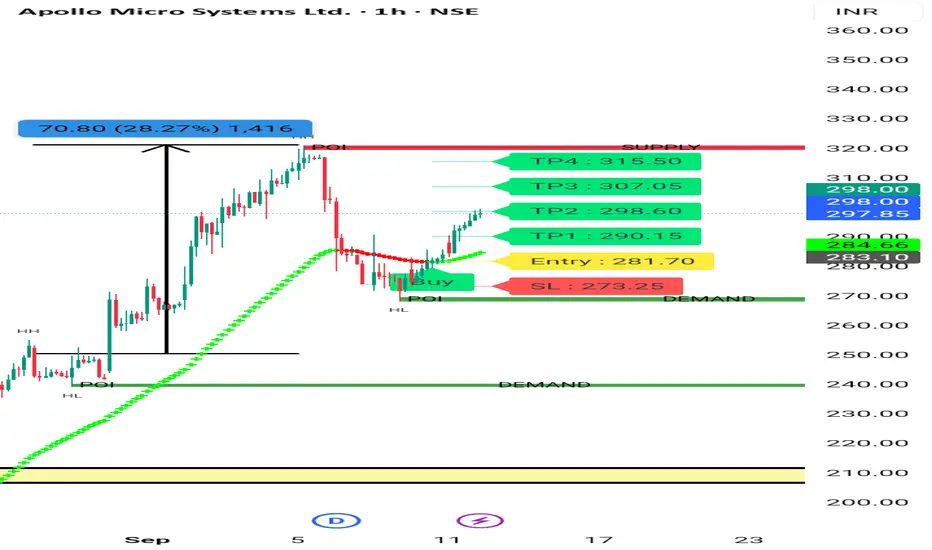
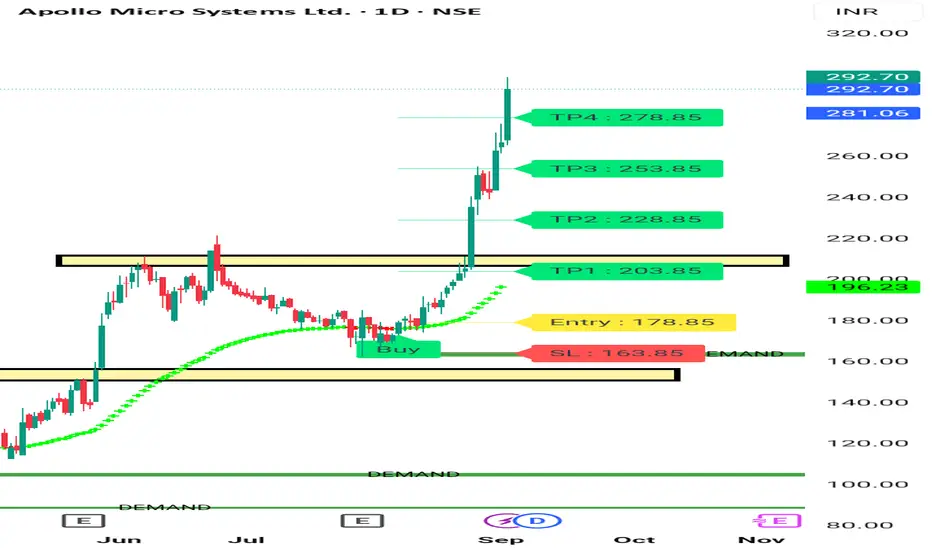
Apollo Micro System Again Upmove Apollo Micro Systems Earlier given near 250. Now Gain it's going Up after Taking Retracement. It's good sign. We can Enter at Cmp With 3 -5 % Stoploss.
It's in High Momentum.
Want to Learn more - how to Catch Such Stocks. Visit my Tradingview Profile .
Entry near 300 tgt 320 - 330 - 350 .
SL 5%
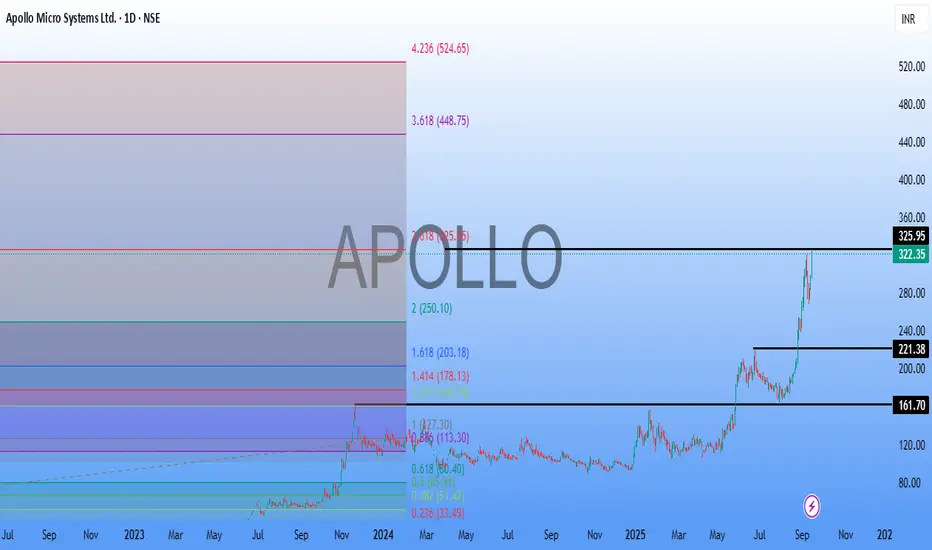
ApolloMicro SystemsApollo Micro Systems (AMS) is an Indian defense and aerospace electronics company poised for growth due to strong order books and expansion plans.
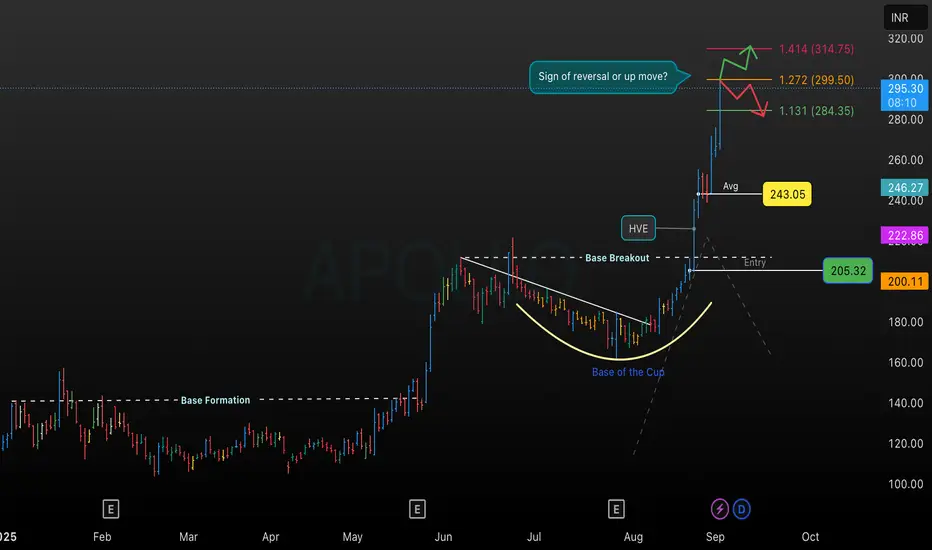
Apart from the Fundamentals, from Technical Point of view based on previous high breakout, stock has reached the Fibo Extension of 325.95. and its the Ma
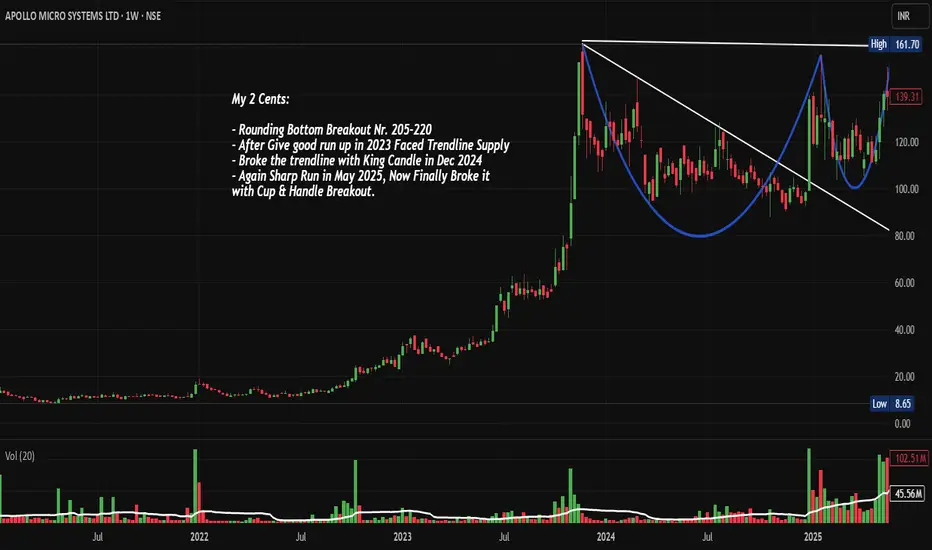
APOLLO: C&H and Rounding Bottom BO: Chart of the Week NSE:APOLLO : The Cup and Handle Breakout That Finally Delivered After Multiple False Starts with Rounding Bottom Breakout on Daily TF Let's Analyze it in the Chart of the Week.
As per the Latest SEBI Mandate, this isn't a Trading/Investment RECOMMENDATION nor for Educational Purposes; it is ju
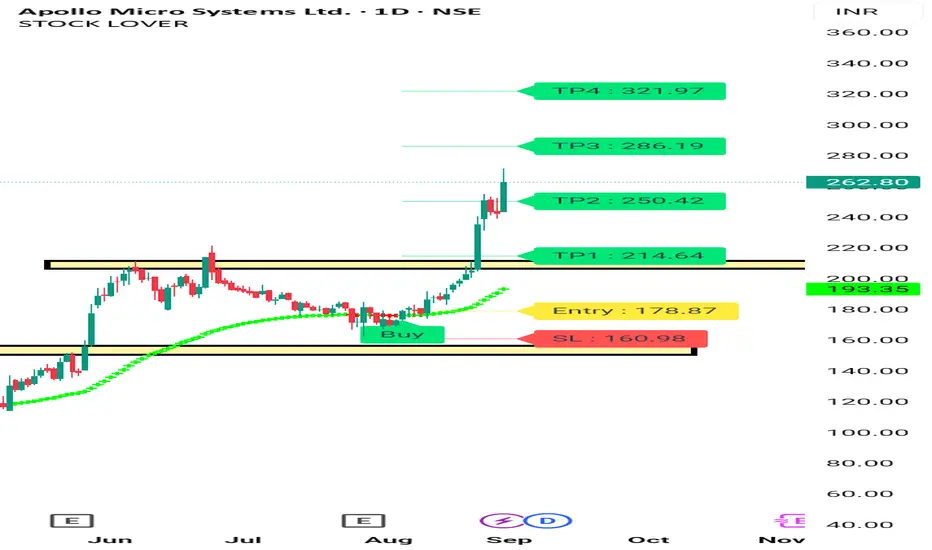
Apollo Micro Systems Movement APOLLO micro system given breakout near 210 .and I Shared The chart some days back also .now it's time to be cautious in this stock . No new entry . It's already given good returns. So no fucus on Some Other stock . Those Bought on lower levels they can trial SL.
Stock still can move upward but r
APOLLO Ignites! Explosive Move Will Bulls Hit AllFib Extensions This chart highlights Apollo’s formation of a Cup and Handle pattern, followed by a decisive breakout above the base resistance. The “Base Formation” and “Base of the Cup” mark notable accumulation phases, culminating in a sharp bullish move post-breakout.
Price Action and Levels
• Entry Trigger: T
APOLLO MICRO SYSTEM BULLISH CHART APOLLO micro system chart posted on tradingview on 24 Aug , it's moved 12% Since then. It's win a order . Chart Shows u movement before news . Keep Following Us and Enjoy. For More, watch my Profile.
Consult your financial advisor before making any position in stock market. My all views are for e
BUY TODAY SELL TOMORROW for 5%DON’T HAVE TIME TO MANAGE YOUR TRADES?
- Take BTST trades at 3:25 pm every day
- Try to exit by taking 4-7% profit of each trade
- SL can also be maintained as closing below the low of the breakout candle
Now, why do I prefer BTST over swing trades? The primary reason is that I have observed that

APOLLO - Short Term Momentun Buy with Rising StrenghtAPOLLO - Short Term Momentun Buy with Rising Strenght
Key Observations [
Volume Burst
Rising Strength
52 week + All time High BO
See all ideas
Summarizing what the indicators are suggesting.
Neutral
SellBuy
Strong sellStrong buy
Strong sellSellNeutralBuyStrong buy
Neutral
SellBuy
Strong sellStrong buy
Strong sellSellNeutralBuyStrong buy
Neutral
SellBuy
Strong sellStrong buy
Strong sellSellNeutralBuyStrong buy
An aggregate view of professional's ratings.
Neutral
SellBuy
Strong sellStrong buy
Strong sellSellNeutralBuyStrong buy
Neutral
SellBuy
Strong sellStrong buy
Strong sellSellNeutralBuyStrong buy
Neutral
SellBuy
Strong sellStrong buy
Strong sellSellNeutralBuyStrong buy
Displays a symbol's price movements over previous years to identify recurring trends.
Frequently Asked Questions
The current price of APOLLO is 267.20 INR — it has decreased by −0.94% in the past 24 hours. Watch Apollo Micro Systems Ltd. stock price performance more closely on the chart.
Depending on the exchange, the stock ticker may vary. For instance, on NSE exchange Apollo Micro Systems Ltd. stocks are traded under the ticker APOLLO.
APOLLO stock has fallen by −4.26% compared to the previous week, the month change is a −6.36% fall, over the last year Apollo Micro Systems Ltd. has showed a 182.75% increase.
We've gathered analysts' opinions on Apollo Micro Systems Ltd. future price: according to them, APOLLO price has a max estimate of 300.00 INR and a min estimate of 300.00 INR. Watch APOLLO chart and read a more detailed Apollo Micro Systems Ltd. stock forecast: see what analysts think of Apollo Micro Systems Ltd. and suggest that you do with its stocks.
APOLLO reached its all-time high on Sep 17, 2025 with the price of 354.70 INR, and its all-time low was 3.95 INR and was reached on Mar 25, 2020. View more price dynamics on APOLLO chart.
See other stocks reaching their highest and lowest prices.
See other stocks reaching their highest and lowest prices.
APOLLO stock is 2.59% volatile and has beta coefficient of 1.59. Track Apollo Micro Systems Ltd. stock price on the chart and check out the list of the most volatile stocks — is Apollo Micro Systems Ltd. there?
Today Apollo Micro Systems Ltd. has the market capitalization of 90.45 B, it has increased by 5.70% over the last week.
Yes, you can track Apollo Micro Systems Ltd. financials in yearly and quarterly reports right on TradingView.
Apollo Micro Systems Ltd. is going to release the next earnings report on Feb 6, 2026. Keep track of upcoming events with our Earnings Calendar.
APOLLO net income for the last quarter is 311.11 M INR, while the quarter before that showed 185.12 M INR of net income which accounts for 68.07% change. Track more Apollo Micro Systems Ltd. financial stats to get the full picture.
Yes, APOLLO dividends are paid annually. The last dividend per share was 0.25 INR. As of today, Dividend Yield (TTM)% is 0.09%. Tracking Apollo Micro Systems Ltd. dividends might help you take more informed decisions.
Apollo Micro Systems Ltd. dividend yield was 0.20% in 2024, and payout ratio reached 13.46%. The year before the numbers were 0.05% and 4.02% correspondingly. See high-dividend stocks and find more opportunities for your portfolio.
As of Nov 28, 2025, the company has 405 employees. See our rating of the largest employees — is Apollo Micro Systems Ltd. on this list?
EBITDA measures a company's operating performance, its growth signifies an improvement in the efficiency of a company. Apollo Micro Systems Ltd. EBITDA is 1.74 B INR, and current EBITDA margin is 23.28%. See more stats in Apollo Micro Systems Ltd. financial statements.
Like other stocks, APOLLO shares are traded on stock exchanges, e.g. Nasdaq, Nyse, Euronext, and the easiest way to buy them is through an online stock broker. To do this, you need to open an account and follow a broker's procedures, then start trading. You can trade Apollo Micro Systems Ltd. stock right from TradingView charts — choose your broker and connect to your account.
Investing in stocks requires a comprehensive research: you should carefully study all the available data, e.g. company's financials, related news, and its technical analysis. So Apollo Micro Systems Ltd. technincal analysis shows the sell today, and its 1 week rating is buy. Since market conditions are prone to changes, it's worth looking a bit further into the future — according to the 1 month rating Apollo Micro Systems Ltd. stock shows the buy signal. See more of Apollo Micro Systems Ltd. technicals for a more comprehensive analysis.
If you're still not sure, try looking for inspiration in our curated watchlists.
If you're still not sure, try looking for inspiration in our curated watchlists.