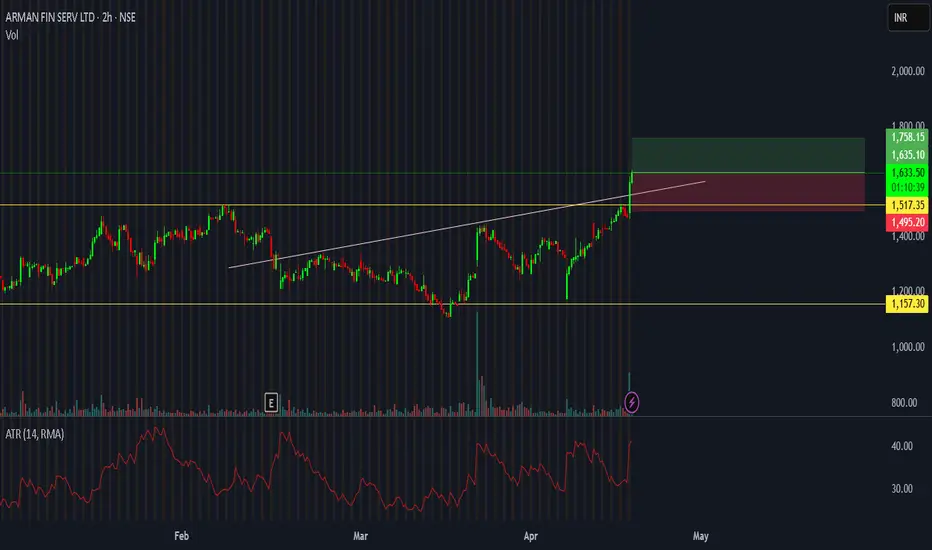
Arman Fin Serv Short Term TradeThe stock has been in consolidation since the last six months,
the area around yellow horizontal lines being the support and resistance zones,
In the last two months, a small rising trendline is visibkle within this area
Currently, the consolidation's resistance zone as well as the trendline has be
Arman Financial Services Limited
1,729.50INRR
+103.60+6.37%
At close at Nov 14, 10:12 GMT
INR
No trades
5.90 INR
520.73 M INR
7.30 B INR
6.00 M
About Arman Financial Services Limited
Sector
Industry
CEO
Jayendrabhai Bhailalbhai Patel
Website
Headquarters
Ahmedabad
Founded
1992
ISIN
INE109C01017
FIGI
BBG000DWT850
Arman Financial Services Ltd. is a holding company, which engages in the business of micro-finance. It provides two-wheeler financing for mopeds, scooterettes, and scooters and three wheeler financing for Rickshaws. The company was founded by Jayendrabhai B. Patel on November 26, 1992 and is headquartered in Ahmedabad, India.
−18%
−9%
0%
9%
18%
Q1 '24
Q2 '24
Q3 '24
Q4 '24
Q1 '25
−700.00 M
0.00
700.00 M
1.40 B
2.10 B
Revenue
Net income
Net margin %
BUY TODAY SELL TOMORROW for 5%DON’T HAVE TIME TO MANAGE YOUR TRADES?
- Take BTST trades at 3:25 pm every day
- Try to exit by taking 4-7% profit of each trade
- SL can also be maintained as closing below the low of the breakout candle
Now, why do I prefer BTST over swing trades? The primary reason is that I have observed that

ARMANFIN Long Idea ......ARMANFIN Technical: chart is looking good for reversal.
Stoploss & Targets are given in chart. In coming growth cycle, it might touch Channel high.
Risk Management is very Important as Micro-Finance Industry is in bad shape right now.
NOTE: It is NBFC with 2Wheeler, Microfinance, and MSME L

Double bottom Trade setup ARMAN FIN Double Bottom Trade Setup
Pattern Identification
Double Bottom: Identified on the daily chart, indicated by the green line.
Neckline (Blue Line): The key resistance level to watch for a breakout.
Trade Entry
Entry Point: Above the neckline, specifically at the 1408 level.
You are looking for a br


BUY TODAY SELL TOMORROW for 5%ON’T HAVE TIME TO MANAGE YOUR TRADES?
- Take BTST trades at 3:25 pm every day
- Try to exit by taking 4-7% profit of each trade
- SL can also be maintained as closing below the low of the breakout candle
Now, why do I prefer BTST over swing trades? The primary reason is that I have observed that 9

ARMANFIN 30% upside potential great growth and at low valuation.
Name = Arman Financial
CMP Rs. = 2028.3
Mar Cap Rs.Cr. = 1985.16
Qtr Profit Var % = 91.08
Sales growth % = 79.2
Profit growth % = 115.13
3mth return % = -23.96
ATH % Diff % = 24.32
PEG = 0.19
P/E = 12.48
NP 12M Rs.Cr. = 158.96
Ind PE = 20.08
ROE 3Yr % = 20.41
Sale


Arman Financial - Channel BottomNBFC's are in an upcycle and this co is growing at 30-40% as things stand.
The stock price is at a channel bottom so could rebound from here.
Long if it bounces tomorrow with a stoploss below 1150 for short term and if your investing then around 1090 is a breakout retest..look for a bounce there

See all ideas
Summarizing what the indicators are suggesting.
Oscillators
Neutral
SellBuy
Strong sellStrong buy
Strong sellSellNeutralBuyStrong buy
Oscillators
Neutral
SellBuy
Strong sellStrong buy
Strong sellSellNeutralBuyStrong buy
Summary
Neutral
SellBuy
Strong sellStrong buy
Strong sellSellNeutralBuyStrong buy
Summary
Neutral
SellBuy
Strong sellStrong buy
Strong sellSellNeutralBuyStrong buy
Summary
Neutral
SellBuy
Strong sellStrong buy
Strong sellSellNeutralBuyStrong buy
Moving Averages
Neutral
SellBuy
Strong sellStrong buy
Strong sellSellNeutralBuyStrong buy
Moving Averages
Neutral
SellBuy
Strong sellStrong buy
Strong sellSellNeutralBuyStrong buy
Displays a symbol's price movements over previous years to identify recurring trends.
1020AFSL26
Arman Financial Services Ltd. 10.2% 25-JAN-2026Yield to maturity
9.49%
Maturity date
Jan 25, 2026
114AFSL28
Arman Financial Services Ltd. 11.4% 05-JUN-2028Yield to maturity
—
Maturity date
Jun 5, 2028
1110AFSL30
Arman Financial Services Ltd. 11.1% 01-JUL-2030Yield to maturity
—
Maturity date
Jul 1, 2030
See all ARMANFIN bonds
Frequently Asked Questions
The current price of ARMANFIN is 1,729.50 INR — it has increased by 6.37% in the past 24 hours. Watch Arman Financial Services Limited stock price performance more closely on the chart.
Depending on the exchange, the stock ticker may vary. For instance, on NSE exchange Arman Financial Services Limited stocks are traded under the ticker ARMANFIN.
ARMANFIN stock has risen by 8.70% compared to the previous week, the month change is a 6.29% rise, over the last year Arman Financial Services Limited has showed a 33.86% increase.
ARMANFIN reached its all-time high on Dec 21, 2023 with the price of 2,680.00 INR, and its all-time low was 163.35 INR and was reached on Nov 16, 2016. View more price dynamics on ARMANFIN chart.
See other stocks reaching their highest and lowest prices.
See other stocks reaching their highest and lowest prices.
ARMANFIN stock is 8.71% volatile and has beta coefficient of 1.51. Track Arman Financial Services Limited stock price on the chart and check out the list of the most volatile stocks — is Arman Financial Services Limited there?
Today Arman Financial Services Limited has the market capitalization of 18.19 B, it has increased by 0.57% over the last week.
Yes, you can track Arman Financial Services Limited financials in yearly and quarterly reports right on TradingView.
ARMANFIN net income for the last quarter is −145.84 M INR, while the quarter before that showed 127.64 M INR of net income which accounts for −214.26% change. Track more Arman Financial Services Limited financial stats to get the full picture.
Arman Financial Services Limited dividend yield was 0.00% in 2024, and payout ratio reached 0.00%. The year before the numbers were 0.00% and 0.00% correspondingly. See high-dividend stocks and find more opportunities for your portfolio.
As of Nov 16, 2025, the company has 1.15 K employees. See our rating of the largest employees — is Arman Financial Services Limited on this list?
EBITDA measures a company's operating performance, its growth signifies an improvement in the efficiency of a company. Arman Financial Services Limited EBITDA is 3.05 B INR, and current EBITDA margin is 35.06%. See more stats in Arman Financial Services Limited financial statements.
Like other stocks, ARMANFIN shares are traded on stock exchanges, e.g. Nasdaq, Nyse, Euronext, and the easiest way to buy them is through an online stock broker. To do this, you need to open an account and follow a broker's procedures, then start trading. You can trade Arman Financial Services Limited stock right from TradingView charts — choose your broker and connect to your account.
Investing in stocks requires a comprehensive research: you should carefully study all the available data, e.g. company's financials, related news, and its technical analysis. So Arman Financial Services Limited technincal analysis shows the strong buy rating today, and its 1 week rating is buy. Since market conditions are prone to changes, it's worth looking a bit further into the future — according to the 1 month rating Arman Financial Services Limited stock shows the buy signal. See more of Arman Financial Services Limited technicals for a more comprehensive analysis.
If you're still not sure, try looking for inspiration in our curated watchlists.
If you're still not sure, try looking for inspiration in our curated watchlists.