ARVINDFASN trade ideas
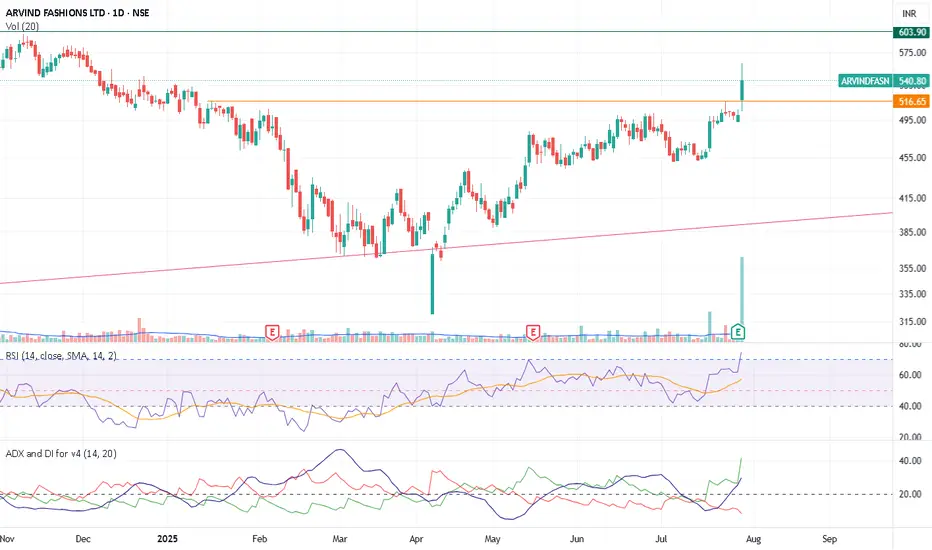
ARVINDFASNARVINDFASN showing very good strength on this negative days as well and currently trying to coming out of consolidation. As long as it is closing above 440 then dips are good to accumulate. Positive momentum may fetch the stock up to 600 in near term. And next trigger level can b above 485. Wait for the perfect entry point.
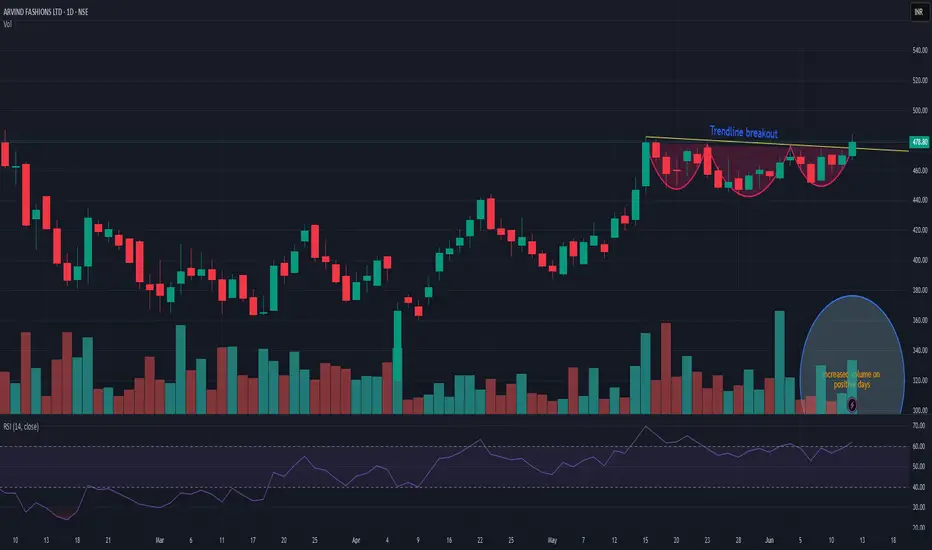
Look out for reversal signs in Arvind fashionStock nearing the previous resistance level
this is also a confluence area of trend line support and close to 200sma...

Arvind Fashion - 2 Cup & Handle Patterns!!Arvind Fashion has given breakout of Cup & Handle pattern on weekly time frame. If you observe there is a smaller cup and handle pattern as well in the larger cup & handle pattern. We can see price moving towards our targets of 560-685-950+. Other factors:
1. Weekly volume is great
2. RSI is +ive
3. Fundamentally company is doing great - from loss making to profit making, new stores, etc.
Keep following Cleaneasycharts - Right Stock at Right Time at Right Price!!!
Cheers!!!

ARVIND FASHIONS ready for final targetArvind Fashions Ltd operates in the branded apparels, beauty and footwear space. It has a portfolio of several owned and licensed global brands across different segments.

ARVIND FASHIONS LTD - BREAKOUT STOCK FOR SWINGToday's Candle type is Demand Candle.
Volume is Greater than Pervious Session by 102%.
Price Above 50-100-200 Moving Average.
MA alignment is bullish.
Daily , Weekly , Monthly RSI all above 50 means in Bullish Zone.
Daily ADX also remains bullish.
Good above 585
Weak Below 550
Ready For Upside 650-700+

Arvind Fashions cmp 572 by Weekly Chart view since listedArvind Fashions cmp 572 by Weekly Chart view since listed
- Support Zone at 520 to 535 Price Band
- Volumes are increasing month on month showing good demand based buying here
- Weekly basis : Support at 520 > 465 > 390 with Resistance at 639 > 710 >> ATH 810.20
- 5+ odd years long timeframe Bullish Cup & Handle done with the neckline at Support Zone followed by tiny Rounding Bottom done

ARVINDFASN - Cup and Handle -Breakout-WklyARVINDFASN - Cup and Handle -Breakout-Wkly
Name - ARVINDFASN
Pattern - Cup and Handle
Timeframe - Wkly
Status - Breakout
Volume - Good
Cmp - 580
Target - 954
SL - 533

cup n handle breakout in ARVIND FASHIONSArvind Fashions Ltd operates in the branded apparels, beauty and footwear space. It has a portfolio of several owned and licensed global brands across different segments.

Arvind Fashion- Participating in Textile growth- Best above 561Arvind Fashion - Like other Textile stocks, is making move in
anticipation of PLI scheme.
the stock started making moves. One can enter at current price i.e. 545, however
safe entry would be above 561 with stop loss of 435 on weekly closing basis.
Pro tip : Keep booking profits after it hits first and 2nd target.
Disclaimer :Educational content. Please do your own research.

arvind fashion ltd head and shoulder patternstock : arvind fashion ltd
trade : long (cash segment )
buy @ 495 above
sl @ 471
t1 @ 530
t2 @ 570
note :
this information is for education only

ARVIND FASHIONSThe stock is in bullish channel and making HHs HLs and expected to breakout soon with big volume. Target 20-40%
NOTE: I'm not a SEBI REG. Study before investing.

Arvind Fashions - What's next?Arvind Fashions is a textile company engaged in manufacturing and supplying denim and textile products worldwide.
TTM EPS: 1.82
TTM PE: 211.84
P/B: 5.64
Face Value: 4
Mkt Cap (Rs. Cr.): 5,125
Sector PE: 55.73
Book Value Per Share: 68.42
Positives:
Strong Momentum: Price above short, medium and long term moving averages
Strong Annual EPS Growth
Effectively using its capital to generate profit - RoCE improving in last 2 years
Effectively using Shareholders fund - Return on equity (ROE) improving since last 2 year
Efficient in managing Assets to generate Profits - ROA improving since last 2 year
Growth in Net Profit with increasing Profit Margin (QoQ)
Growth in Quarterly Net Profit with increasing Profit Margin (YoY)
Strong cash generating ability from core business - Improving Cash Flow from operation for last 2 years
Company able to generate Net Cash - Improving Net Cash Flow for last 2 years
Annual Net Profits improving for last 2 years
Book Value per share Improving for last 2 years
FII / FPI or Institutions increasing their shareholding
Near 52 Week High
NOT A RECOMMENDATION. JUST FOR EDUCATION PURPOSE. Thanks

ARVINDFASN | Swing Trade📊 Details
Arvind Fashions Ltd operates in the branded apparels, beauty and footwear space. It has a portfolio of several owned and licensed global brands across different segments.
Disclaimer: This analysis is solely for educational purposes and does not make me a SEBI registered analyst.
If you found this analysis helpful, I encourage you to like and share it. Your observations and comments are also welcomed below. Your support, likes, follows, and comments motivate me to consistently share valuable insights with you.
🔍 More Analysis & Trade Setups 🔍
For more technical analysis and trade setups, make sure to follow me on TradingView: www.tradingview.com

Arvind Fashions LimitedArvind Fashions Limited
OPEN=LOW
stock having Open price equal to Low which is used to find stock having positive trend for short term.

ARVIND FASHION LTDFOR LEARNING PURPOSE
ARVIND FASHION-
I am going to buy this stock as its looking great.
Its chart structure is great and its breaking its 4 year resistance
I am looking for minimum 30-35% gain
SL is marked

Arvind Fashion - Ascending TrianglePurely a positional call
Arvind Fashion - CMP : 335
Ascending Triangle Formation
We can play for the target i.e the gap around 415
Stop loss will be if the below trendline support breaks
Trade according to your risk

ARVINDFASN - Cup & Handle BreakoutARVINDFASN has formed beautiful Cup & Handle pattern.
Entry is above 390+(mahurat day closing)
SL - 368
Target - 440, 460
Thanks
Piyush Gupta
Learn & Earn

ARVINDFASN BO [Weekly]ARVINDFASN BO on a large weekly base with decent volumes. Issue here is that this is a third attempt at breaking out and chart seems choppy which is not helping. This might whip back and forth, might be a good try to check daily charts for this to keep a tight SL.
Regardless, good volumes, large base and price movement. Checks all 3 boxes to keep track of :)

BREAKOUT IN ARVIND FASHION 📌SWING TRADE FOR NEXT WEEK🚀
Hello guys,
I am a swing trader by passion i only trade on swing stocks.
📌I post daily SWING CHARTS analysis on my trading view profile..
so let's start
📌TRADE ANALYSIS OF ARVIND FASHION :-
•Breakout of symetrical pattern on WTF with strong candle
•Break counter trend line and hidden lines
•Volume increases last few weeks high
•Bullish trend/ make good structure also
•Made good price action
•Make higher highs/higher lows
📌 If you have any questions about any stock you can DM me Or comment on post 📱
📌Disclaimer:-
This all chatrs analysis are only for educational purposes only
I do not provide any CALL or Tips

A Continuation Wedge (Bullish) pattern in ARVINFASN A Continuation Wedge (Bullish) is a technical chart pattern often observed in financial markets, particularly in price charts of stocks, currencies, commodities, and other assets. This pattern is characterized by its appearance during an uptrend and signifies a temporary pause or consolidation before the prevailing uptrend resumes.
Here's a breakdown of its features and implications:
Pattern Appearance: The Continuation Wedge (Bullish) consists of two converging trendlines, both of which slant downward against the prevailing uptrend. The upper trendline, often referred to as the resistance line, is formed by connecting the swing highs (peaks) of the price action. The lower trendline, known as the support line, is created by joining the swing lows (troughs) of the price action. As the pattern evolves, these trendlines gradually converge, forming a wedge-like shape.
Duration: This pattern typically spans a relatively short period, usually a few weeks to a few months, during which the price movement becomes increasingly narrower within the confines of the converging trendlines.
Volume: Throughout the formation of the Continuation Wedge (Bullish), trading volume often contracts. This decrease in volume signifies a lack of conviction among traders and investors, contributing to the narrowing price range.
Market Psychology: The pattern reflects a tug of war between bullish and bearish forces. The bears attempt to reverse the ongoing uptrend, causing the price to move within the confines of the converging trendlines. However, despite the bearish pressure, the bulls eventually gain the upper hand, leading to a breakout to the upside.
Breakout: The most critical aspect of the Continuation Wedge (Bullish) is the breakout. The bullish breakout occurs when the price breaches and closes above the upper trendline (resistance line) of the pattern. This breakout signals the end of the temporary interruption and the resumption of the prior uptrend.
Price Target: To estimate the potential price target following the breakout, you can measure the height of the widest part of the wedge (the distance between the highest and lowest points of the wedge) and add it to the breakout point. This can provide a rough idea of how far the price might move upward after the breakout.
Confirmation: As with any technical pattern, it's important to wait for confirmation of the breakout before making trading decisions. Traders often look for a clear, convincing close above the upper trendline and an increase in trading volume to confirm the validity of the breakout.
Remember that while technical analysis can provide valuable insights, it's not foolproof and should be used in conjunction with other forms of analysis and risk management strategies.
Note for everyone who came across this reference:
This chart analysis is only for reference purpose.
This is not buying or selling recommendations.
I am not SEBI registered.
Please consult your financial advisor before taking any trade.

ARVINDFASN - Weekly AnalysisIn the Weekly Chart of ARVINDFASN ,
we can see that, it has multiple rejections at 360-375 levels.
Let it retest the W pattern breakout properly and create a Pinbar or Halt candle then we will enter with SL.

Arvind Fashion Symmetrical BreakoutArvind Fashion Symmetrical Breakout on 1 hr tf
can look for 345 risk reward ratio will be 2.01
dc : only for educational and learning purpose
