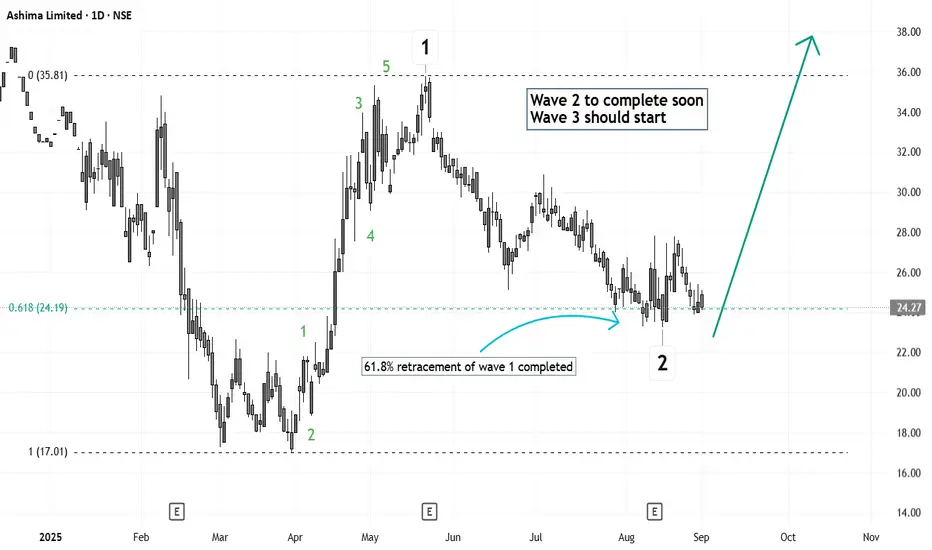
Elliott Wave Analysis of Ashima Ltd ASHIMASYNThe script is probably in a corrective wave which is about to complete soon and an impulse wave up might be the next. The retracement has completed 61.8% retracement.
ASHIMASYN trade ideas
Ashima cmp 30.50 by Monthly Chart view since been listed*Ashima cmp 30.50 by Monthly Chart view since been listed*
- Resistance Zone 36.50 to 39 Price Band
- Support Zone 28.75 to 31 and a probable Resistance zone too
- Weekly basis Support at 23 > 16 > 8 with Resistance at 40 >>> ATH 51.60
- Stock Price is trailing and moving well above the EMA 14, 21, 50, 100 and 200 levels
- *Just tad long of +17 year's time frame of closely Combined, Interconnected and Intertangled Bullish Rounding Bottoms all indicative of huge upside*

ASHIMA - TEXTILE COMPANY ATTEMPTING MULTIYEAR BREAKOUTGreat Fundamentals for this quarter
PE of only 6.85, EPS rise from 0.18 to 5 QoQ
Huge Volume support
Greater than 70% promoter stake

ASHIMA - Long term Breakout - 24years Using monthly chart to show the long term break out
Today Broken 24 years high (40.38) with rising volumes.
Past week it has made strong foundation near it 2018 high of 38.35
Sequential Targets :
46/57/64/77/84
SL: 38 (Will trail with targets)

AshimaAshima - Near 29th years of breakout.
Above 46, we can see sharp up move as there is a breakout.
Buying volume is high on this level and all targets are in the chart.
Looks good to buy and hold for the long term. Big target we can see.


Ashima : Best to Add above 38. SL - 26Ashima is at 6 year breakout with excellent last quarter results.
Best time to add is above 38.
Always average up when you are unsure on how the stock may behave.
With stoploss - 26 / 18
Disclaimer : Please do your own research !!

2 Amazing swing trading idea for 24 AprilI daily make educational content videos for swing / positional trading

Triangle Breakout- ASHIMAAscending triangle breakout with volume spurt
Trading above EMA50
RSI above 70 and rising

BREAKOUT IN ASHIMSYAN 📌SWING TRADE FOR NEXT WEEK🚀
Hello guys,
I am a swing trader by passion i only trade on swing stocks.
I post daily SWING CHARTS analysis on my trading view profile..
so let's start
📌TRADE ANALYSIS OF ASHIMASYN :-
•Breakout of symetrical pattern on WTF with strong candle
•Break counter trend line and hidden lines
•Volume increases last few weeks high
•Bullish trend/ make good structure also
•Made good price action
•Make higher highs/higher lows
📌 Add on your watchlist....
📌 If you have any questions about any stock you can DM me Or comment on post 📱
📌Disclaimer:-
This all chatrs analysis are only for educational purposes only
I do not provide any CALL or Tips

High Volume Range Breakout When price break any well defined boundary above 200 Day Moving average with high Volume and sustain then high probability price continue the trend . Our work is only Manage Quantity and Risk . SL- as per your risk appetite ( Below today's candle low or below 200 DMA Closing)


IS THIS EVEN A PATTERN?? BO 😂 ASHIMASYN [Very Small Cap]📌 Only for Educational Purpose.
📌 This idea is part of the experiment to figure out if technical patterns work on fundamentally weak companies too. I'll trade it with a very tight stop loss.
☆ Kindly like & share ➥ this pattern. Comment ⎚ with what do you think. Follow me @ tradingview for more updates and like the chart ❤!!

