ASHOKA Bullish; above 151.75 on Tuesday 12 Dec. The above information does not constitute investment/trading recommendation and it is purely for educational purpose. Please check the Strategy below...
SWING Trading Strategy:
Position is created, only upon stock closing above the entry price on day closing basis and is held on for 5-10 trading sessions for larger gains (5-10%)
INTRADAY Trading Strategy:
1) Impulse upmove stage: The strong upmove (nearly upto 2% from breakoutprice) happens within five to 15 minutes. "High Risk Traders" buys in hope of another 2% upmove intraday.
"High Risk Traders" may have to patiently wait through the Pullback-Consolidation stage to realize profits. High risk/High reward set up as breakouts may fakeout (reversal)also
2) Pullback-Consolidation stage: After the above "Impulse upmove stage"; the price may then pull back and move sideways (between "Open" price and "High" of the above "Impulse upmove stage").
Safe traders with minimum risk profile may Wait for a breakout from the consolidation to enter at this stage to relize high profits in the final intraday final "Breakout continuation" stage
3) Breakout continuation: Stocks often in the third stage breaks up above the "High" of the first "Impulse upmove stage" and continue to go higher again.
Both Safe Traders/High Risk Traders book profits at this stage
Stop Loss: @ "Open" price of the day OR "Breakoutprice"
This do not constitute, financial, investment, trading, or other types of advice or recommendation.
ASHOKA trade ideas

#ASHOKA (Weekly)⚡️Low Debt
⚡️5Y Profit Growth of 41% CAGR
⚡️FIIs DIIs increased stake
⚡️5 Years Long Base
⚡️Volume rising
🔴 SL 133
🟡 CMP 140
🟢 TGT 154/175/210


ASHOKAASHOKA :- Is going to give breakout, that too with good volume
Hello traders,
As always, simple and neat charts so everyone can understand and not make it too complicated.
rest details mentioned in the chart.
will be posting more such ideas like this. Until that, like share and follow :)
check my other ideas to get to know about all the successful trades based on price action.
Thanks,
Ajay.
keep learning and keep earning.

Ashoka Buildcon Ltd #Ashoka
CMP ₹.123.9
Technically looking good. 1 year resistance trend line broken. 4 months long Upward parallel channel broken, retested and bounce back. Further movement of 25% expecting.
Disclaimer : Post only for educational purpose. Not a buying / selling recommendation. This is only my personal view. I am not a SEBI registered analyst . Do your own analysis and act accordingly .

ASHOKA - Ichimoku BreakoutStock Name - Ashoka Buildcon Limited
Ichimoku Cloud Setup :
1). Today's close is above the Conversion Line
2). Future Kumo is Turning Bullish
3). Chikou span is slanting upwards
All these parameters are showing bullishness at Current Market Price
and more bullishness AFTER crossing 126
#This is not Buy and Sell recommendation to any one. This is for education purpose and a helping hand to learn trading in Market.
#CloudTrading
#IchimokuCloud
#IchimokuFollowers
#Ichimokuexpert
I hope you all like my analysis.
Please do share your thoughts into comment section.
Please give a like, share & subscribe for daily analysis.

MOMENTUM AND POSSIBLE BREAKOUT Stock is moving up with significant volume , broke long term trendline this month and now at the verge of a breakout can buy this with mentioned stoploss and target if 1:2.

Bullish Volume Blast in Ashoka BuildconWeekend Pick 2: Ashoka Buildcon
Fundamental : Very Strong. Growing Sales, Profits. Significant Debt reduction.. High CAGR% Growth!
Technicals : Triangle Breakout after huge consolidation and Volume blast. Well placed MAs
R 1: 145
R 2: 170
R 3: 200+
SL : 95

Ashoka buildcon Ashoka buildcon.. cheapest infra stock.. showing good top and bottom line growth. CMP:122 stoploss:98(wcb) Target:145/170/190/open

Ashoka --- can provide significant upmove in coming monthsNSE:ASHOKA
This stock is nicely poised for solid gains in coming months
already given weekly breakout at 90 levels
worth studying
This analysis is being done for educational and knowledge-sharing purposes.
This article does not offer any kind of buy or sell advice.

📈 Exciting Bullish Pattern Alert! 🐂📈 Exciting Bullish Pattern Alert! 🐂
📊 Pattern: Wedge pattern breakout with Rising Channel
📌 Symbol/Asset: ASHOKA
🔍 Description: Stock has formed wedge pattern around the support and it might go upto till upper resistance of channel.
👉 Disclosure: We are not SEBI registered analysts, this is not a buy or sell recommendation. Technical patterns are just one piece of the puzzle. Consider conducting further research, consulting with a financial advisor, and managing your risks appropriately.

Ashoka Buildcon Long EntryNSE:ASHOKA Harami candle s formation near the support of 10 DEMA enough for positional entry with calculated risk reward.
Disclaimer: Not at all a recommendation but just for community sharing.

buy ashoka buildconstock giving clear breakout with heavy volume
one can buy with sl of 82
long term term is 180

Ashok build bullish viewAshok building , bullish view, pullback/retracement, weekly volume growing, price increasing, trending upside for 10 to 15 percent. Good RR

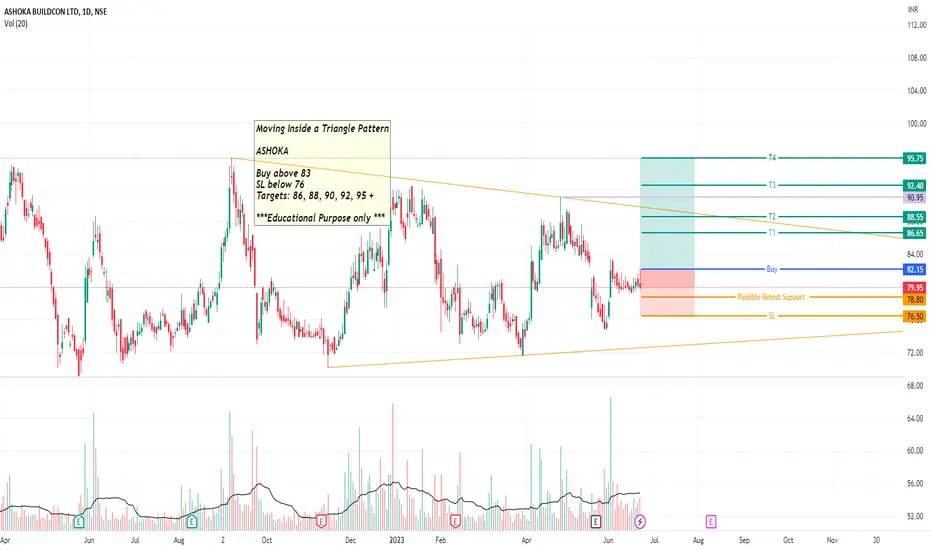
ASHOKA LongMoving Inside a Triangle Pattern
ASHOKA
Buy above 83
SL below 76
Targets: 86, 88, 90, 92, 95 +
***Educational Purpose only ***
ASHOKA BUILDCON | SWING TRADE | BULLISH MOMENTUMASHOKA BUILDCON | SWING TRADE | BULLISH MOMENTUM
1.Triangle Breakout
2.Volume Breakout
3.Bullish Momenum

3 Amazing potential swing trades for 13 July Markets I daily make educational content videos for swing / positional trading

Ashoka buildcon Ashoka buildcon
moved out of 1 consolidation phase
gave powerfull breakout yesterday
might face a small resistance near 91 levels
once cross and sustain will fly higher
Entry at 86 , can head towards 110 - 125
once hit , will upgrade target
keep sl 74

ASHOKA BUILDCONPlease wait for breakout in monthly time frame and trade accordingly.
PS: Do your own research
Drop in your doubts in the comments section
Thank you.

Strong Rejection after retest#BREAKOUTSTOCKS
- ASHOKA
- BO at the major support
- Retested with Dried up volume followed by a strong
Rejection candle
- Big Volume on BO and rejection
- Bullish RSI on D tf
- Trading above all major EMAs

ASHOKA BUILDCON - 40% RETURNS!!!BUY - ASHOKA BUILDCON LTD
CMP - Rs. 74
Target - 1: Rs. 82
Target - 2: Rs. 92
Target - 3: Rs. 105
.
.
.
Technicals - Bullish Snorm Harmonic Pattern
.
.
Follow me for more!

Positional or Longterm Opportunity in Ashoka Go Long above 87.3 for Targets of 97.1, 106.9, and 116.7 with SL 77.5
Reasons to go Long :
1. On a Weekly timeframe if we draw the Fibonacci retracement tool from the recent swing low (point A) to the recent swing high (point B) then we see stock took support from 0.618 Fibonacci level.
2. In addition to this a bullish candlestick pattern Bullish Engulfing (marked with orange color) is formed.
3. In addition to this there is a strong demand zone (marked with purple color), from which the stock initially faced resistance but now is taking support and moving up.
4. Also the stock gave a trendline breakout.
5. Also the stock formed a Bullish chart pattern Double Bottom (marked with a dotted line).

Good fundamentals and technical support for a good returnPotential to shoot up to given target above the trend lines. Fundamentals also support the prediction.
