Will Aster DM Reverse from the Demand Zone ? cmp 563.70Stock Update – *Aster DM Healthcare cmp 563.70*
The stock has corrected around 26% from its all time high and is now taking support on a major weekly demand zone.
Turned technically bullish & Price action near support shows stability which indicating a potential trend reversal from lower levels.
Aster DM Healthcare Ltd.
No trades
Next report date
—
Report period
—
EPS estimate
—
Revenue estimate
—
6.55 INR
53.78 B INR
41.38 B INR
243.62 M
About Aster DM Healthcare Ltd.
Sector
Industry
CEO
Alisha Moopen
Website
Headquarters
Dubai
Founded
1987
IPO date
Feb 26, 2018
Identifiers
2
ISIN INE914M01019
Aster DM Healthcare Ltd. engages in the provision of healthcare solutions. It operates through the following segments: Hospitals, Clinics, Retail Pharmacies, and Others. The Hospitals segment manages hospitals and in-house pharmacies at the hospitals. The Clinics segment consists of clinics and in-house pharmacies at the clinics. The Retail Pharmacies segment includes standalone retail pharmacies and optical outlets. The Others segment provides healthcare consultancy services and others. The company was founded by Mandayapurath Azad Moopen in 1987 and is headquartered in Dubai, the United Arab Emirates.
Related stocks

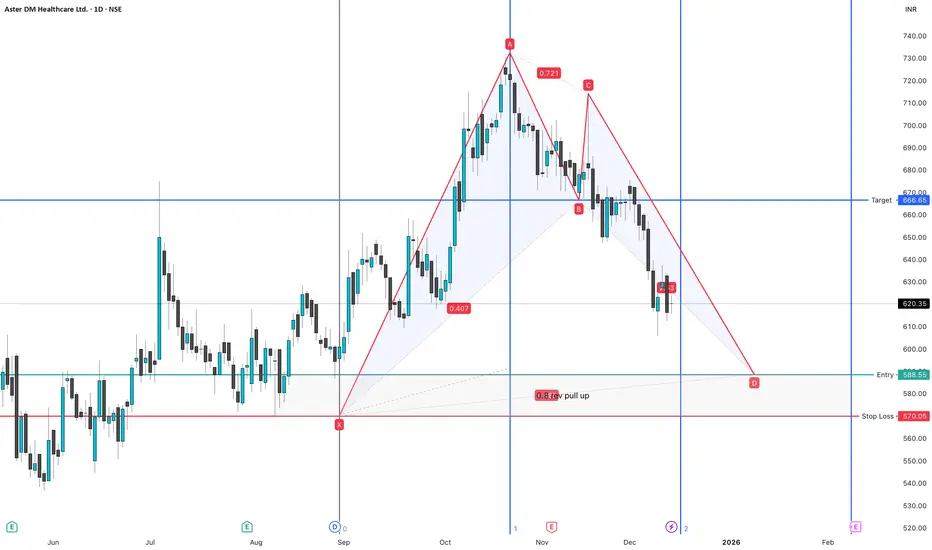
ASTERDM Bull 0.8 rev - BAT pattern , 1 day frameASTERDM Bull 0.8 rev - BAT pattern , 1 day frame
order block on bottom , rsi below 30 mostly goes up set stop loss and arget
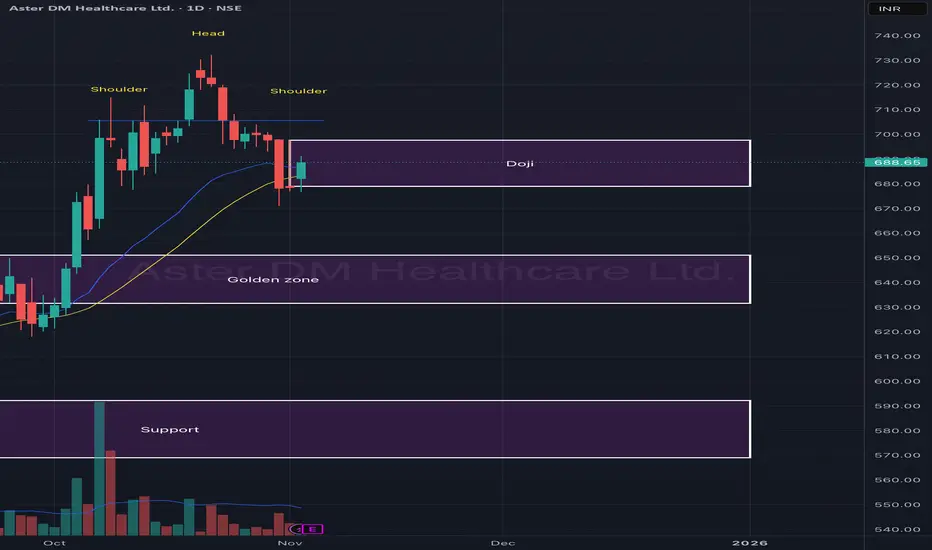
Aster DM Healthcare Ltd – Head & Shoulders Pattern with Doji at Aster DM Healthcare is currently forming a Head & Shoulders pattern, indicating potential short-term distribution after a strong uptrend. The right shoulder has developed with a Doji candle near support — suggesting indecision and possible reversal or continuation depending on the next few sessions.
Aster DM looking good for upsideAster DM looking good for upside targets are favourable for rr greater than 1 : 3
ASTER DM (Aster DM Healthcare)ASTER DM looks strong.
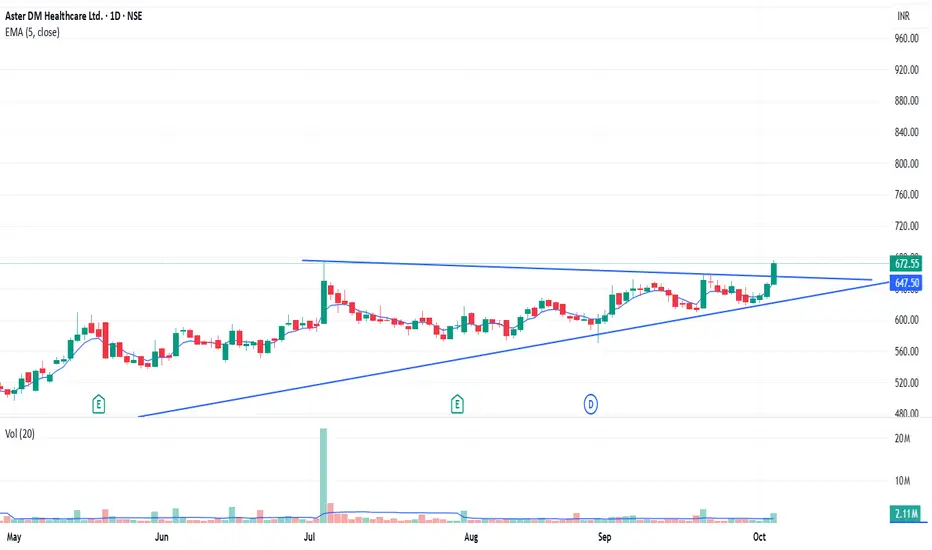
It faced resistance near 604–610, broke out on 3rd July, and then re-tested that level.
The stock is trading above all key EMAs (20, 50, 100, 200) and has been in a long-term uptrend for nearly 5 months.
With recent strong results, there’s a probability of an upside move.

ASTERDM – Strong Breakout, Eyes on ₹670+Aster DM Healthcare is showing strong momentum with today’s ~6% surge. Price has broken above EMA 50 and is sustaining well.
🔹 Immediate support: ₹621
🔹 Next resistance: ₹670–680 zone
🔹 RSI: 63 → still has room before overbought levels
🔹 Trend: Bullish bias as long as price stays above ₹621
📈 I
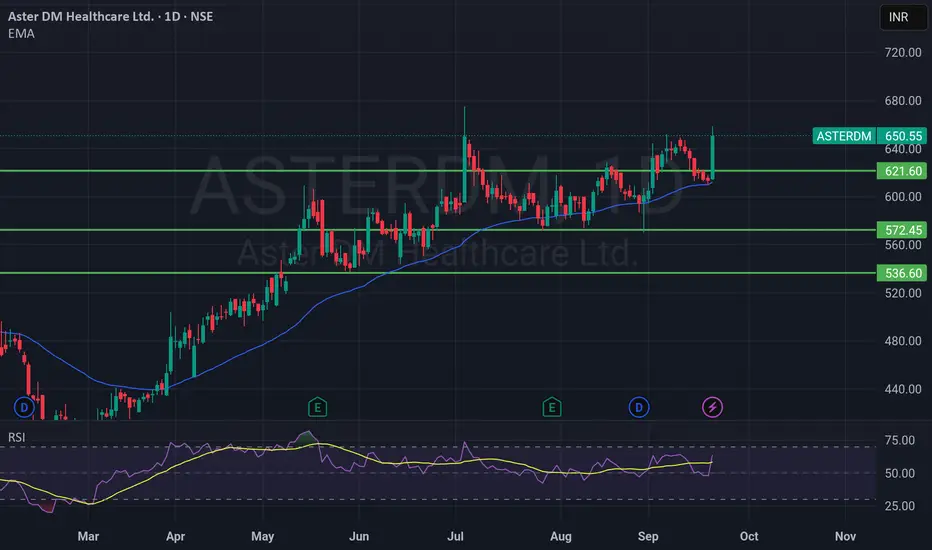
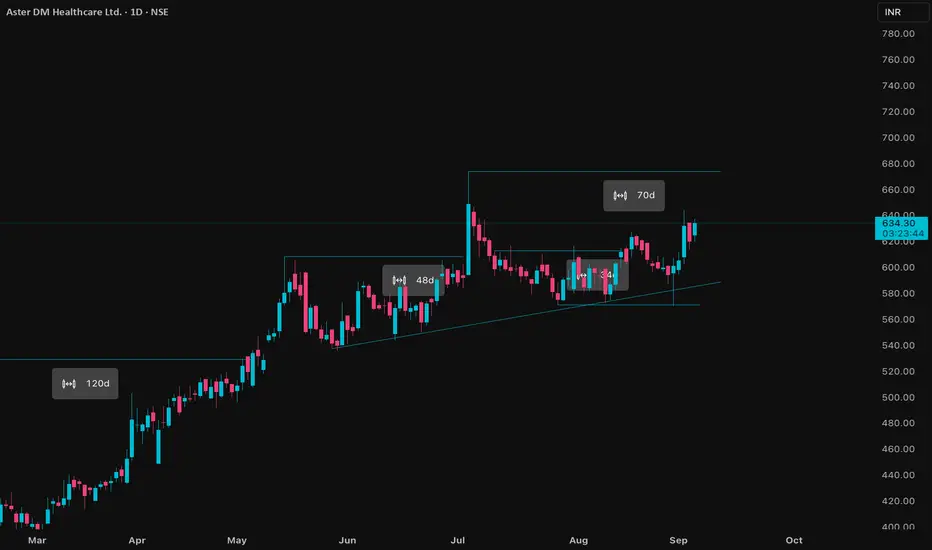
ASTERDM Price ActionAster DM Healthcare is trading around ₹632–₹634 as of September 4, 2025, and has shown solid resilience and upward movement over recent sessions. The company’s market capitalization stands at about ₹32,122 crore, and its current price-to-book ratio is roughly 9.4, reflecting growth expectations and
Aster DM Healthcare LtdDate 24.08.2025
Aster DM
Timeframe : Day Chart
Business Segments
(1) Hospitals and Clinics 94%
(2) Labs and Pharmacies 6%
Market Position
(1) 2nd-largest hospital network in South India
(2) Largest bed capacity in Kerala, 2nd in Andhra Pradesh and 3rd in Karnataka
Key Metrics
(1) Total Bed C

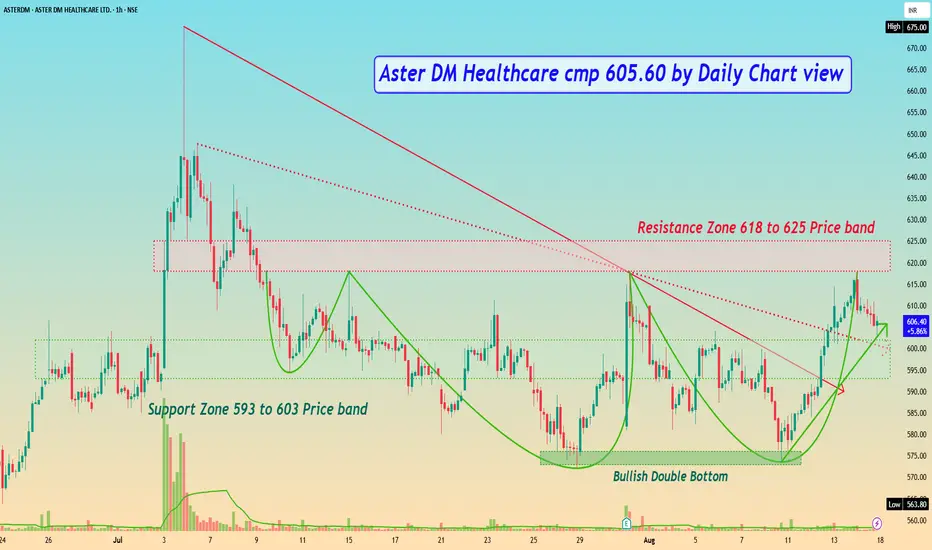
Aster DM Healthcare cmp 605.60 by Daily Chart viewAster DM Healthcare cmp 605.60 by Daily Chart view
- Support Zone 593 to 603 Price band
- Resistance Zone 618 to 625 Price band
- Stock price to test retest Support Zone for fresh upside
- Falling Resistance Trendlines Breakout is done and sustained
- Bullish Double Bottom formed around the 573 to
Abondoned baby candlestick in upward trendThe price has taken some breather and may resume it's upward run
Decent entry with strict target and stoploss offers you a good Risk Reward ratio

See all ideas
Summarizing what the indicators are suggesting.
Neutral
SellBuy
Strong sellStrong buy
Strong sellSellNeutralBuyStrong buy
Neutral
SellBuy
Strong sellStrong buy
Strong sellSellNeutralBuyStrong buy
Neutral
SellBuy
Strong sellStrong buy
Strong sellSellNeutralBuyStrong buy
An aggregate view of professional's ratings.
Neutral
SellBuy
Strong sellStrong buy
Strong sellSellNeutralBuyStrong buy
Neutral
SellBuy
Strong sellStrong buy
Strong sellSellNeutralBuyStrong buy
Neutral
SellBuy
Strong sellStrong buy
Strong sellSellNeutralBuyStrong buy
Displays a symbol's price movements over previous years to identify recurring trends.
Frequently Asked Questions
The current price of ASTERDM is 552.15 INR — it has increased by 2.19% in the past 24 hours. Watch Aster DM Healthcare Ltd. stock price performance more closely on the chart.
Depending on the exchange, the stock ticker may vary. For instance, on NSE exchange Aster DM Healthcare Ltd. stocks are traded under the ticker ASTERDM.
ASTERDM stock has fallen by −4.34% compared to the previous week, the month change is a −10.13% fall, over the last year Aster DM Healthcare Ltd. has showed a 15.24% increase.
We've gathered analysts' opinions on Aster DM Healthcare Ltd. future price: according to them, ASTERDM price has a max estimate of 900.00 INR and a min estimate of 700.00 INR. Watch ASTERDM chart and read a more detailed Aster DM Healthcare Ltd. stock forecast: see what analysts think of Aster DM Healthcare Ltd. and suggest that you do with its stocks.
ASTERDM reached its all-time high on Oct 23, 2025 with the price of 732.20 INR, and its all-time low was 78.00 INR and was reached on Mar 24, 2020. View more price dynamics on ASTERDM chart.
See other stocks reaching their highest and lowest prices.
See other stocks reaching their highest and lowest prices.
ASTERDM stock is 7.34% volatile and has beta coefficient of 1.11. Track Aster DM Healthcare Ltd. stock price on the chart and check out the list of the most volatile stocks — is Aster DM Healthcare Ltd. there?
Today Aster DM Healthcare Ltd. has the market capitalization of 279.34 B, it has decreased by −2.43% over the last week.
Yes, you can track Aster DM Healthcare Ltd. financials in yearly and quarterly reports right on TradingView.
Aster DM Healthcare Ltd. is going to release the next earnings report on Jan 30, 2026. Keep track of upcoming events with our Earnings Calendar.
ASTERDM earnings for the last quarter are 2.10 INR per share, whereas the estimation was 2.20 INR resulting in a −4.55% surprise. The estimated earnings for the next quarter are 2.00 INR per share. See more details about Aster DM Healthcare Ltd. earnings.
Aster DM Healthcare Ltd. revenue for the last quarter amounts to 11.97 B INR, despite the estimated figure of 11.61 B INR. In the next quarter, revenue is expected to reach 11.77 B INR.
ASTERDM net income for the last quarter is 1.10 B INR, while the quarter before that showed 855.20 M INR of net income which accounts for 28.62% change. Track more Aster DM Healthcare Ltd. financial stats to get the full picture.
Aster DM Healthcare Ltd. dividend yield was 1.03% in 2024, and payout ratio reached 4.63%. The year before the numbers were 0.49% and 76.96% correspondingly. See high-dividend stocks and find more opportunities for your portfolio.
As of Jan 30, 2026, the company has 20.46 K employees. See our rating of the largest employees — is Aster DM Healthcare Ltd. on this list?
EBITDA measures a company's operating performance, its growth signifies an improvement in the efficiency of a company. Aster DM Healthcare Ltd. EBITDA is 8.38 B INR, and current EBITDA margin is 18.86%. See more stats in Aster DM Healthcare Ltd. financial statements.
Like other stocks, ASTERDM shares are traded on stock exchanges, e.g. Nasdaq, Nyse, Euronext, and the easiest way to buy them is through an online stock broker. To do this, you need to open an account and follow a broker's procedures, then start trading. You can trade Aster DM Healthcare Ltd. stock right from TradingView charts — choose your broker and connect to your account.
Investing in stocks requires a comprehensive research: you should carefully study all the available data, e.g. company's financials, related news, and its technical analysis. So Aster DM Healthcare Ltd. technincal analysis shows the sell today, and its 1 week rating is sell. Since market conditions are prone to changes, it's worth looking a bit further into the future — according to the 1 month rating Aster DM Healthcare Ltd. stock shows the buy signal. See more of Aster DM Healthcare Ltd. technicals for a more comprehensive analysis.
If you're still not sure, try looking for inspiration in our curated watchlists.
If you're still not sure, try looking for inspiration in our curated watchlists.