Weekly chart of Aster DM Healthcare Ltd (NSE)Fibonacci Insight (Approx.)
38.2% retracement ≈ ₹560
50% retracement ≈ ₹520
Price bounced between 38.2%–50%, which is ideal for trend continuation in strong stocks.
📌 Disclaimer : Educational purpose only. Not a SEBI registered analyst. Not a buy/sell recommendation.
Aster DM Healthcare Ltd.
No trades
What traders are saying

Will Aster DM Reverse from the Demand Zone ? cmp 563.70Stock Update – *Aster DM Healthcare cmp 563.70*
The stock has corrected around 26% from its all time high and is now taking support on a major weekly demand zone.
Turned technically bullish & Price action near support shows stability which indicating a potential trend reversal from lower levels.
Support : 529 - 542
Safe bet for current market scenario in Healthcare space
*8% to 17% Upside Potential*

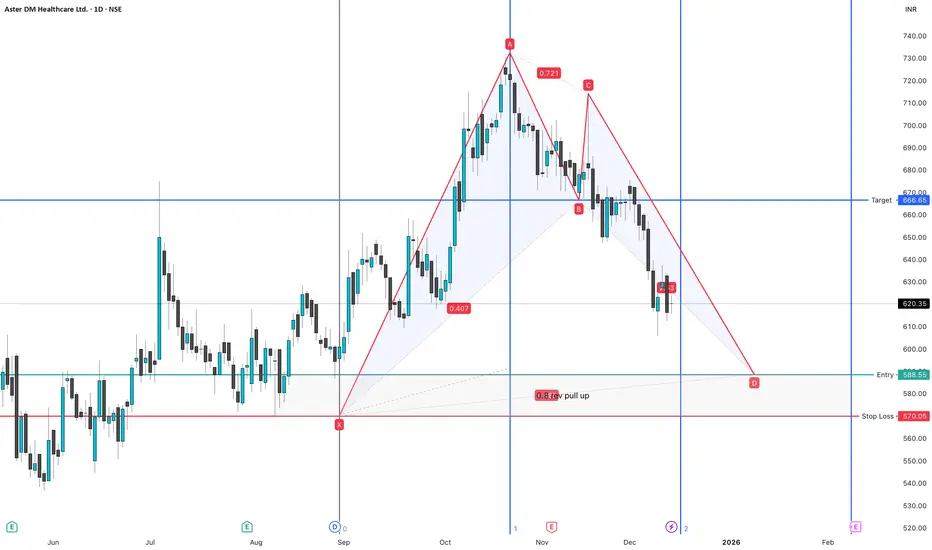
ASTERDM Bull 0.8 rev - BAT pattern , 1 day frameASTERDM Bull 0.8 rev - BAT pattern , 1 day frame
order block on bottom , rsi below 30 mostly goes up set stop loss and arget
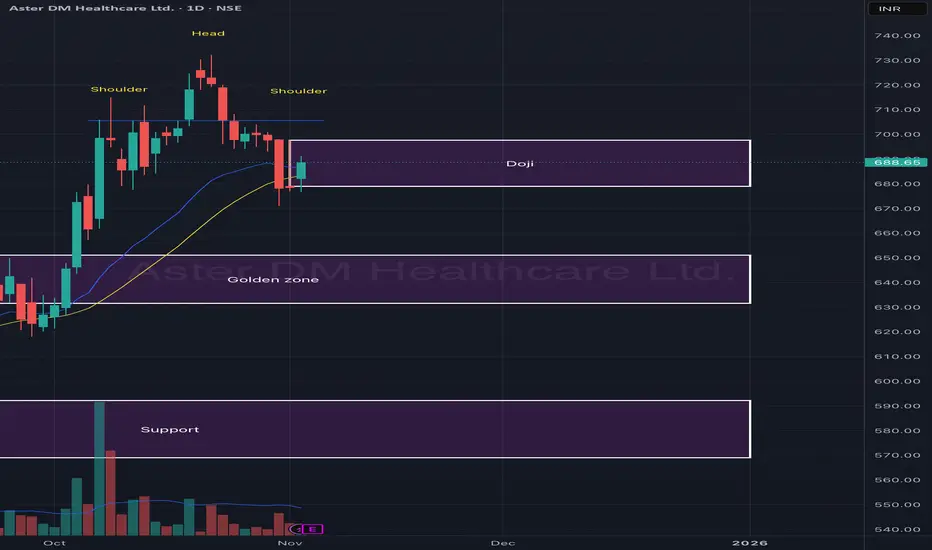
Aster DM Healthcare Ltd – Head & Shoulders Pattern with Doji at Aster DM Healthcare is currently forming a Head & Shoulders pattern, indicating potential short-term distribution after a strong uptrend. The right shoulder has developed with a Doji candle near support — suggesting indecision and possible reversal or continuation depending on the next few sessions.
The stock is hovering around its golden zone (₹640–₹660) — a critical area to watch for either a bounce or a breakdown. Sustaining above this zone can lead to recovery, while failure to hold it could push prices back to the lower support zone.
🎯 Key Levels:
CMP: ₹688.65 (+1.50%)
Pattern: Head & Shoulders
Doji Zone: ₹685 – ₹700
Golden Zone: ₹640 – ₹660 (key retracement area)
Major Support: ₹580 – ₹600
📊 Technical View:
Head & Shoulders structure forming after a sharp rally.
Doji candle shows hesitation near the neckline zone — watch next candle for confirmation.
20 EMA acting as dynamic support; breakdown below it can accelerate selling.
Volume contraction indicates reduced momentum — possible retest ahead.
🧠 View:
Aster DM is at a key decision point. A daily close above ₹700 could invalidate the bearish setup and trigger recovery, while a breakdown below ₹660 may lead to a slide toward ₹600. The Doji formation adds to the significance of the next move.
Aster DM looking good for upsideAster DM looking good for upside targets are favourable for rr greater than 1 : 3
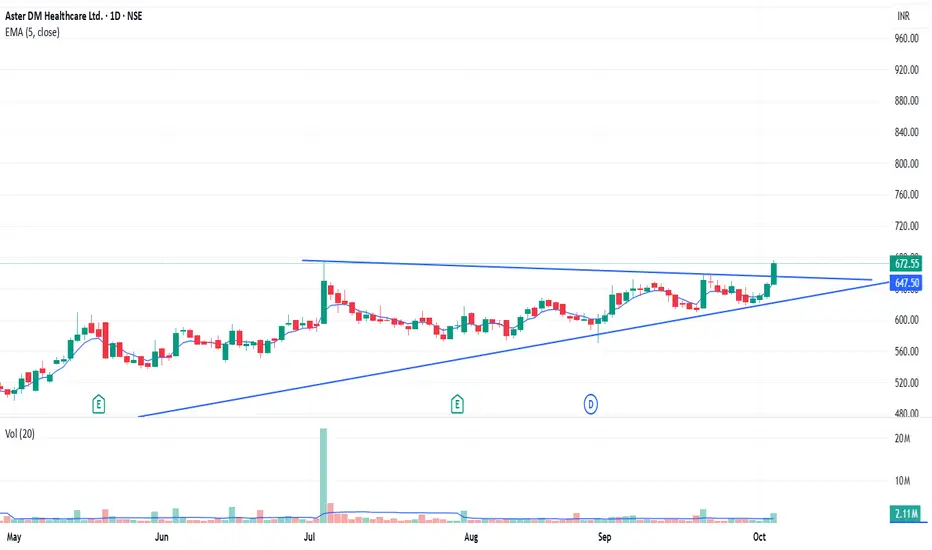
ASTER DM (Aster DM Healthcare)ASTER DM looks strong.
It faced resistance near 604–610, broke out on 3rd July, and then re-tested that level.
The stock is trading above all key EMAs (20, 50, 100, 200) and has been in a long-term uptrend for nearly 5 months.
With recent strong results, there’s a probability of an upside move. Keep it on your watchlist.
✅ If you like my analysis, please follow me as a token of appreciation :)
in.tradingview.com/u/SatpalS/
📌 For learning and educational purposes only, not a recommendation. Please consult your financial advisor before investing.

ASTERDM – Strong Breakout, Eyes on ₹670+Aster DM Healthcare is showing strong momentum with today’s ~6% surge. Price has broken above EMA 50 and is sustaining well.
🔹 Immediate support: ₹621
🔹 Next resistance: ₹670–680 zone
🔹 RSI: 63 → still has room before overbought levels
🔹 Trend: Bullish bias as long as price stays above ₹621
📈 If the stock sustains above ₹650, we may see a move towards ₹670–690 in the near term. On the downside, ₹621 remains a key support.
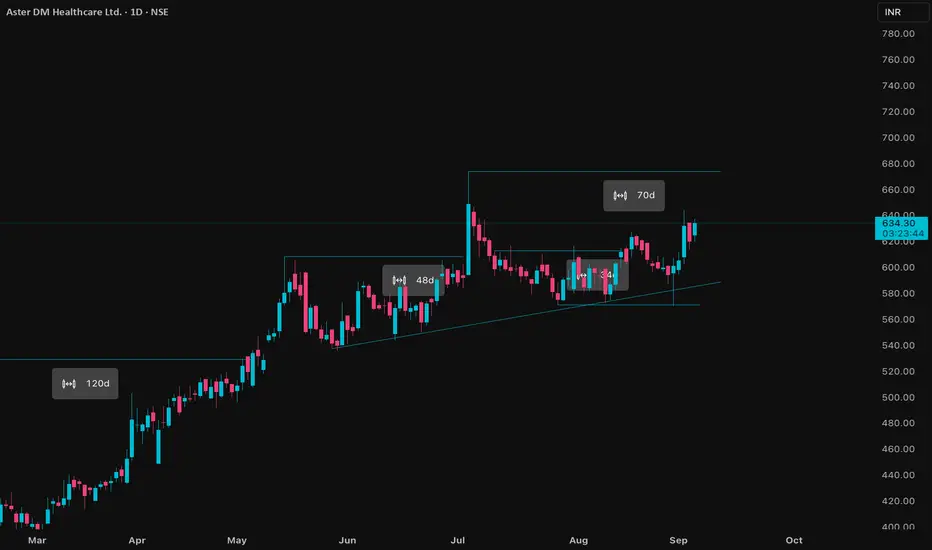
ASTERDM Price ActionAster DM Healthcare is trading around ₹632–₹634 as of September 4, 2025, and has shown solid resilience and upward movement over recent sessions. The company’s market capitalization stands at about ₹32,122 crore, and its current price-to-book ratio is roughly 9.4, reflecting growth expectations and sector strength.
Recent financial results highlight substantial improvement: Q1 FY26 revenue reached ₹1,078 crore, up 8% year-on-year, and consolidated net profit for the quarter is ₹85.52 crore, maintaining momentum following last year’s major gains from the strategic disposal of its Gulf business. The EBITDA margin for FY25 has strengthened, averaging 19.5%, due to increased patient volumes and operational efficiency. For the whole of FY25, revenue grew 12% to ₹4,138 crore, and net profit posted a strong jump to over ₹5,400 crore with strategic gains from the GCC business separation.
Balance sheet analysis shows rising book value and a stable asset base, indicating ongoing capital investment and sector expansion. Total expenses have grown moderately, while EBIT and PAT both reflect favorable YoY growth, with EBIT up 30% for the recent period. Trading volumes are steady, and the price action is currently above key moving averages, supporting a bullish technical outlook.
Aster DM Healthcare’s positive trend is backed by solid quarterly results, sector tailwinds, and strategic realignment of its international operations. Investors remain optimistic for further medium-term gains if the company sustains improved margins and expanding patient demographics.
Aster DM Healthcare LtdDate 24.08.2025
Aster DM
Timeframe : Day Chart
Business Segments
(1) Hospitals and Clinics 94%
(2) Labs and Pharmacies 6%
Market Position
(1) 2nd-largest hospital network in South India
(2) Largest bed capacity in Kerala, 2nd in Andhra Pradesh and 3rd in Karnataka
Key Metrics
(1) Total Bed Capacity 4,869
(2) Occupancy Rate 67%
(3) Average Length of Stay 3.2 days
(4) Total patient volumes 3.3 Million
Geographical Revenue Split
(1) Kerala 55%
(2) Karnataka & Maharashtra 34%
(3) Andhra & Telangana 11%
Note* The company has a presence across 5 states and 15 cities
Specialty-wise Revenue Mix
(1) Multi Speciality 17%
(2) Cardiac Sciences 14%
(3) OP Pharmacy & Anaestheolgy 13%
(4) Neuro Sciences 11%
(5) Gastroenterology & Liver Care 10%
(6) Oncology 8%
(7) Orthopedics 8%
(8) Nephrology & Urology 7%
(9) Child & and Adolescent Health 6%
(10) Women's Health 6%
Note*
(1) 59% of Revenue is derived from niche specialties
(2) Cardiac Sciences, Neurology, Oncology, Liver care, Nephrology, and Orthopaedics
Workforce
(1) Has a workforce of 19,500
(2) Doctors 2,649
(3) Nurses 6,235
(4) Others 7,563
(5) Healthcare workers and outsourced staff 3,055
Regards,
Ankur

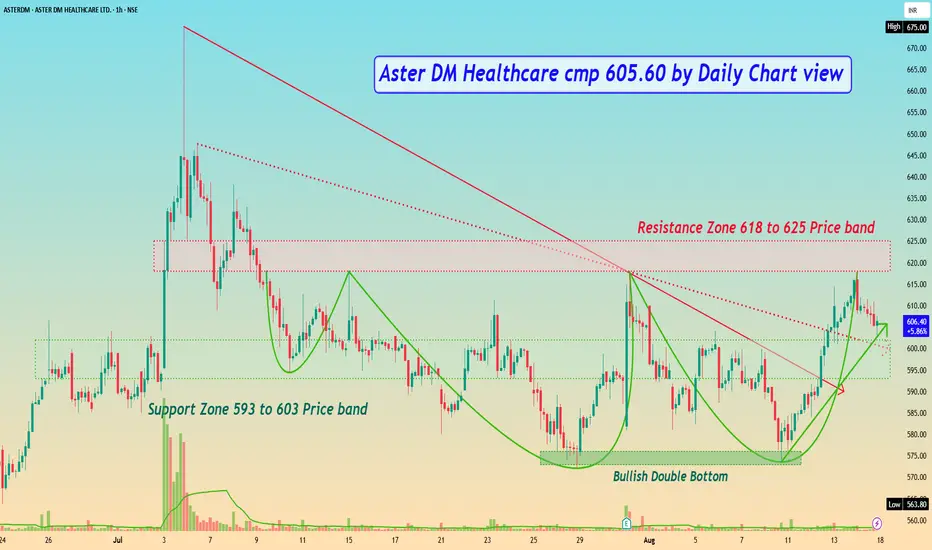
Aster DM Healthcare cmp 605.60 by Daily Chart viewAster DM Healthcare cmp 605.60 by Daily Chart view
- Support Zone 593 to 603 Price band
- Resistance Zone 618 to 625 Price band
- Stock price to test retest Support Zone for fresh upside
- Falling Resistance Trendlines Breakout is done and sustained
- Bullish Double Bottom formed around the 573 to 576 price level
- Bullish Rounding Bottoms formed but failed Breakout at Resistance Zone neckline
- Heavy Volumes needed above avg traded quantity for successful breakout over Resistance Zone
Abondoned baby candlestick in upward trendThe price has taken some breather and may resume it's upward run
Decent entry with strict target and stoploss offers you a good Risk Reward ratio

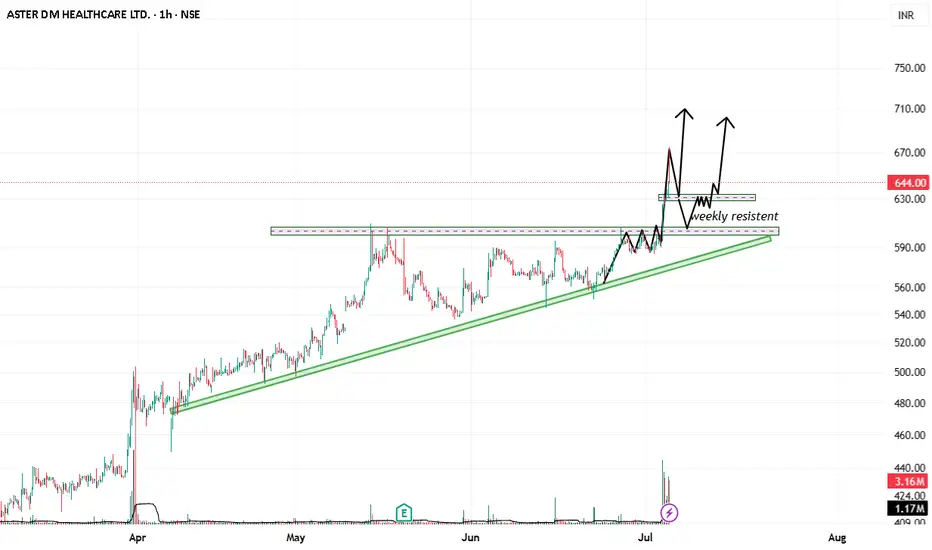
Technical Analysis: Aster DM HealthcareTrend and Structure:
The chart shows a clear ascending trendline (marked in green), supporting higher lows from May through early July.
Price recently broke out strongly above a horizontal resistance zone around 600-620 INR, which acted as a weekly resistance.
Volume spiked during the breakout, confirming buying interest.
Support and Resistance:
The previous resistance zone (~600-620 INR) has now turned into a support zone (labeled as "weekly resistant" on the chart).
The ascending trendline also offers a lower support around 580-590 INR.
Immediate resistance post-breakout is not clearly marked but could be tested in the 680-720 INR zone based on price moves and arrows on the chart.
Price Projections:
The arrows indicate an expected pullback to the breakout zone (~620), followed by a bounce.
This suggests a classic retest of support after a breakout, a common bullish sign.
Volume:
Volume is high during the breakout, supporting the surge.
Watch for volume consistency on the retest to validate support strength.
Trading plan:
Entry:
Consider entering a long position on a confirmed pullback/retest of the breakout zone around 620-630 INR.
Confirmation could be a bullish candlestick pattern or bounce off support.
Stop Loss:
Place a stop loss just below the weekly resistance turned support zone or below the ascending trendline, around 590-600 INR, to manage risk.
Targets:
First target can be near recent highs at ~680 INR.
Second target may be near the next resistance zone around 720 INR.
Risk-Reward:
Risk: Approx. 20-30 INR per share (stop loss zone)
Reward: Potential gain of 50-80 INR per share
Risk-reward ratio of approximately 2:1 or better.
Additional Notes:
If the price fails to hold above 620 INR and dips below the ascending trendline, reconsider the trade and wait for a clearer setup.
Monitor volume during the retest; strong volume on the bounce confirms the move.
The trade aligns with the prevailing uptrend and breakout confirmation principles.
BUY TODAY SELL TOMORROW for 5%DON’T HAVE TIME TO MANAGE YOUR TRADES?
- Take BTST trades at 3:25 pm every day
- Try to exit by taking 4-7% profit of each trade
- SL can also be maintained as closing below the low of the breakout candle
Now, why do I prefer BTST over swing trades? The primary reason is that I have observed that 90% of the stocks give most of the movement in just 1-2 days and the rest of the time they either consolidate or fall
Cup and Handle Breakout in ASTERDM
BUY TODAY SELL TOMORROW for 5%

ASTER DM HEALTHCARE LTD. (NSE)_Flag Breakout The stock broke out above the ₹610 resistance with a strong bullish candle and significant price momentum, indicating a breakout.
📌 Key Technical Levels
Immediate Resistance Zone: ₹675–₹700
Immediate Support Zone: ₹610 (former resistance, now support)
Secondary Support: Around ₹570 (lower triangle boundary)
📈 Trend Outlook
Short-Term: Strong bullish momentum confirmed by the breakout.
Medium-Term: Bullish trend resumption likely after a phase of consolidation.
⚠️ Disclaimer
This analysis is for educational and informational purposes only. It does not constitute investment advice or a recommendation to buy or sell any securities. Always consult a qualified financial advisor before making any investment decisions. Markets are subject to risks, and past performance is not indicative of future results.
Cup and Handle Pattern - AsterdmASTERDM
Aster DM Healthcare Limited is one of the largest integrated private healthcare service providers operating in GCC (Gulf Cooperation Council) countries and an emerging player in India. With an inherent emphasis on clinical excellence, it is one of the few entities in the world with a strong presence across primary, secondary, tertiary and quaternary healthcare.
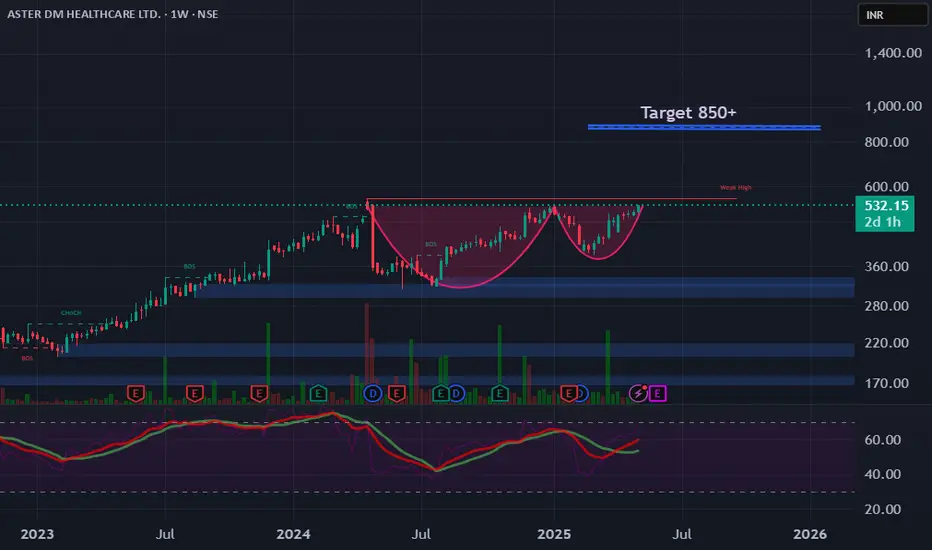
Aster DM Healthcare (ASTERDM) Stock Analysis:
As of May 7, 2025, at approximately 2:51 PM , Aster DM Healthcare Ltd. (ASTERDM) is trading around ₹532.15 on the National Stock Exchange (NSE) and Bombay Stock Exchange (BSE).
52-Week High/Low: The 52-week high for ASTERDM is around ₹534.80, and the 52-week low is around ₹311.10. The current price is near its 52-week high.
Merger News : There was news in the past about a potential merger with Quality Care India Limited (QCIL), which could impact the company's future performance and market position.
General Information about Cup and Handle Patterns:
Bullish Signal : The cup and handle is generally considered a bullish continuation pattern.
Formation: The "cup" is a U-shaped price consolidation, and the "handle" is a short, downward-drifting consolidation after the cup's formation.
Breakout : The pattern is confirmed when the price breaks above the resistance level formed by the top of the handle, usually accompanied by increased trading volume.
Target Calculation : The price target is often estimated by adding the depth of the cup to the breakout price. For example, if the cup's depth was ₹30 and the breakout occurred at ₹150, the target would be ₹180.
Timeframe: 6 to 1 year
momentum stocks looking good
momentum stocks looking good
These are positional stocks (5-7) day's movement
ASTERDM: Cmp-503
Momentum series releasing
◇ one like
Disclaimer: -This is just for educational purposes
#ASTERDM

BUY TODAY SELL TOMORROW for 5%DON’T HAVE TIME TO MANAGE YOUR TRADES?
- Take BTST trades at 3:25 pm every day
- Try to exit by taking 4-7% profit of each trade
- SL can also be maintained as closing below the low of the breakout candle
Now, why do I prefer BTST over swing trades? The primary reason is that I have observed that 90% of the stocks give most of the movement in just 1-2 days and the rest of the time they either consolidate or fall
Trendline Breakout in ASTERDM
BUY TODAY SELL TOMORROW for 5%

Aster DM Healthcare Ltd - Symmetrical Triangle Pattern AnalysisAster DM Healthcare Ltd - Symmetrical Triangle Pattern Analysis 🛠️
The stock is consolidating within a symmetrical triangle, signaling a potential breakout. With price compression nearing its apex, a decisive move is expected soon.
Technical Insights
📈 Resistance:
Upper trendline: ₹433.50 - ₹434.50. A breakout above this range could indicate bullish momentum, targeting the ₹445-₹460 zone.
📉 Support:
Lower trendline: ₹428.00 - ₹429.00. A breakdown below this range might trigger bearish momentum toward ₹413-₹400.
Key Observations:
Current Price: ₹429.00.
Volume Profile: Watch for a significant volume surge during the breakout/breakdown.
Price is nearing the triangle's convergence point, with diminishing volatility signaling an imminent impulse move.
Strategic Approach:
1️⃣ Bullish Case:
Entry: Above ₹434.50 on a sustained breakout with volume.
Targets: ₹445, ₹460 (key levels).
Stop-Loss: Below ₹428.00 to protect against reversals.
2️⃣ Bearish Case:
Entry: Below ₹428.00 on a confirmed breakdown.
Targets: ₹413, then ₹400 if momentum continues.
Stop-Loss: Above ₹434.50 to manage risks.
Risk Management:
Avoid premature entries; wait for confirmation beyond support/resistance levels.
Symmetrical triangles can lead to fakeouts, so confirm moves with strong price action and volume.
⚡ Conclusion: Aster DM Healthcare is poised for a major move. Keep an eye on price levels and volume to act on the next big opportunity!

ASTERDM : Long position Monthly Trend - Up
Weekly Trend - Up
Daily trend - Up
Closing Price above SMA 200 - Yes
MACD Signal - Buying Cross over
Buying Zone - Yes
RSI - 64
Volume - Consolidated
Price near 20 EMA - Yes
Targets , Entry Point and Stop Loss as marked in the Chart.

Ater DM healthcare after giving dividents stock crash near about 25% then some day it is in consolidation now it start revese moment

VIEW ON ASTERDMBreakout on the weekly chart
Good volume buildup seen
Target 400/450
Stop loss 350
I am just representing my views
For educational purpose only.

Amazing swing trading idea for 2 August I daily make educational content video for swing / positional trading

Aster DM healthcareLong term stock could be added around 330 with Sl of 320 for long term
As healthcare sector is slow compounder but constant one
Also valuation of the stock is considerable
