ASTER DM trading in a channelStock is trading in a channel and currently is at bottom side of the channel. Can go long with sl at 200.
Trade ideas

#ASTERDM#ASTERDM
CMP:241 @22 Dec 2022
Disclaimer: This is not an investment recommendation, advice, research report, or stock tip of any nature.I am doing this only to understand how to read chart and technicals. Strictly for educational purposes only.


ASTERDM#Watchlist
#ASTERDM:-CMP 265 Looks Good Above 270 for Target 290/320++, 238 below closed (View Invalid) :)
#Disclaimer:-View shared is for educational purposes only.

AsterDM HealthcareNSE:ASTERDM chart is showing a bullish breakout pattern consistently.
Starting around 243 level, it's actually an Elliot Wave 1-2-3-5-6, every time nice flag and pool pattern is creating.
The EW motive pulse is the pool and the EW corrective pulse is the flag consolidation.
And it's now in Wave-5, the most prosperous wave of EW.
Go LONG with a SL of 243.

Ascending triangleASTERDM Cmp 265 ascending triangle formed can add deep till 248 with support 230 target 285-320-350++

2 Amazing Swing trades and Index analysis for 3 Nov Markets I daily make educational content videos on financial markets

AMSTERDM weekly breakoutNSE:ASTERDM is having a strong weekly breakout and seems good for long-term investment.

ASTER DM HEALTHCARE LTD - Ascending Triangle Breakout📊 Script: ASTERDM (ASTER DM HEALTHCARE LIMITED)
📊 Nifty50 Stock: NO
📊 Sectoral Index: NIFTY 500 / NIFTY SMALLCAP / NIFTY PHARMA
📊 Sector: Healthcare
📊 Industry: Healthcare Services - Hospital
Key highlights: 💡⚡
📈 Script is trading at upper band of Bollinger Bands (BB) and giving breakout of it.
📈 MACD is giving crossover.
📈 Double Moving Averages also giving crossover.
📈 Volume is increasing along with price which is volume breakout.
📈 Script is giving breakout of Ascending Triangle.
📈 Current RSI is around 65.
📈 One can go for Swing Trade.
⏱️ C.M.P 📑💰- 265.55
🟢 Target 🎯🏆 - 304
⚠️ Stoploss ☠️🚫 - 247
⚠️ Important: Always maintain your Risk & Reward Ratio.
⚠️ Purely technical based pick.
✅Like and follow to never miss a new idea!✅
Disclaimer: I am not SEBI Registered Advisor. My posts are purely for training and educational purposes.
Eat🍜 Sleep😴 TradingView📈 Repeat🔁
Happy learning with trading. Cheers!🥂

ASTERDM - Ichimoku Bullish Breakout Stock Name - Aster DM Healthcare Ltd
Ichimoku Cloud Setup :
1). Today's close is above the Conversion Line
2). Future Kumo is Turning Bullish
3). Chikou span is slanting upwards
All these parameters are showing bullishness at Current Market Price
and more bullishness AFTER crossing 270
#This is not Buy and Sell recommendation to any one. This is for education purpose and a helping hand to learn trading in Market.
# Cloud Trading
# Ichimoku Cloud
# Ichimoku Followers
I hope you all like my analysis.
Please do share your thoughts into comment section.
Please give a like, it motivates me to do analysis.

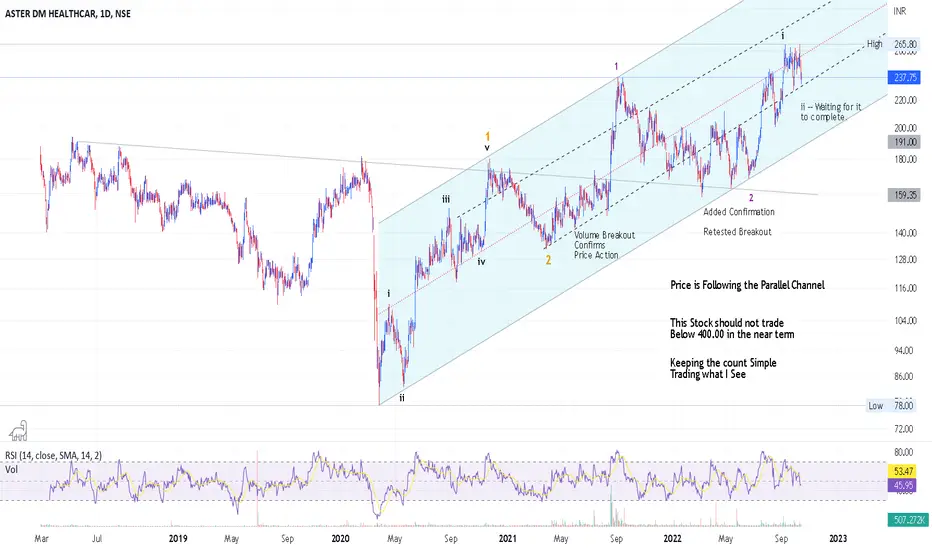
Keeping the Elliott Wave Count simple IT is difficult to not get Carried away,
while using Elliott Wave and force counting / Marking on charts
Simplicity is the key here.
Could fill up this Description Box with Details of my marking ,I'm avoiding the same;
1.The Counts will match Fibo levels (Inner waves)
2. The Countinuity of Higer Degree Wave is where we get to Take positions on.
3. Awaiting confirmation of Samller Wave ii.
4.Assumption :- If things fall in place we are in for a very positive Performance here.
Will really be surprising to not see Big Candles / Gap ups from here on.
ASTER DM - High conviction callASTER DM - ASTER DM Healthcare's subsidiary acquires additional 2% stake in MEDICARE HOSPITAL.
SECTOR - HEALTHCARE
CATEGORY - SMALLCAP
VOLATILITY - MODERATE RISK
52ND WEEK HIGH = 263.15
52ND WEEK LOW = 158.10
PE RATIO = 23.81
SECTOR PE RATIO = 34.89
High conviction call - Based on Technical(Try to buy small quantity between the buying price and stop loss price) .
EMA 9 = 247.16
EMA 20 = 239.76
EMA 50 = 225.53
EMA 100 = 212.15
EMA 200 = 199.74
Kindly consult your financial advisor before investing.

Aster DM Healthcare Ltd Good for swing Aster DM Healthcare Ltd good for swing tading
# Cup and handle pattern breakout
Buy = 243.80
1st Target =253.35
2nd Target =263.70
stop loss =230.70

Aster DM Healthcare-Breakout Rectangle Channel.Aster DM Healthcare-Breakout Rectangle Channel Pattern Daily Time Frame. Entry Zone-240/260.Expect a Target on this Stock-320/330.Stop Loss-216 Closing Basis. Only Education Purpose

ASTERDMcup and handle
break-out
trgs r opens
If You LIKE MY Idea ……Boost………….. its
“Disclosure : I am not Sebi-registered.” This channel is for only educational purpose. Any profit/loss, I am not responsible. Before taking any trade on our calls, please consult your financial advisors. Thanks

Watch for a massive move !!!Aster DM is standing at the door of breakout passing which, could
witness a massive move.
Inverse head & shoulder pattern which was under construction from
9 months is ready for a breakout.
Indications which are suggesting breakout is volume buzzing and RSI breaching
above 60.
After, breakout levels up to 236 is possible but till then, keep a keen watch on it.

ASTERDM - Morning Star - Sequence of Events 14-07-2022 : Volume is Monthly High. Stock is already above 20 SMA on Daily, Weekly, and Monthly time frames
15-07-2022 : Volume is again Monthly High. RSI crossed above 60 on Daily / Weekly / Monthly time frames ( 6 days Back)
18-07-2022 : SMA 50 crossed /SMA 100 on the higher side. Currently formation in on Normal NR7
19-07-2022 : Normal NR7 - Breakout
26-07-2022 : ~10% movement (Low 218.45 to High 237.45). Crossing 4-week High / Cross WK Piv Upside
Also candlestick formation: Morning Star
Expecting a possible strong move on the upside.
This is my own understanding -- please do your own study before taking a call.

ASTER DM This guy broken the 3 years resistance (for better visual look in 1W), it gave 30%.
Now it is consolidates from 10 months and gave good break out.
Looks good technically.
Similar kind of setup found in voltamp 40 days back
It gave 50% .

ASTERDM - Weekly Analysis - Swing tradeThe analysis is done on weekly TF hence price may take few weeks to few months in order to reach the targets.
Trade setup is explained in image itself.
The above analysis is purely for educational purpose. Traders must do their own study & follow risk management before entering into any trade
Checkout my other ideas to understand how one can earn from stock markets with simple trade setups. Feel Free to comment below this or connect with me for any query or suggestion regarding this stock or Price Action Analysis.


#StockMarket #StockIdeas #StocktoWatch #StockToBuy #positionalASTER DM HEALTHCARE
Very good fundamental Stock
Buy for Investment for long term also
On weekly chart already gave H&S breakout and then retracement done
On daily chart gave good trendline breakout
Buy above 195/200 levels for Swing targets of 210/230
Also looks good for long term holding, but stock will be slow moving.
----
Note:
Above levels are for education purposes only
Do your own analysis before taking any trade
Please Like & Follow

descending parallel channel - retest in parallel channelstock following through descending triangle pattern
now after breakout again following through smaller parallel channel
breaking high will shootup to all time high

Aster DM Plan your trade Channel breakout ..Upside move Possible (Channel Breakout ) only Education Purpose ..
