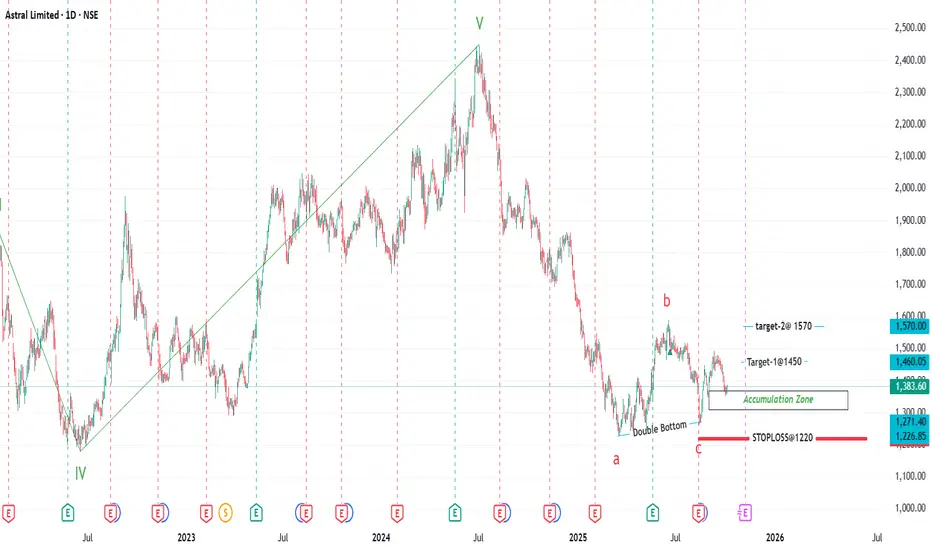
Astral Ltd— Monthly & Weekly technical readOn both the monthly and weekly charts as of early October 2025, Astral Limited is in a consolidation to bearish phase:
• Moving Averages: All major moving averages (5, 10, 20, 50, 100, 200 days) are signalling sell, indicating the stock is trading below key confidence levels.
• Elliott Wave Reading:
Astral is engaged in a corrective phase following a multi-year uptrend and the sharp peak → sell-off
The run to the July-2024 high looks like a completed 5-wave impulse up from the multi-year base. The subsequent move since the peak is best read as an A–B–C correction
We are likely inside or completing wave C on weekly/monthly — that explains continued weakness until key support (≈₹1,230) is decisively tested. (If wave C completes and price holds monthly support, a new impulse up may follow.)
• Short forecast / probabilities (my view):
• Short Term (2–8 weeks): Oscillators in oversold territory suggest the stock could consolidate or attempt a short-lived bounce.
• Q4 2025 and Beyond: Forecasts for the end of 2025 position Astral between 1,600 and 1,665, assuming successful defense of support and a return to broader market strength.
• Trading Strategy:
Accumulation Zone: ₹ 1310-1370
Stop Loss: ₹1,220
Targets:
T1: ₹1,450
T2: ₹1,577
T3: ₹1600-1665 (long term)
Conclusion : Astral Ltd. is technically oversold but sentiment remains cautious; watch the 1,360 supports for signs of reversal. Downside is limited if this support holds, with upside potential back to 1,650–1,665 by year-end should a new impulse wave begin
📌 Thanks a ton for checking out my idea! Hope it sparked some value for you.
🙏 Follow for more insights
👍 Boost if you found it helpful
✍️ Drop a comment with your thoughts below!
ASTRAL trade ideas
Astral ltd Cmp 1462 H&S PatternAstral ltd Cmp 1462 dated 8-9-2025
1. H&S pattern BO above 1475
Buy above 1475 SL 1400 target 1490-1500-1510-
1525-1540-1550-1575-1590-1600-1610-1625-1650
1680
It is just a view, please trade at your own risk.

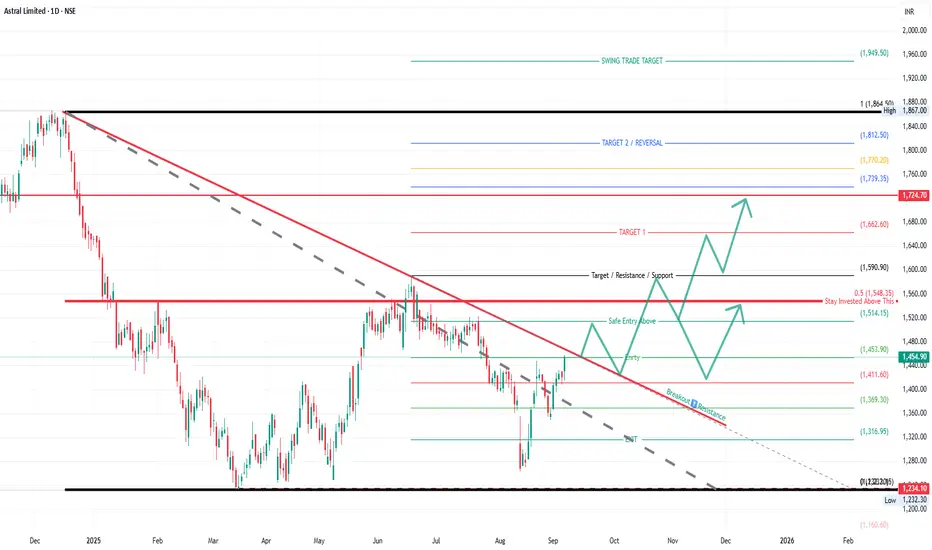
Astral Ltd – Trendline Breakout & Upside TargetsAstral Ltd has broken out of a long-term falling trendline, indicating a potential shift from bearish to bullish momentum. Price is trading above the safe entry level of ₹1,453 and holding strong. Sustaining above ₹1,514 may confirm further upside targets.
📌 Key Technical Highlights:
Pattern: Downtrend Breakout
Safe Entry: Above ₹1,453
Stay Invested Above: ₹1,514
Resistance turned Support: ₹1,590
Volume strength will be key for confirmation
🎯 Upside Target Levels:
Target 1: ₹1,662
Target 2: ₹1,724
Target 3 (Reversal Zone): ₹1,770 – ₹1,812
Swing Target: ₹1,949
⚠️ Downside Risk Levels (if breakout fails):
₹1,411
₹1,369
₹1,316
₹1,234
📈 Strategy Outlook:
A positional buying opportunity emerges above the breakout zone. Traders may consider entering above ₹1,453 with a stop-loss below ₹1,411. Holding above ₹1,514 adds confidence for higher upside targets.
Disclaimer:
This analysis is for educational purposes only and not financial advice. Do your own research before trading or investing.
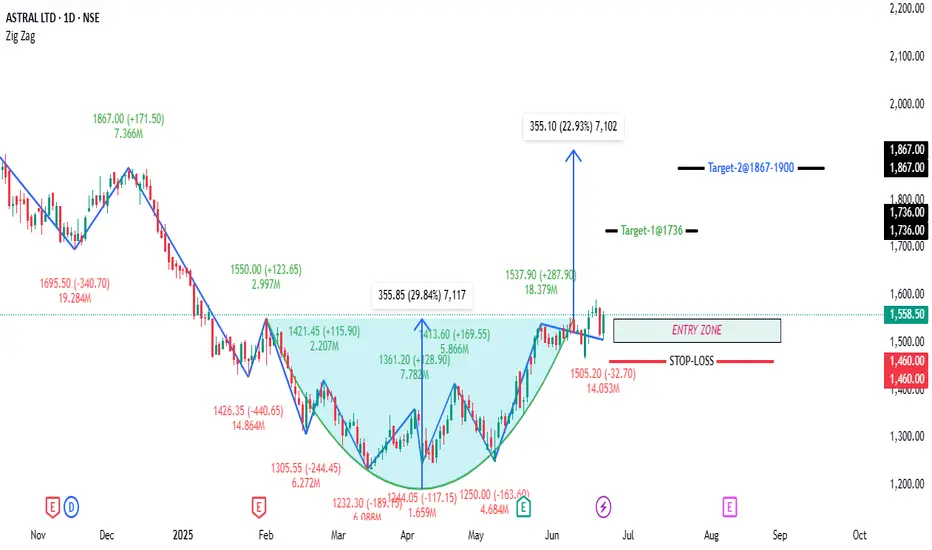
ASTRAL LTD-Rounding Bottom BreakoutASTRAL LTD; CMP: 1558.50
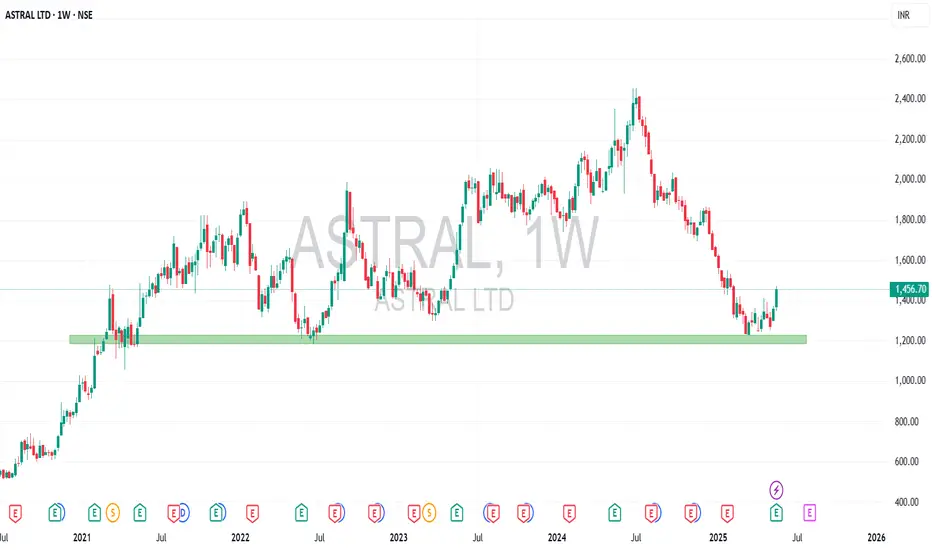
The stock formed a clean rounding bottom from the lows near ₹1230 (Mar 2025) to the breakout above ₹1537.
Breakout occurred with increased volume (18.3M), validating the move.
RSI is at 61.33, indicating momentum is positive but not overbought — favorable for further upside.
The stock has sustained above the breakout zone (~₹1537), which was the neckline and now acts as support.
📈 Long Trade Recommendation
Buy Zone: Current levels around ₹1550–₹1560 (post-breakout pullback and retest looks complete)
Target: ₹1900 (based on height of base: ~355 points from ₹1537 breakout = 1537 + 355)
Stop Loss: ₹1475 (on closing basis) – below recent pullback low and prior support.
Risk-Reward Ratio: 4:1 → Strong trade setup.
🔐 Key Support and Resistance Levels
🔼 Resistance Zones:
₹1650–₹1695: Intermediate resistance (previous swing high from Dec 2024)
₹1735: 1M Pivot Low — may act as resistance due to confluence
₹1867: 1W Pivot High
₹1900: Target zone and psychological round number
🔽 Support Zones:
₹1537: Breakout level (1D Pivot High) — now key support
₹1505: Retest level (recent swing low post-breakout)
₹1482: 1D Pivot Low
₹1475: Stop-loss level — below this structure breaks
A close below ₹1475 would invalidate the bullish setup.
Watch for volume follow-through above ₹1600 levels to sustain the move.
Trailing stop-loss can be adjusted to ₹1537 once price sustains above ₹1650 for multiple sessions
Astral Bullish View From Here Astral Limited, founded in 1996 and headquartered in Ahmedabad, is a leading Indian building materials company. Initially known as Astral Poly Technik, it pioneered CPVC piping systems in India. The company operates in two main segments: piping solutions (CPVC, PVC, HDPE, and specialized pipes for residential, industrial, and infrastructure use) and adhesives, sealants, paints, bathware, and water tanks. With manufacturing plants across India and international operations in the UK, US, and Kenya, Astral has expanded through acquisitions like Resinova Chemie, Rex Polyextrusion, and Gem Paints. Known for innovation, quality, and sustainability, Astral continues to strengthen its presence in the construction ecosystem.
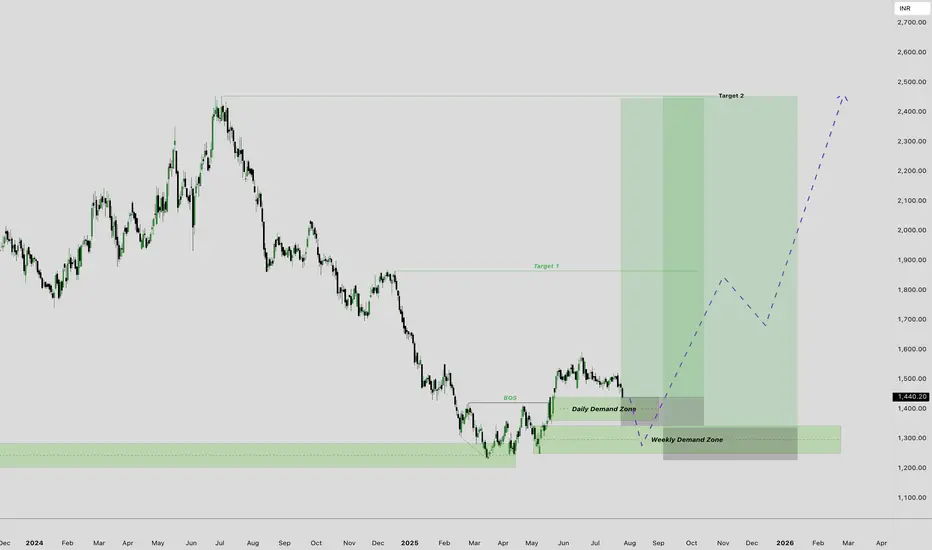
Astral is near demand zone. Potential SwingAfter respecting week Order block, Astral gave a break of structure. Now stock returning to it's demand zones. From these demand zone we can see a good up move with good risk reward.
Key levels:
1. Current Demand zone 1450-13450 we can take first entry here.
2. In case, due to market conditions if market couldn't respect current demand zone, then we have last weekly demand zone 1344-1245, we will look for entries here.
3. Target areas, first target will be 1860 and final target would be ATH
Please do your own analysis at these demand zones before making any financial decision.
ASTRALASTRAL looks good, has been taking support near 1470 level - above 50ema, and today formed a Hammer candle. Now there is probability of it going up.
✅ If you like my analysis, please follow me as a token of appreciation :)
in.tradingview.com/u/SatpalS/
📌 For learning and educational purposes only, not a recommendation. Please consult your financial advisor before investing.
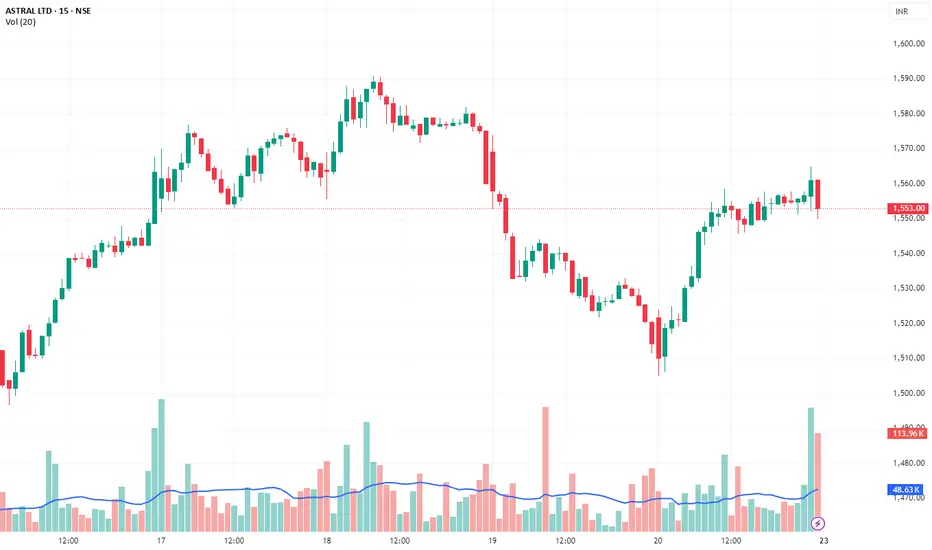
ASTRAL Ltd. – BTST & Short-Term Swing SetupASTRAL Ltd. – BTST & Short-Term Swing Setup
CMP: ₹1,558.50 | Chart: 5-min | Date: June 22, 2025
📌 Observations:
V-shape recovery from ₹1,500 zone with strong momentum
High-volume breakout seen between 11:00 AM – 12:30 PM
Price is now consolidating just below day’s high (₹1,568)
Volume structure indicates bullish interest, not exhaustion
📊 Levels to Watch
Support Zones:
₹1,540 – Breakout base
₹1,515 – Strong positional support
Resistance Zones:
₹1,568 – Intraday high
₹1,590–1,600 – Short-term swing target
🔔 Trade Plan
BTST Idea
🎯 Target: ₹1,570
🛑 SL: ₹1,540
✅ Entry: CMP or slight dip
📈 Bias: Bullish above ₹1,545
3–5 Day Positional Idea
🎯 Target 1: ₹1,575
🎯 Target 2: ₹1,595–1,600
🛑 SL: ₹1,515
📈 Structure: Higher high + volume breakout
📌 Summary
✅ Volume expanding on up candles
✅ Price > breakout zone
✅ No resistance till ₹1,590
🔁 Watch for price action at ₹1,570 — breakout here could trigger next leg.
📉 Invalidation Below: ₹1,540
📅 Review After: 9:45 AM, June 23
💬 "Follow the price–volume footprints. Structure is clean, upside looks intact."
#ASTRAL #BTST #SwingTrade #PriceAction #VolumeBreakout #TradingViewIndia #NSEStocks
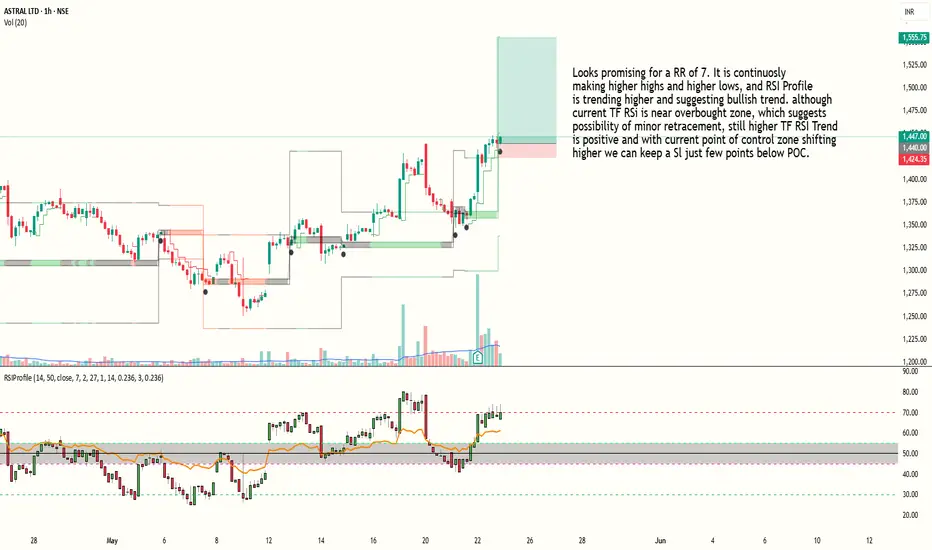
Bullish trade building up in Astral with RR of 7Looks promising for a RR of 7. It is continuosly making higher highs and higher lows, and RSI Profile is trending higher and suggesting bullish trend. although current TF RSI is near overbought zone, which suggests possibility of minor retracement, still higher TF RSI Trend
is positive and with current point of control zone shifting higher we can keep a Sl just few points below POC.
Entry at 1440
SL around 1423
Target around 1555
Risk to reward ratio is around 7.
Indicator used : RSI Hybrid Profile (Link available in my profile)
PS : This is an Educational post and doesn't constitute any trading or financial advice, just do your own research.
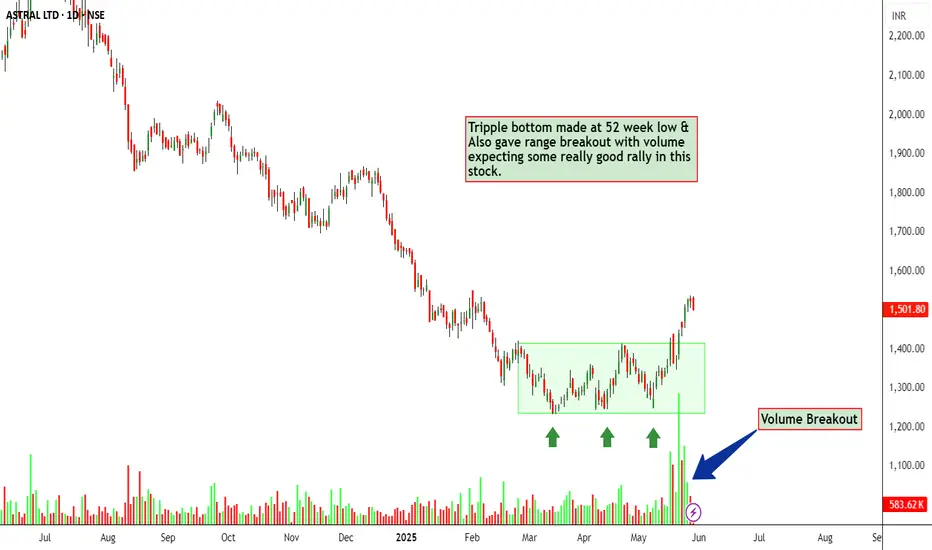
Astral PolyAstral Poly has recently formed a notable technical pattern characterized by a triple bottom formation, which occurred at the level of its 52-week low. This pattern is often interpreted by technical analysts as a potential indication of trend reversal from a downtrend to an uptrend. Following this formation, the stock price has broken out above the resistance level defined by its recent trading range. This breakout was accompanied by an increase in trading volume, which is generally considered a confirmation signal for the strength of the breakout. Increased volume during a breakout suggests higher participation and conviction among traders in the direction of the price movement, thereby potentially supporting a sustained upward rally in the stock.
Disclaimer: This analysis is based on technical observations and should not be considered as financial advice. Investing in the stock market carries inherent risks, and past performance is not indicative of future results. Investors should conduct thorough due diligence and consult with a qualified financial advisor before making any investment decisions.
Astral Limited: Technical & Fundamental Analysis Report📈Technical Analysis: Bullish Reversal in Sight
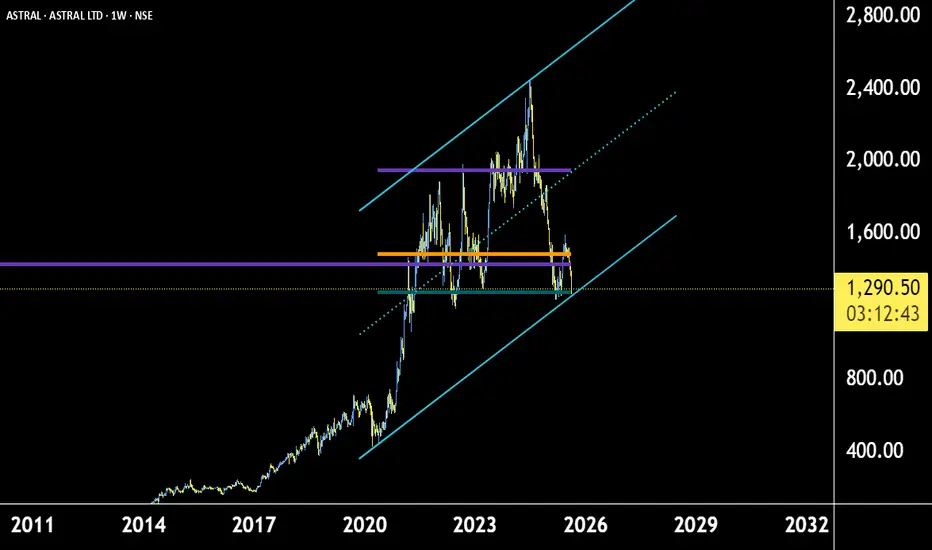
Astral Limited has exhibited a robust uptrend over the past decade, with its stock price ascending from ₹4 – ₹5 to an all-time high of ₹2,454 in July 2024. However, following this peak, the stock underwent a significant correction, declining by approximately 50% to reach the ₹1,200 level.
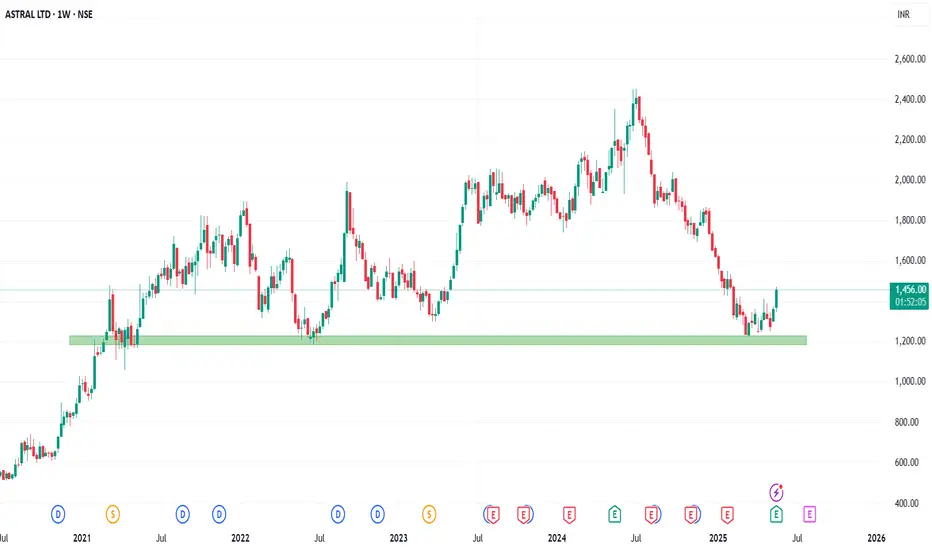
This correction can be attributed to weaker performances in Q1, Q2, and Q3 of FY24. Notably, the ₹1,150–₹1,250 range has historically acted as a strong demand zone, providing support on multiple occasions since 2021. The recent positive Q4 FY24 results, announced on May 21, have catalyzed a rebound, with the stock currently trading around ₹1,450.
Key Technical Levels:
Support Zones: ₹1,150 – ₹1,250
Resistance Levels: ₹1,600 (Target 1), ₹1,800 (Target 2), ₹2,000 (Target 3)
All-Time High: ₹2,454
A sustained move above ₹2,000 could pave the way for a retest of the all-time high. Conversely, a breach below the ₹1,150 support zone may signal further downside.
💰Q4 FY24 Key Financial Highlights:
Total Income: ₹1,681 Cr (vs ₹1,397 Cr in Q3 FY24)
Total Expenses: ₹1,380 Cr (vs ₹1,178 Cr in Q3 FY24)
Total Operating Profits: ₹301 Cr (vs ₹219 Cr in Q3 FY24)
Profit Before Tax: ₹236 Cr (vs ₹154 Cr in Q3 FY24)
Profit After Tax: ₹178 Cr (vs ₹113 Cr in Q3 FY24)
Diluted Normalized EPS: ₹6.67 (vs ₹4.25 in Q3 FY24)
The Q4 results indicate a strong sequential recovery, with notable improvements across all key financial metrics.
🧾Fundamental Insights:
Segmental Growth: The piping business experienced a 24% growth, while the bathware segment achieved sales of ₹24.2 Cr in Q4 FY24. The company anticipates significant growth in the bathware division in FY25, having surpassed 1,000 showrooms or dealers .
Operational Expansion: New plants in Guwahati and Cuttack are fully operational, with additional facilities under construction in Hyderabad and Kanpur, expected to contribute to revenue in the upcoming fiscal year .
Capacity Utilization: The company's capacity utilization improved to 68% last year, with expectations of further enhancement as new products are rolled out from the new plants .
Dividend Declaration: The board has proposed a final dividend of ₹2.25 per equity share for FY24, subject to approval at the upcoming AGM .
✅Conclusion:
Astral Limited's recent technical breakout from the strong demand zone, coupled with robust Q4 FY24 financial performance and strategic operational expansions, positions the company favorably for potential upside. Investors should monitor key resistance levels and support zones to make informed decisions.
Disclaimer: lnkd.in
Astral Limited: Technical & Fundamental Analysis Report📈 Technical Analysis: Bullish Reversal in Sight
Astral Limited has exhibited a robust uptrend over the past decade, with its stock price ascending from ₹4 – ₹5 to an all-time high of ₹2,454 in July 2024. However, following this peak, the stock underwent a significant correction, declining by approximately 50% to reach the ₹1,200 level.
This correction can be attributed to weaker performances in Q1, Q2, and Q3 of FY24. Notably, the ₹1,150–₹1,250 range has historically acted as a strong demand zone, providing support on multiple occasions since 2021. The recent positive Q4 FY24 results, announced on May 21, have catalyzed a rebound, with the stock currently trading around ₹1,450.
Key Technical Levels:
Support Zones: ₹1,150 – ₹1,250
Resistance Levels: ₹1,600 (Target 1), ₹1,800 (Target 2), ₹2,000 (Target 3)
All-Time High: ₹2,454
A sustained move above ₹2,000 could pave the way for a retest of the all-time high. Conversely, a breach below the ₹1,150 support zone may signal further downside.
💰 Q4 FY24 Key Financial Highlights:
Total Income: ₹1,681 Cr (vs ₹1,397 Cr in Q3 FY24)
Total Expenses: ₹1,380 Cr (vs ₹1,178 Cr in Q3 FY24)
Total Operating Profits: ₹301 Cr (vs ₹219 Cr in Q3 FY24)
Profit Before Tax: ₹236 Cr (vs ₹154 Cr in Q3 FY24)
Profit After Tax: ₹178 Cr (vs ₹113 Cr in Q3 FY24)
Diluted Normalized EPS: ₹6.67 (vs ₹4.25 in Q3 FY24)
The Q4 results indicate a strong sequential recovery, with notable improvements across all key financial metrics.
🧾 Fundamental Insights:
Segmental Growth: The piping business experienced a 24% growth, while the bathware segment achieved sales of ₹24.2 Cr in Q4 FY24. The company anticipates significant growth in the bathware division in FY25, having surpassed 1,000 showrooms or dealers .
Operational Expansion: New plants in Guwahati and Cuttack are fully operational, with additional facilities under construction in Hyderabad and Kanpur, expected to contribute to revenue in the upcoming fiscal year .
Capacity Utilization: The company's capacity utilization improved to 68% last year, with expectations of further enhancement as new products are rolled out from the new plants .
Dividend Declaration: The board has proposed a final dividend of ₹2.25 per equity share for FY24, subject to approval at the upcoming AGM .
✅ Conclusion:
Astral Limited's recent technical breakout from the strong demand zone, coupled with robust Q4 FY24 financial performance and strategic operational expansions, positions the company favorably for potential upside. Investors should monitor key resistance levels and support zones to make informed decisions.
⚠️ Disclaimer:
This report is for educational and informational purposes only and does not constitute investment advice. Please consult your financial advisor before making any investment decisions.
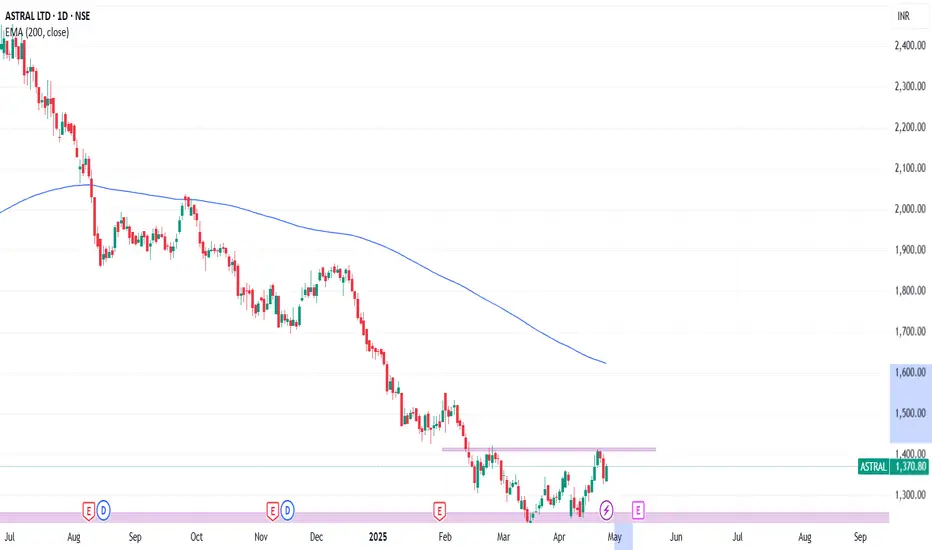
Breakout in AstralAstral Limited is building materials and equipment company based in Ahmedabad which makes chlorinated polyvinyl chloride and polyvinyl chloride pipes
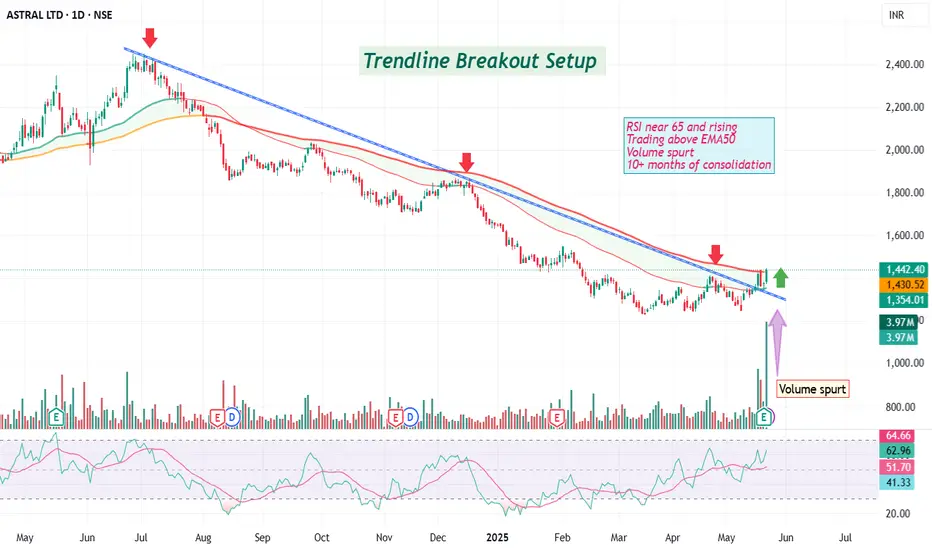
Trendline Breakout Setup
RSI near 65 and rising
Trading above EMA50
Volume spurt
10+ months of consolidation
Good quarterly result
Disc: For Study, not a recommendation
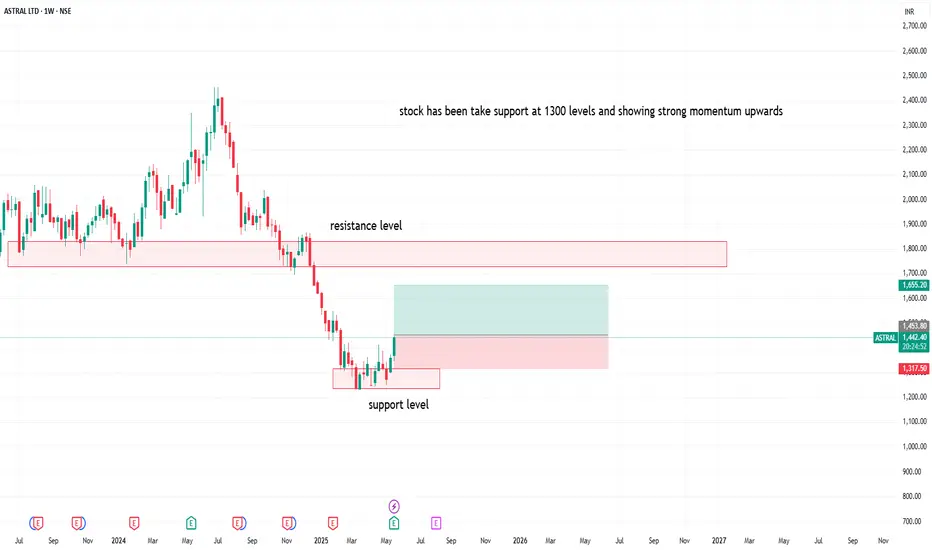
Astral showing strong upward movementAstral have created support at level of 1300
stock have consolidated and showing strength
good for upside
follow strict sl
ASTRAL price action analysis Astral Ltd (ASTRAL) has shown a mix of volatility and recovery in May 2025. After a sharp decline earlier in the month, the stock rebounded, with recent prices moving from the ₹1,330–₹1,350 range up to ₹1,377.70 as of May 21, 2025. The trading volumes have remained strong, indicating active participation from both buyers and sellers.
Technically, Astral is trading above its short-term volume-weighted average price (VWAP) of around ₹1,362.9, which is a positive sign for near-term momentum . The price action over the past week has included both sharp drops and quick recoveries, suggesting a tug-of-war between bulls and bears. Oscillators and moving averages currently indicate a neutral to mildly bullish setup, with the stock having recovered from oversold levels seen earlier in May.
Astral’s 52-week high is ₹2,454, and the 52-week low is ₹1,232, showing that the current price is closer to the lower end of its yearly range . The price-to-earnings (P/E) ratio remains high (around 70), and the price-to-book (P/B) ratio is also elevated, reflecting premium valuations . The company’s fundamentals remain strong, but the high valuation and recent volatility suggest that further upside may require continued earnings growth or positive sector developments.
In summary, Astral is currently in a recovery phase after recent volatility. The technical outlook is neutral to slightly positive as long as the stock holds above the VWAP and key short-term support levels. Investors should watch for sustained moves above ₹1,380–₹1,400 for confirmation of renewed bullish momentum, while a drop below ₹1,350 could signal renewed weakness.
ASTRAL Currently @ ₹100 RiskAgain the amazing pattern and close support.
Closest price to 1294 would be a good entry.
T1: 1600
T2: 1800
T3: 2400
SL: Price action below 1294 close.

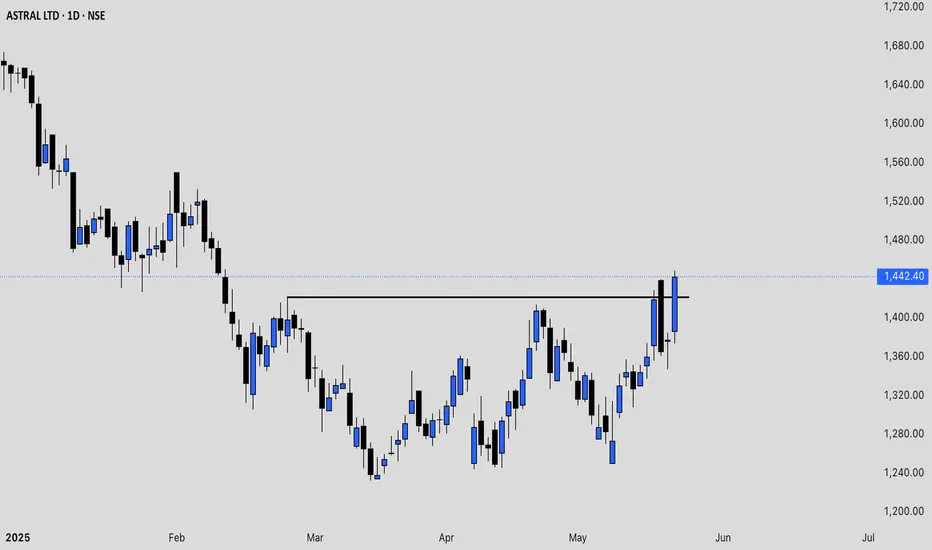
Astral - Great Results - Enter above 1400Astral posted great QOQ results. One can enter above 1400 with stop loss of 1369
📊 Financial Results (FY 2024–25):
✅ Standalone Results
Revenue from Operations: ₹52,959 million (↑ from ₹51,034 million in FY24)
Net Profit: ₹5,663 million (↑ from ₹5,504 million in FY24)
EPS (Basic & Diluted): ₹21.08 per share (↑ from ₹20.49)
✅ Consolidated Results
Revenue from Operations: ₹58,324 million (↑ from ₹56,414 million in FY24)
Net Profit (Owners): ₹5,238 million (↓ from ₹5,461 million)
EPS: ₹19.50 per share (↓ from ₹20.33)
🏗️ Capex and Growth Plans
Significant Capex:
Standalone capex: ₹4,950 million in FY25, mainly for property, plant, and equipment.
Consolidated capex: ₹5,448 million in FY25.
Acquisition Post FY End (Growth Initiative):
Acquired 100% stake in Al-Aziz Plastics Pvt. Ltd. (effective April 1, 2025) for ₹330 million.
Business focus: manufacturing fittings and accessories for water, gas, electricity & solar power distribution.
This aligns with expansion in plumbing and infrastructure solutions.
📦 Order Book & Business Segments
Segment Revenue:
Plumbing: ₹41,963 million (FY25)
Paints & Adhesives: ₹16,361 million (FY25)
Segment Profit:
Plumbing: ₹6,126 million
Paints & Adhesives: ₹1,150 million
Continued focus on core plumbing business with diversification into paints and adhesives.
Disclaimer : Please do your own research.

SWING IDEA for ASTRAL LTD for upto 10% to 50% in coming days. As the weekly and daily TF were in down trend but it seems like bottom has been formed with the confirmation of double bottom on weekly TF and can be traded either after breakout or another confirmation of the triple bottom confirmation at the trend lines.
#HAPPYTRADING # SWINGTRADING #SWINGIDEAS
this is pure technical analysis.
Astral - Looks good to buy at bottomAstral Poly Technik Ltd was established in 1996, with the aim to manufacture pro-India plumbing and drainage systems in the country. It has also forayed into adhesive business over years.
Market Cap: ₹ 36,884 Cr.
Promoter holding: 54.1 %
FII holding: 20.2 %
DII holding:14.6 %
Public holding: 11.0 %
Fundamentals are good. Near breakout level and good to hold for the next 6 months.

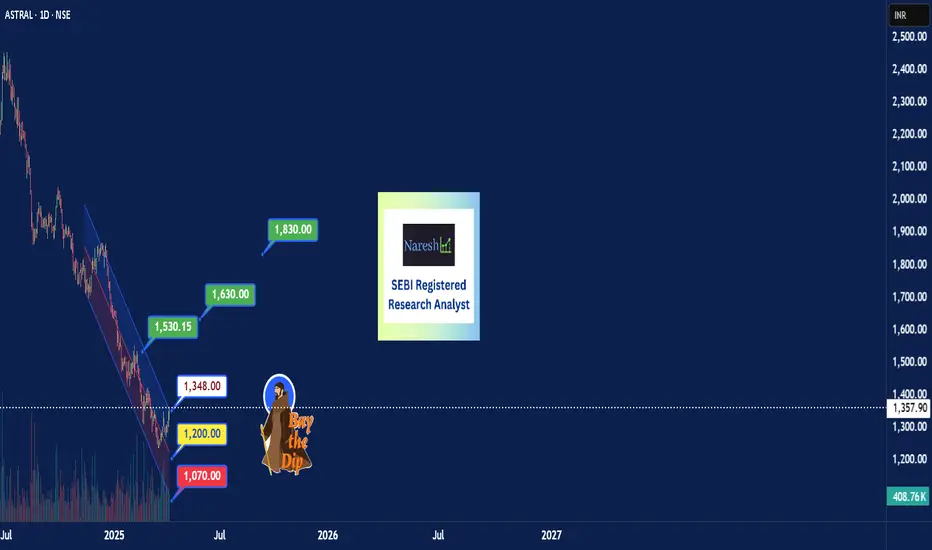
ASH-TRAL >> Piping Profits to Your PortfolioAstral
Plz avoid FnO Based trades
Regression Channel - on the verge of a Probable Breakout
CMP -> White
Buy Dips -> Yellow
SL -> Red
Tgts -> Green 1/2/3
all the above are mentioned in the chart
Plz follow TSL in order to maximize your profits
Lets hope it'll move as per our expectations
if you like this idea 💡 --- Plz don't miss to Boost 🚀
For more info - Plz visit my profile & Follow me
Rgds,
Naresh G
SEBI Reg.RA
Astral Bullish From Here Astral Limited, formerly known as Astral Poly Technik Limited, is an Indian company specializing in building materials and equipment. Established in 1996 by Sandeep Engineer, the company is headquartered in Ahmedabad, India. citeturn0search3
**Products and Services:**
- **Piping Systems:** Astral is renowned for introducing Chlorinated Polyvinyl Chloride (CPVC) pipes to the Indian market. Their product range includes CPVC, PVC, and other polymer-based pipes and fittings, catering to plumbing, sewerage, agriculture, industrial, and urban infrastructure applications. citeturn0search0
- **Adhesives:** Through its subsidiary, Astral Adhesives, the company offers a variety of adhesive products for both industrial and consumer use. citeturn0search3
- **Bathware:** Astral has diversified into bathware products, providing a range of sanitaryware and bathroom accessories. citeturn0search3
- **Paints:** In 2022, Astral expanded into the paints segment by acquiring a majority stake in Gem Paints, enhancing its product portfolio in the building materials industry. citeturn0search3
**Manufacturing and Operations:**
Astral operates multiple manufacturing facilities across India, including in Gujarat, Tamil Nadu, Rajasthan, Maharashtra, Uttarakhand, and Odisha. As of March 31, 2022, the company had a total manufacturing capacity of 282,338 metric tonnes per annum (MTPA) for pipes and water tanks, and 95,980 MTPA for adhesives. Additionally, Astral has adhesive manufacturing units in the United States and the United Kingdom. citeturn0search3
**Financial Performance:**
Astral Limited is publicly traded on the National Stock Exchange of India (NSE) under the ticker symbol "ASTRAL." As of March 19, 2025, the company's stock price was ₹1,238 per share, with a market capitalization of approximately ₹33,265 crore. The company has maintained a strong financial performance, with a return on capital employed (ROCE) of 23.2% and a return on equity (ROE) of 18.0%. citeturn0search2
**Recent Developments:**
In recent years, Astral has focused on strategic acquisitions to diversify its product offerings. The acquisition of Gem Paints in 2022 marked the company's entry into the paints industry. Additionally, Astral has expanded its adhesive business by acquiring UK-based Seal It Services Ltd, strengthening its international presence. citeturn0search3
For more detailed information about Astral Limited's products and services, you can visit their official website:

Astral Buy Rating From Here Astral Limited, formerly known as Astral Poly Technik Limited, is an Indian company specializing in building materials and equipment. Established in 1996 by Sandeep Engineer, the company is headquartered in Ahmedabad, India. citeturn0search3
**Products and Services:**
- **Piping Systems:** Astral is renowned for introducing Chlorinated Polyvinyl Chloride (CPVC) pipes to the Indian market. Their product range includes CPVC, PVC, and other polymer-based pipes and fittings, catering to plumbing, sewerage, agriculture, industrial, and urban infrastructure applications. citeturn0search0
- **Adhesives:** Through its subsidiary, Astral Adhesives, the company offers a variety of adhesive products for both industrial and consumer use. citeturn0search3
- **Bathware:** Astral has diversified into bathware products, providing a range of sanitaryware and bathroom accessories. citeturn0search3
- **Paints:** In 2022, Astral expanded into the paints segment by acquiring a majority stake in Gem Paints, enhancing its product portfolio in the building materials industry. citeturn0search3
**Manufacturing and Operations:**
Astral operates multiple manufacturing facilities across India, including in Gujarat, Tamil Nadu, Rajasthan, Maharashtra, Uttarakhand, and Odisha. As of March 31, 2022, the company had a total manufacturing capacity of 282,338 metric tonnes per annum (MTPA) for pipes and water tanks, and 95,980 MTPA for adhesives. Additionally, Astral has adhesive manufacturing units in the United States and the United Kingdom. citeturn0search3
**Financial Performance:**
Astral Limited is publicly traded on the National Stock Exchange of India (NSE) under the ticker symbol "ASTRAL." As of March 19, 2025, the company's stock price was ₹1,238 per share, with a market capitalization of approximately ₹33,265 crore. The company has maintained a strong financial performance, with a return on capital employed (ROCE) of 23.2% and a return on equity (ROE) of 18.0%. citeturn0search2
**Recent Developments:**
In recent years, Astral has focused on strategic acquisitions to diversify its product offerings. The acquisition of Gem Paints in 2022 marked the company's entry into the paints industry. Additionally, Astral has expanded its adhesive business by acquiring UK-based Seal It Services Ltd, strengthening its international presence. citeturn0search3
For more detailed information about Astral Limited's products and services, you can visit their official website

Astral a great BuyAstral is a great buy between 1100 to 1150.
Please wait for ASTRAL to touch the given level.
