Astral 1:6 risk / reward we can see it"s a high probability trade because it has formed 3 bullish patterns in multiple time frames with that it has already achieved 42% of the target and we can still expect 10-12% more .
I am expecting a retest at 1 hour channel pattern and goint to enter with a risk of 2.5% and a reward of 12%-14%
1- technical chart patterns in our favour.
2- multi time frame analysis results are bullish.
3- market (nifty 50) also seems positive.
4- fundamentally good
ASTRAL trade ideas

ASTRAL - Swing and Investment AnalysisASTRAL - Swing and Investment Analysis
1. Excellent breakout done in a weekly timeframe with the proper retracement.
2. Good time to buy this stock for a very short-term swing or a 1 or 2 months swing or an investment purpose.
3. For the next week it will touch the 2200, that is 10% in a week!!!
4. Then it may get some retracement and form an inverted head and shoulder pattern, the target will be 2530.
5. Once it crosses the 2530, which is its all-time high, it will fly to 3600 to 4000 based on the timeframe...
6. Strong support at 1750.
Note:
1. I’m not a SEBI Registered advisor, my research is personal and for educational purposes only.
2. Always check with your financial advisor and take the trade as per your risk/reward ratio.
3. Follow me for more patterns and like, and share so that we feel it is helpful to many and share more patterns...

Astral Ltd Long mest capital indicator has generated an alert of going long in equity for Astral Ltd.
Timeframe: weekly
Entry : High price of candel
Stoploss: Low price of candel
Happy trading 🙏

ASTRAL BULLISHASTRAL LTD STOCK has broke its trendline and is currently near its resistance if candle sustains above it you can go long after doing your own analysis.
I myself will take this trade with trailing SL but you have to manage your risk and see whether to enter or not.
ONLY FOR EDUCATIONAL PURPOSE..!

Falling wedge pattern ASTRAL.Discription:
Stock Name: ASTRAL
Chart Pattern: Falling wedge pattern
Time Frame: 1D
Entry: above 1960+
Targets: 2595+


MONSTER WOKE UPAstral limited looks very strong on daily chart, gives breakout on falling resistance trendline and closed above strongly and gives breakout on Bollinger bands too relative strength indicator gives signs of coming bullishness in this stock. Fundamental strong counter.
CAUSE OF LONG-:
1- Falling resistance trendline breakout.
2- Bollinger bands breakout.
3- Relative strength indicator breakout.
4- Combination of breakouts.

Astral Ltd Is Looking Good For Long Astral Ltd looking for long with the buy range of 1970 to 2000 with the target of 2179 and 2335

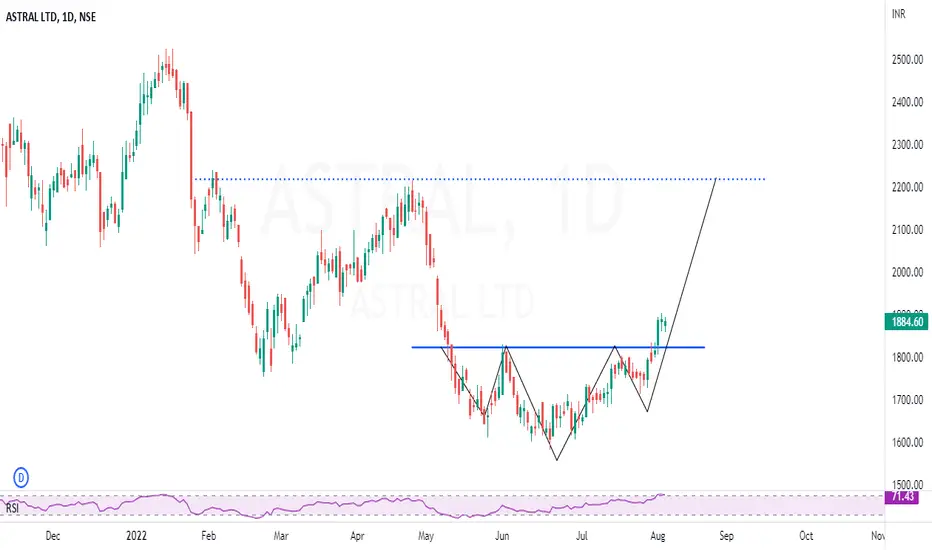
ASTRAL | Simple INHS pattern - Looks potential for 20%ASTRAL | Simple INHS pattern - Looks potential for 20%
CMP : 1885 (Dip : 1820)
SL : 1750
Target : 2200
1:4 risk reward setup
INVESTMENT PICK ASTRAL NSE:ASTRAL \
This is a positional trade
The stock is daily resistances zone ones it breaks there will a great upside move
The first target is 1980 and final target is 2100
We should accumulated around 1650 .
The company has posted a good quarterly result.
This is for educational purpose

ASTRAL UP TrendAstral corrected after 5th wave, and trying to make new high, let's see how it works.

astral ltdASTRAL LTD ....
1 - forming inverted h& s
2 - positive ma crossover
3 - positive rsi momentum
4 - good volume
5 forming higher low .

ASTRAL for Swing TradingAstral is spotted for Swing trading as it is showing positive divergance with RSI. Above 1700 levels it can show a good volume supported breakout. Above 1800 it can go upto1955 levels.
Check chart for more details.


Trend Line Breakout & Looks Good for a Positional Buy1) The stock has given a Strong Trendline Breakout with the candle closing.
2) It Took support from the Bottom.
3) Can go long above 1700
4) Target levels are mentioned in the chart

Astral polyBuying from bottom.zone.. 1550....
So wait for level. If you are wish you buy in small qty then you can add slowly ...

Head and Shoulders Pattern at AstralBe Cautious Head and Shoulders pattern (trend reversal) at #Astral weekly chart.
The head and shoulders pattern is believed to be one of the most reliable trend reversal patterns. It is one of several top patterns that signal, with varying degrees of accuracy, that an upward trend is nearing its end.
Stock seems to be changing trend(Head and Shoulders pattern) . One should try to keep the profits with them. Now if you think you are buying it on discount, then you are wrong - you are buying on the other side of trend.
ONLY FOR #educational
NOT SEBI REGISTERED. #LEARNEARN (DONT TRUST ANYONE)
#nifty50 #sharemarket #BREAKOUTSTOCKS #Multibagger #sharemarket #sharemarketindia #sensex #technicalanalysis #kukiinvest #Chartanalysis #headandshoulders #breakdown

Astral Chart Analysis !!📈 Astral 📉
My Findings :-
1. Breakout from Resistance Zone in and this zone is important because it was also acting as a support earlier.
2. Higher High and Higher Low Formation.
3. Close Above Feb, March 2022 High.
Bias- Long
Target- 2220, 2391 and 2489
SL- 1975
RR- 1: 2.5
All Important Supports and Resistances are drawn in chart. All levels are on closing basis.
Please have a look and revert back if you need some more study on it.
Disclaimer : Consult Your Financial Advisor Before Taking Any Decision On This Analysis.

Astral Long (25 Apr)Astral Long (25 Apr)
RSI- 65
Crossed crucial zone in weak market
Buy at CMP- 2198 or at 2160
SL- 2085
Target- 2360, 2500
Join us, Learn more, Earn more
Disclaimer- We are not SEBI registered advisor.
Charts and views are only for educational purpose.

Formation of wolf waveExpecting a Sharp fall in astral after it tests the resistance area
T1 1998
T2 1937


Astrail - Rising WedgeAstral :
Rising Wedge Spotted
Long above 2205, small resistance at 2240, once broken might move upwards
SL 2150

