AWL 1 Day View AWL (Adani Wilmar Ltd.) – 1 Day Chart Levels
Trend Context
The stock has been moving in a broad consolidation zone after strong moves earlier.
Price action is showing sideways to mildly bullish bias with demand zones holding well.
Momentum indicators on daily are stabilizing, showing potential for either a range breakout or continuation of sideways accumulation.
Key Daily Levels
Immediate Support Zone: ₹345 – ₹350
(volume accumulation + recent demand area)
Strong Support: ₹330
(swing low + psychological mark, breakdown here may extend downside)
Immediate Resistance: ₹370 – ₹375
(recent supply zone + rejection candles)
Major Resistance: ₹395 – ₹400
(big resistance cluster, breakout here may trigger trend continuation)
Positional Resistance: ₹420+
(if price sustains above 400, bullish momentum can extend to 420–440)
View
Above ₹375: Buyers may attempt a push toward ₹395–400.
Above ₹400 (sustained): Fresh momentum likely, targets ₹420–440.
Below ₹345: Weakness may drag price toward ₹330.
Below ₹330 (sustained): Larger downside risk opens up to ₹310–305.
Trade ideas

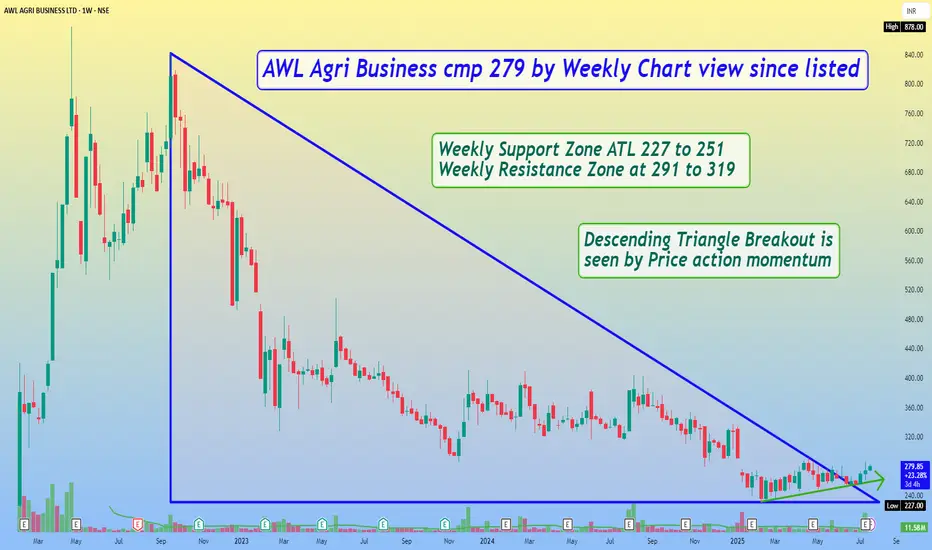
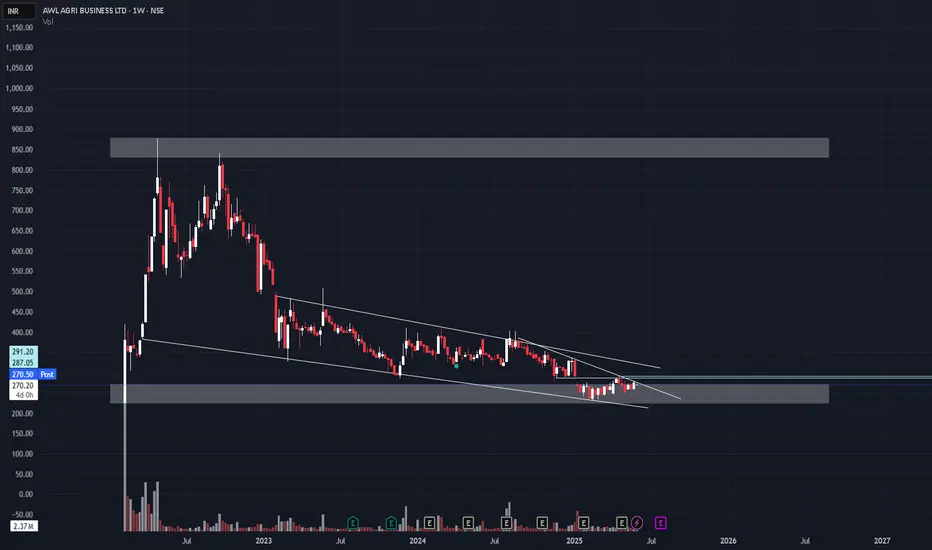
AWL Agri Business cmp 279 by Weekly Chart view since listedAWL Agri Business cmp 279 by Weekly Chart view since listed
- Weekly Support Zone ATL 227 to 251
- Weekly Resistance Zone at 291 to 319
- Descending Triangle Breakout is seen by Price action momentum
"Nurturing Growth, Nourishing India,"🟢 AWL Agri Business Ltd – Signs of Bottoming Out 🧩
CMP: ₹278.80 | NSE: AWL
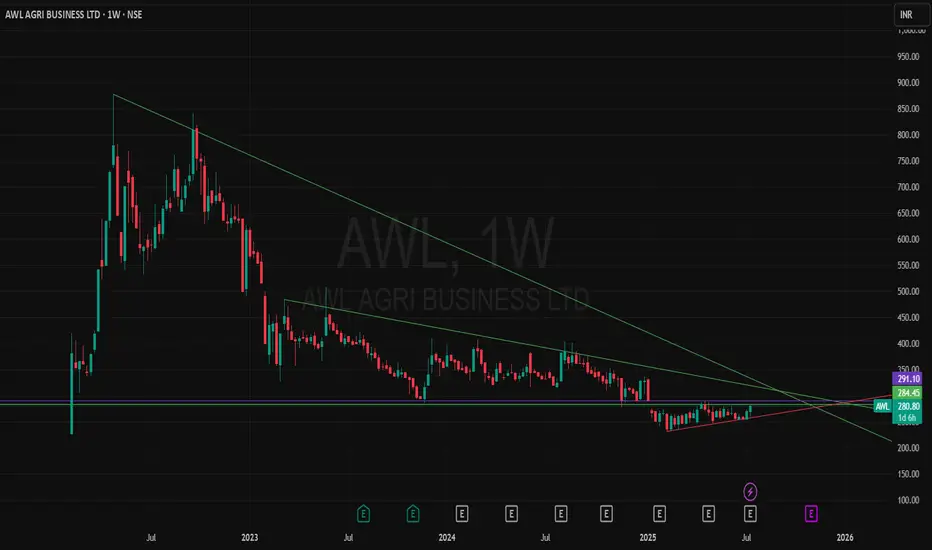
🔹 Multi-year downtrend seems to be ending with breakout from falling wedge
🔹 MACD turning positive on monthly & weekly charts – early sign of trend reversal
🔹 RSI rebounding from oversold zone with higher lows
🔹 Consistent volume buildup suggests accumulation by strong hands
🔹 Technicals + Valuation hint that downside may be limited
💼 AWL, a key player in India's agri supply chain, may benefit from rising demand for edible oils & food products. At current levels, valuations are attractive for long-term investors.
📌 Ideal for staggered portfolio addition with 3–5 year view
📈 Potential for re-rating if fundamentals improve and prices hold above ₹285–₹292 zone
🔍 Not a buy/sell recommendation. Only for study & educational purposes.
📝 Note: Please do your own due diligence. This is not a recommendation, just a view based on charts and fundamentals.
🧠 Disclaimer: For educational and research purposes only. No buy/sell advice.
📝 Chart Purpose & Disclaimer:
This chart is shared purely for educational and personal tracking purposes. I use this space to record my views and improve decision-making over time.
Investment Style:
All stocks posted are for long-term investment or minimum positional trades only. No intraday or speculative trades are intended.
⚠️ Disclaimer:
I am not a SEBI registered advisor. These are not buy/sell recommendations. Please consult a qualified financial advisor before taking any investment decision. I do not take responsibility for any profit or loss incurred based on this content.
AWL to rocketWhy Adani Wilmar will run ?
1. Harmonic M pattern completed
2. Elliot wave 2 completed and start of wave 3
3. Stock took support around 0.236 ratio of fib
Target: 520, 640, 890, 1000, 1200, 1500

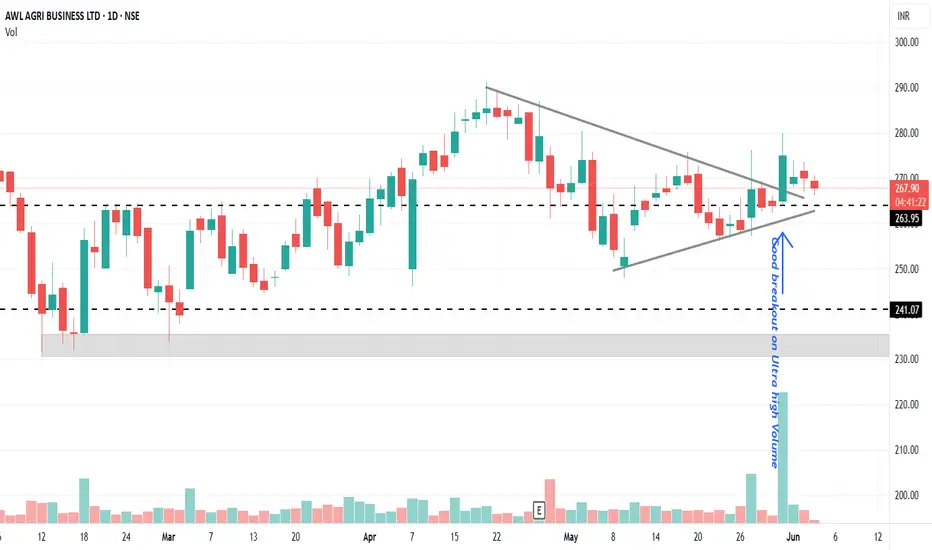
AWL agri Business has given breakout with good volumeAWL 268 has given breakout ( 279 ) on May 30 with good volume and is consolidating.
We suggested on May 24 @ 259 this as a good buy to be in port folio with 2 years target of 600.
any Adani fans??? AWL seems like its ready to blast up! most people will see this post after the big movement is already done!
give me a follow if u r seeing this post after the movement!!
give me a boost if u believe it will breakout!!
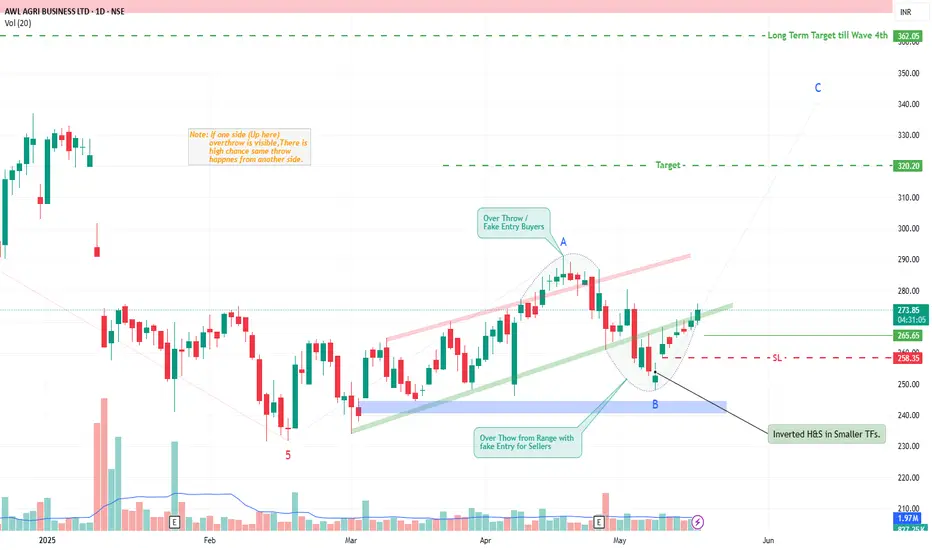
AWL Agri Business By KRS Charts 19th May 2025 / 10:42AM
Why AWL?
1. AWL was in Huge Correction mode after its first high after listed.
2. Correction path is showing clear Wave counts , finished Wave 5 downside and recently it likely in ABC Wave upside.
3. AWL was range bound for quite a time and recently shown upside overthrow (Fake Entry Buyside) from strong range and now likely same overthrow for downside also.
4. Price Action does this when some big move about to come it shakeout both Buyers & Sellers before going for final move.
5. Bullish traits like Inv. H&S and Wave counts , and Bullish Range bound is giving enough conviction to bet on this.
SL & Targets are pinned in Chart.
AWL has low P/E Ratio compared to its Industry.
Wave Count shown in Chart is rough prediction can be varied👍
Long Term Target SL will be 250 Rs.
Adani Wilmar Ready To BlastAdani Wilmar Is Ready to Blast
India Major edible Oil Producer And Marking Company Adani Wilmar Limited (AWL) is one of India's leading **Fast-Moving Consumer Goods (FMCG)** companies, specializing in edible oils, packaged foods, and essential household products. It is a joint venture between **Adani Group** and **Wilmar International**, a Singapore-based agribusiness company.
### **Key Details about Adani Wilmar**
- **Founded:** 1999
- **Headquarters:** Ahmedabad, Gujarat, India
- **Industry:** FMCG (Edible Oils, Food Products, Personal Care)
- **Parent Companies:** Adani Group & Wilmar International
- **Stock Listing:** Listed on **BSE & NSE** in 2022
- **Revenue:** Over ₹55,000 crore (~$6.6 billion in 2023)
### **Major Products & Brands**
1. **Edible Oils** – **Fortune**, King's, Bullet, Fryola, Raag, Alpha
2. **Packaged Foods** – Wheat flour, rice, pulses, sugar (Fortune)
3. **Personal & Home Care** – Soap, handwash, detergent (Alife brand)
4. **Industry Essentials** – Specialty fats, oleochemicals, castor oil
### **Market Position & Strengths**
✅ **Fortune is India’s No.1 edible oil brand**
✅ Strong distribution with **5,500+ distributors & 1.5 million+ retail outlets**
✅ Rapid expansion into packaged foods & home care products
✅ Focus on **sustainable palm oil & renewable energy initiatives**
move pending??? most of adani stocks gave a run up
personally entered today @375
sl 20-25% depending on market condition
if this is a proper breakout, can touch 800+ soon

ADANI WILAMR by KRS Charts5th Nov 2024 / 9:22 AM
Why AWL ❓❓
1. Decent Fundamental and Corrected Stock Technically.
2. Even its Correcting since long time, it made HL in monthly Timeframe. Which is good sign.✅
3. Clearly 5 Wave Correction Structure is finished, One Bounce is expected till 4th Wave height from current price.
4. Upside Movement can be Sluggish it's a swing Entry so. 📈
With a Good R/R more than 1:3 Target will be 509 Rs.
with SL of 285 Rs Daily Closing Basis.

ADANI WILMAR ON SUPPORT When WILMAR falls from high and start accumulating in the bottom zone , when price go up volume also goes up but price goes down volume doesn’t. It’s shows that there is opportunity to invest in this support area . Charts price shows rectangular channel bottom price . Now if we pick up from here then we have low risk.

Awl price movement ! So that was expected as I says before the price is looking good below around 315 the smooth buy side liquidity grab today that liquidity pools are highly magnetic price will always respect that levels!

315 is highly energetic area price are looking goodawl share is an a good area below 315 is a huge liquidity not any recommendation but it’s a great opportunity I look for quick displacement probably next week!

Monthly Chart Looking GoodKey Highlights : 🔰
🔷 Script Name : Adani Wilmar
🔷 Script Symbol : NSE:AWL
🔶 Stock In Demand Zone 🔥
🔶 Stock Support Level Near ₹ 300/- 🔥
🔶 Narrow Monthly Bollinger Bands 🔥
🔶 Volume Supported Price Move 💚
🔷 Stop Loss : Below ₹300/- Weekly Close 👀
🔷 Target : 🤔😊
Disclaimer: This is NOT investment advice. This post is meant for learning purposes only. Invest your capital at your own risk.
Happy learning. Cheers!!
Shyorawat Arun Singh ❤️
(@Shyorawat_ArunSingh)
Founder : Shyorawat Investing School


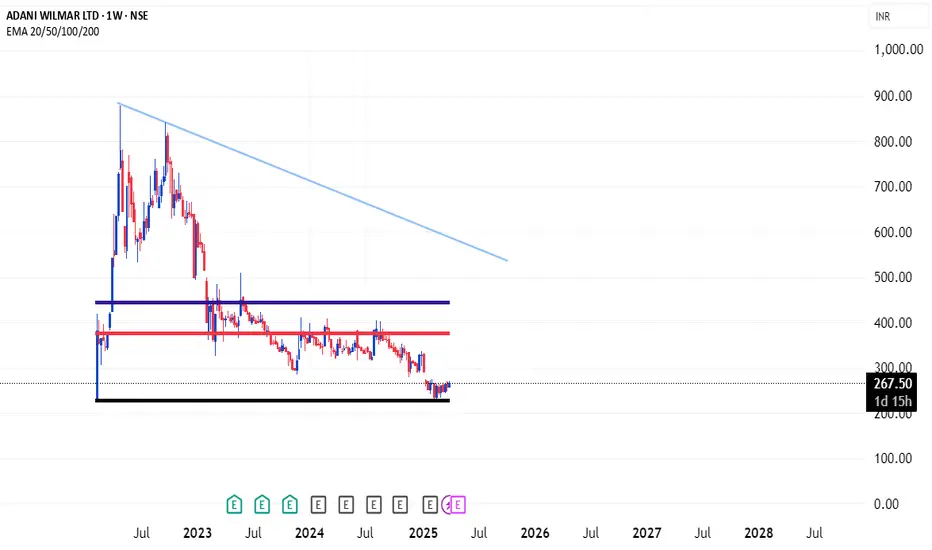
AWL - Breaking out of its weekly consolidation ?Adani Wilmar Ltd. breaking out of its consolidation zone on weekly chart and forming a bottom. Still week to close, lets see if it sustains or enters in consolidation zone again
An interesting chart to keep on radar
Lets See How it Evolves.
Disclaimer: NOT A BUY / SELL RECOMMENDATION I am not an expert I just share interesting charts here for educational purpose and not to be taken as buy/sell recommendation. Please seek expert opinion before investing and trading as trading/ investing in market is subject to market risks. I do not hold any position in the stock as on date but I may look to buy on dips with my own Risk Reward matrix.

ADANI WILMAR (DAILY)- IS THE SURGE IMMINENT?The stock seems to be consolidating in a tight range facing multiple rejections and support. The stock made a strong move of around 9% today while taking support from 50 and 200 ema, indicating buyers' interest. Entry above 410 can be initiated upon breaking out from the zone.
Considering the financial perspective with technical analysis, the stock seems ready for action.

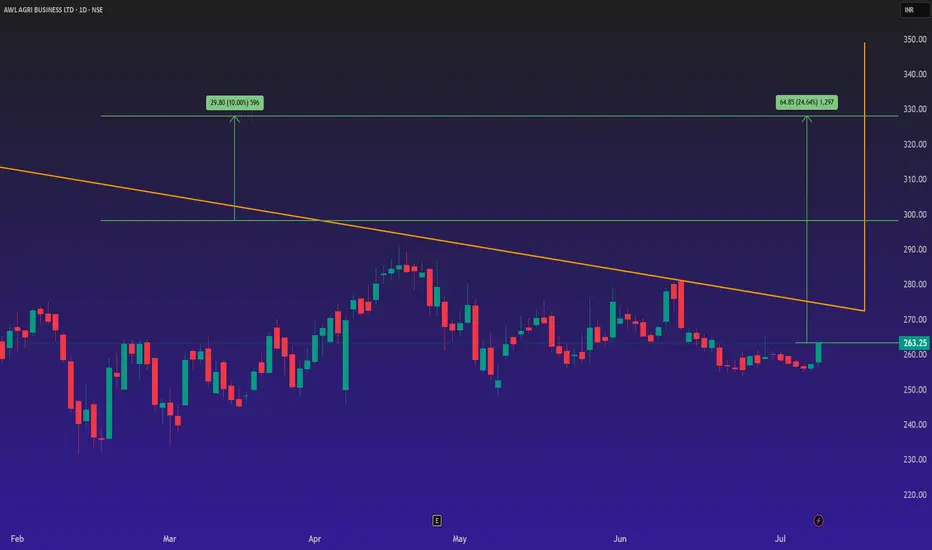
Adani Wilmar crossing the Fibonacci resistanceAdani Wilmar has been in down trend since long and since then it is moving in a channel.
In addition, based on Fibonacci levels it is crossing the first resistance level at 23.6% and will change it trend if it sustains above the levels of 414. The fourth attempt in breaking the resistance level.
If we get good volume then expecting 2-3 Target levels on the Fibonacci level of 38.2% and 50% of the next resistance levels at 414-474-557 and more if market sustains.
No recommendations, just my view based on chart pattern.

Long-term InvestmentIt's weekly time frame strategy for long term ... Entry when price bullish cross super trend level.. 1st target 40% share book @ 40% gain, 2nd target 30% share book @ 40% gain from 1st target... congratulation your investment is back with profit.... and also you have 30% share which is free of cost, so can hold it for life time If you want

Stock near Biuying Zone: Adani WilmarWilmar has been in downtrend.
It is trading near the the key support zone of 355.
It has strong support at 330 levels.
Resistance zone are around 380 - 420

A simple guide to coming up with an investment OpportunityHello,
1. Understand the Business
Before committing your money to any investment, the first and most crucial step is to thoroughly understand the company you’re considering. Below are some of the things you carefully need to look at.
Business Model: Start by breaking down the company’s business model. How does the company generate revenue? What are its primary products or services? In our case here;
Adani Wilmar Ltd. provides edible oil, vanaspati and specialty fats. The firm offers vanaspati, packed basmati rice, pulses, soya chunks, besan and specialty fats, lauric range products, castor oils, oleo chemicals and non-GMO soya products.
More analysis on the revenues & expenses of the company is also very key. All this data can be found on the Tradingview website under financials.
Once you have understood the companies moat, now its time to move to technical analysis.
Technical analysis is a method used to evaluate and predict the future price movements of financial assets, like stocks, by analyzing past market data, primarily price and volume.
Technical analysis is very important since all market information has been priced in the stock market price. Below is a past chart for the company adani Wilnar.
The chart shows that the company has moved from the bottom to the top and back to the bottom. From our Tradingview chart it's possible to identify the trend as well as the time used for each move. This will be very key as we build our trading bias. From our chart, its easy to see the time taken for each move and the highest/lowest prices.
Our chart easily communicates that the stock has been on a sideways move for over 500 days. Very key to note is that the stock is also trading at the bottom. This makes it at a great buy point.
Next is to identify the patterns forming on the chart. In our chart the stock is forming a corrective wave for a buy to the upside. My buy areas would be around 320 with my first target at IRN 500. I shall relook at the stock once we hit those areas.
Recommendation
Based on the analysis, consider buying Adani Wilmar Ltd. stock at around IRN 320, with a target to sell at IRN 500. Monitor the stock closely, especially as it approaches the target, to reassess your position.
Good luck!

SELL ADANI WILMAR @ 385 - 410Adani Wilmar is trading in a range which is 410 on upside and 325 to 315 is on downside. The stock is currently trading at upper range and we expect stock to heading towards lower range again. Sell @ 385 and add more if it goes upside until 411 is intact.
To motivate us, Please like the idea If you agree with the analysis.
Happy Trading!
InvestPro India
