AWL : CYPER PATTERN - CLUSTER SUPPORTS -EIFFEL TOWER VOLUMEAdani Wilmar Ltd. is an interesting chart with following
1. RSI on daily and weekly above 60
2. Price Consolidating between 285- 390 for almost last 8-9 months
3. Price trading above 14, 50, 64, 100, Day SMA and Above 20,50 Week SMA
4. Cluster of Averages support at 340-342-346-350 zones
5. Super Trend turned bullish on weekly chart
6. Cyper pattern under formation on Weekly chart.
7. Price gain with huge Eiffel Tower like Volume Bars.
Can be a good risk reward with buy on dips and dips near cluster of support and / or above 400 levels once price breaks out of consolidation channel and retests the same as per one's own risk reward setup
Lets See How it Evolves.
Disclaimer: NOT A BUY / SELL RECOMMENDATION I am not an expert I just share interesting charts here for educational purpose and not to be taken as buy/sell recommendation. Please seek expert opinion before investing and trading as trading/ investing in market is subject to market risks. I do not hold any position in the stock as on date but I may look to buy on dips with my own Risk Reward matrix.
Trade ideas

Adani Wilmar to catch up soon (Study Purpose)It is on the verge of breakout, SL is the BO Candle Rs348. Long overdue run up pending alongside other Adani group companies.
Q3 results are descent.
May move quickly towards Rs411, Rs510 and upon sustaining then upto Fib ext 1.618 levels.
Rsi above falling trendline, soon cmp will catch up with the move.
Adx showing strength.
Price at 200sma.
Disclaimer : Above scenario just for educational purpose and study of graphical movements as per available technical parameters derived by professionals. Be careful before investing and consult your advisor before making such decisions. I am not responsible for any mishaps or losses or gains. Not a registered sebi member.
Not invested yet.

AWL for 27% in 1 year. Momentum started on AWL, Company posted highest ever profit this quarter.
AWL is having potential to give 27% upside soon.

Buy Awl for a target of 440Buy Awl for a target of 440 in 1 month
Target of 500 in 3 months
Stock has reversed from long term support, can be added to portfolio

AWL FIRST TRAGET 500+ FINAL TRAGET 800+The AWL Adam Wilmer Stocks are clearly show the volume projection is very high so I have decided the short term bat one to three months short term target are 370 to 500 plus and medium to long term prospective targets are meet 800 plus but these target are achieved only for dependent in company sales growth company profit growth and companies margin growth this all criteria fulfill for the company so very easily achieve this all type of targets this stocks are my personal portfolio already so keep please discuss your financial advisor for this type of investment this contain are only for allocational purpose not for stock recommendation I have the shear for the technical perspective technical chart note for the any financial advice so please this type of investment please advise your financial advisor then after that you have invest this is stocks thank you

Adani Wilmar - Rangebound StartegyA range-bound trading strategy refers to a method in which traders buy at the support zone and sell at the resistance zone for a given stock. If price has bounced back multiple times from support and corrected multiple times from a particular resistance zone, this creates a good range to trade.
Typically, traders use range-bound trading in conjunction with other indicators, such as RSI or MACD

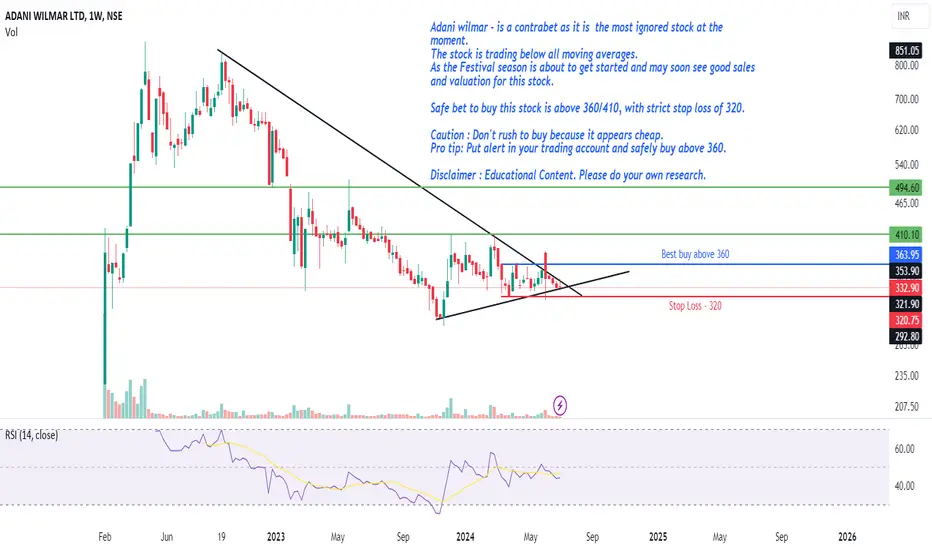
AWL - Best buy above 360Adani wilmar - is a contrabet as it is the most ignored stock at the moment.
The stock is trading below all moving averages.
As the Festival season is about to get started and may soon see good sales and valuation for this stock.
Safe bet to buy this stock is above 360/410, with strict stop loss of 320.
Caution : Don't rush to buy because it appears cheap.
Pro tip: Put alert in your trading account and safely buy above 360.
Disclaimer : Educational Content. Please do your own research.
AWL (Daily)AWL (Daily)
Adani Wilmar LTD
CMP 337
Stock is consolidating in a range from long time
can be good to buy above 350 close with volume

Adani Wilmar LtdTarget..416.89, 497.95, 563.50, 722.45,
(1) Incorporated in 1999, Adani Wilmar Ltd deals in edible oil and food and other FMCG products
(2) Business Overview:
Company is a Joint venture between Avani
CONS
Stock is trading at 5.28 times its book value
Though the company is reporting repeated profits, it is not paying out dividend
Company has low interest coverage ratio.
Company has a low return on equity of 7.16% over last 3 years.
Company's cost of borrowing seems higher
Sector: Edible Oil Industry: Solvent Extract ion

Hindenburg Research ko ThappadAdani Stocks on track for a decent rally ahead.
Adani Green
Adani Enterprises
ATGL
AWL

ADANI wilmar symmetrical triangle breakoutADANI WILMAR has formed symmetrical triangle and has given breakout.
1st target 400
2nd target 500

AWL : Buy from breakoutBUY AWL @350 STOPLOSS 335 TARGET 425
Put Stoploss on closing basis.
(In Trading Time it may go above/below stoploss But closing price is most important).
These are levels are generated on the basis on Fibonacci Series
NOTE : I am not SEBI registered advisor in capital market.
Disclaimer:- Please always do your own analysis or consult with your financial advisor before taking any kind of trades. Please understand Risk in trading before taking any trade with your financial consult. I am only sharing my knowledge it may be right or sometimes wrong so I am not liable for any loss.
Dear traders, If you like my work then do not forget to hit like and follow me, and guy's let me know what do you think about this idea in comment box, i would be love to reply all of you guy's.
Thank you.

Breakout in Adani WilmarBreak out in trend line identified supported by rise in volume. Company has posted good profits in Q4.
On a longer time frame, reversal at Fib 0.236 level found confirming the reversal.
Do your own research.

BUY AWLBuy this fundamentally strong stock on dips. Purchase 50% at the current price and add more if it reaches 321.
Stop loss: if two consecutive daily candle closes below the support trendline.

Adani Wilmar - Next Portfolio Stock for 510 & 840Stock Has Classic Wedge Unfolding. Buying Trigger Only Above 411. Once stock crosses upside above 411, It can zoom upside towards 510 & Above 510 for 840 in next few months or year ahead.
From
WaveTalks
Abhishek

Adani Wilmar Limited: 148% upmove possible➡️adani group
➡️148% upmove possible
➡️market leader in some segments with continuous Capex
Cons:
Margins are weak (safe traders to wait for improvement in op. margin)


Adani Wilmar Ltd - Breakout OpportunityDate : 27-Feb-2024
Rating : Buy
LTP : Rs. 387.85
Targets: (1) Rs. 419 --> (2) Rs. 492 --> (3) Rs. 532 --> (4) Rs. 639
SL : Rs. 350
Technical View:
Since SEP 2022 NSE:AWL has been in primary down trend. On 19-Feb-2024, NSE:AWL has given break out from its primary down trend with higher than average volume. RSI is above 50 and MACD is above 0. Indicating bullish sign for coming days.
Disclaimer : I am not a SEBI registered analyst/consultant and not recommending anyone to take any BUY or SELL position in stock market. Investing in stock market is risky and one should do a self analysis and validation before investing in stock market.

Adani Wilmar LTD analyasis on 3 mar 24Adani Wilmar LTD analyasis on 3 mar 24
Good stock to buy after bottoming out
Stoploss 320 (on a Closing basis)
target 430 - 460 - 500 - 540 - 580

AWL ready to break symmetrical Triangle Pattern-ready to break symmetrical triangle pattern with strong candles
-volume & rsi rising shows strength in stock momentum
-strong support from ema and sma keep in radar

AWL bullish; above 400 ? - Monday 26th Feb.The above information does not constitute investment/trading recommendation and it is purely for educational purpose. Please check the Strategy below...
SWING Trading Strategy:
Position is created, only upon stock closing above the entry price on day closing basis and is held on for 5-10 trading sessions for larger gains (5-10%)
INTRADAY Trading Strategy:
1) Impulse upmove stage: The strong upmove (nearly upto 2% from breakoutprice) happens within five to 15 minutes. "High Risk Traders" buy in hope of another 2% upmove intraday.
"High Risk Traders" patiently wait through the Pullback-Consolidation stage to realize profits. High risk/High reward set up as breakouts may fakeout (reversal)also
2) Pullback-Consolidation stage: After the above "Impulse upmove stage"; the price may then pull back and move sideways (between "Open" price and "High" of the above "Impulse upmove stage").
Safe traders with minimum risk profile wait for a breakout from the consolidation to enter at this stage to relize high profits in the final intraday final "Breakout continuation" stage
3) Breakout continuation: Stocks often in the third stage breaks up above the "High" of the first "Impulse upmove stage" and continue to go higher again.
Both Safe Traders/High Risk Traders book profits at this stage
This do not constitute, financial, investment, trading, or other types of advice or recommendation.

Stong Bulish candle with VolumeAdani Wilmar AWL
Stong bullish candle with volume and rsi above 60 uptick and adi also signal uptrend in comming days fingures crossed

Amazing swing trading idea for 26 Feb Markets I daily make educational content videos for swing / positional trading.
