Add to watchlistBUY at CMP - Rs. 410 (Breakout point)
Target - 1: Rs. 512
Target - 2: Rs. 620
-Bullish flaf pattern
- please invest at your own risk.
Trade ideas

AWL target 470Adani Wilmar ltd trendline support on daily time frame,
Buy above 410 ,
target 470,
Sl 390
Note:- Education purpose only.. not advice to buy.

Swing Trade Buy Adani Wilmar Ltd As Per Swing Trading strategies and Technical Analysis AWL looks Bullish.
buy this Stock Near 402-404, Stop Loss 375 Target 440,460 Time Frame 90 Days.
Risky Call
only For Educational Purpose.

ADANI WILMAR - 75% RETURNS!!!BUY - ADANI WILMAR LTD
CMP - Rs. 419
Target - 1: Rs. 620
Target - 2: Rs. 740
.
.
Technicals - Descending Channel Breakout
.
This is just a view by an expert analyst, please invest at your own risk.
.
Follow me for more!

ADANI WILMAR long and shortAWL break the downward trend line and closed above the trend line (above 406.55). Now stand at make and break level. It can go 384 down side and anyone go for long with 390 SL.
Summarily, it is the good accumulation zone atleast for 20% in short term.
In short time frame, with 399 SL long is good.
Thank you.

AWL - Short Term Investment Disclaimer.
I am not SEBI registered analyst.
My studies are for educational purposes only.
Please Consult your financial advisor before trading or investing.
I am not responsible for any kind of your profits and your losses.

Adani Wilmar Technical ViewVery Good Weekly Demand Zone between 365-336. One can take entry over here and hold for 3-6 months for a good reversal.

#ADANI WILMAR short term viewAs all knows about adani group stocks tanked down due to hindenburg report, so, i though to share next course of action on those, follow the levels for entry, support and target. Fundamentally good stock.

Adani Wilmal Support and Resistance Enter or Escape ? Supply and Demand Zones For Day Time Frame Chart Analysis
Major Support 1 - 344
Major Support 2 - 313
Major Resistance 1 - 421
Major Resistance 2 - 499
Major Resistance 3 - 558

ADANI WILMARNSE:AWL is a one of the company of Adani group with below average fundamental but with the good business model.
currently, on the daily chart frame the company has made a vivid head and shoulder pattern. and also it consist of many gaps in the past.
so fresh investors should avoid this company and wait for the good valuations. and it has sell target of 472.

Fortune Looks GoodNSE:AWL
Hi
Next three seller Freeze levels can be 360.95 , 342.9 and 325.7. chart shows that 355 to 392 was the accumulation zone last time after IPO.
so selling pressure can stop in this range and buying can be seen. if breaks below 300 then looks no support. more risk more gain , Indians can not eat without cooking oil and Fortune brand is sold throughout the country. and Its a no 1 brand in cooking oil. public holding is very less.
Disclaimer: Analysis is for training and education purpose. author may enter in trade, take your own decision , This is an trading idea not an trading or Investment advice. consult your financial advisor before investing.

AWLIn the weekly chart of AWL, we might see a trend change from last FIBONACCI level.
Buying might start from 350-370 levels.
Wait for a Bullish candle and pattern.
Let the chart confirm the Trend change and then enter with SL


Adani Wilmar CrashShares of Adani Wilmar have crashed and have broken the recent low as well. Be careful in this stock and do not enter until price stabilizes. All Adani Group Shares are under pressure due to the Hindenburg Research Report. Let us see what the developments are in the future regarding this fiasco. In the meantime keep it on your radar.

Adani Group before & After HindenBurg Report - ImportantThere is this very famous saying in Stock Market - Market keep doing what it wants to, and news/events are just excuses given for small traders to satisfy their logics.
You can see this in charts of various Adani group of Shares. check below charts -
These shares were already in correction mode before this report.
Now decide yourself, whether one needs to panic or not.

Adani Wilmar - Important zonesKey highlights:
- Hovering near daily demand zone + swing level
- Any lower move can trigger a sell-off to the weekly demand zone
- A re-accumulation from the weekly demand zone seems like a good idea
Disclaimer: This is NOT investment advice. This post is meant for learning purposes only. Invest your capital at your own risk.
Happy learning. Cheers!
Rajat Kumar Singh (@johntradingwick)
Community Manager (India), TradingView


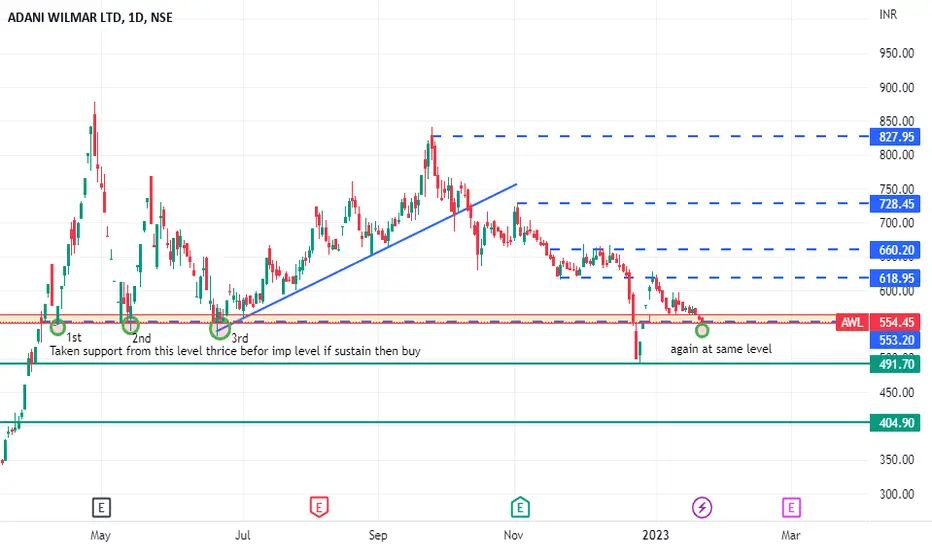
Adani wilmarAdani wilmar
at support level for fourth time if a green candle form on day end buy for swing and short term trade
trg 582,621,750
sl 499

ADANI WILMAR - next supportsThe yellow lines indicate the next support levels as it has started gap fill on the down side

HEAD AND SHOULDER BREAKOUT (AWL)Head And Shoulder Breakout
CMP: 435
Targets for Downside: 591 and 551
SL: 671 Above Previous Swing High
AWL Broke this years major support retested the support area and now heading to downside.
Disclaimer: This is for educational purposes only, not any recommendations to buy or sell.

Adani Wilmar LONG Adani wilmar has formed pole and flag on daily time frame
stoploss and target mentioned on the charts
Educational purpose only,Trade accordingly

