Positional or Longterm Opportunity in Axis BankGo Long @ 1005.05 for Targets of 1123, 1182, 1275.35, and 1320.4 with SL 960
Reasons to go Long :
1. On a Weekly timeframe if we draw the Fibonacci retracement tool from the recent swing low (point A) to the recent swing high (point B) then we see stock took support from the 0.382 Fibonacci level.
2. Besides, a bullish candlestick pattern Bullish Engulfing (marked with orange) is formed around the 0.382 Fibonacci level.
3. Also there is a strong Trendline (marked with green color) which supports the stock.
AXISBANK trade ideas

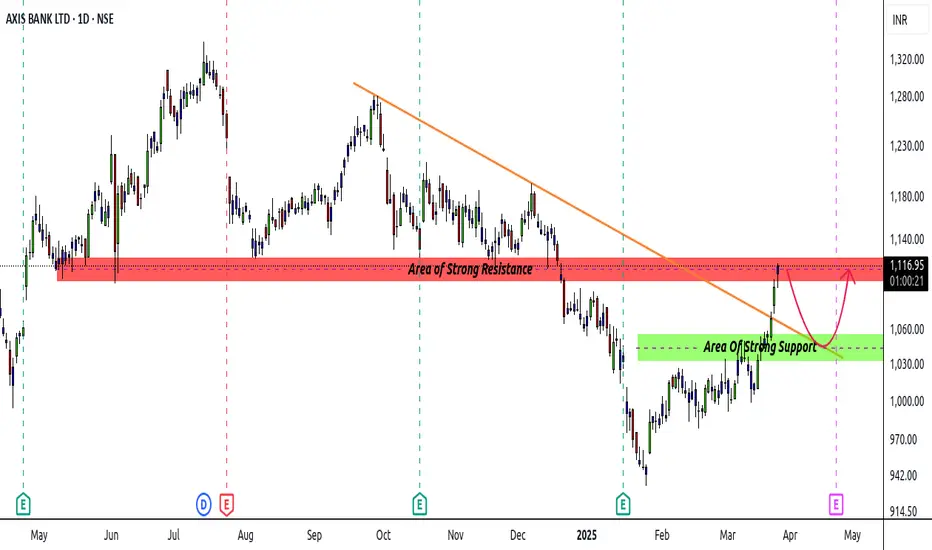
Axis Bank - Possible ResistanceStock in sideways to uptrend past few weeks
Right now reaching a DBD area + Flip zone
Combine resistance area from 1115 - 1125
Stock may go sideways and if possible try to move downwards upto 1040 - 50 levels
Upside Sl can be kept above 1030 (CLBS)
Whole market is in minor uptrend so be cautious before taking a counter trade
Take confirmation from LTF
AXIS BANKTechnical Analysis Report
Stock Overview: Axis Bank Ltd - NSE - Current Price: ₹1,097.85. Axis Bank Ltd is a prominent private sector bank in India, offering a wide range of financial services, including retail banking, corporate banking, and treasury operations.
Key Levels:
Support (Yellow Zone): ₹926.70 - ₹952.52
Swing Zone (Green Zone): ₹1,015.00 - ₹1,091.53
Technical Indicators:
RSI (Relative Strength Index): The RSI value is 52.62, indicating neutral momentum as it is close to the midpoint of 50.
Volume: The trading volume is 8.28M, reflecting moderate investor interest. Higher volume often signals stronger price movements.
MA (Moving Average): The stock is trading above its 50-day moving average (₹1,091.53) but below its 200-day moving average (₹952.52), suggesting a mixed trend.
Sector and Market Context: Axis Bank operates in the financial sector, which has been experiencing fluctuations due to economic conditions, interest rate changes, and regulatory policies. While the overall market shows signs of recovery, uncertainties persist, impacting the banking sector's performance.
Risk Considerations: Potential risks include changes in interest rates, regulatory shifts, economic downturns, and geopolitical events. These factors could influence the stock's movement and overall market sentiment.
Analysis Summary: Axis Bank Ltd presents a mixed technical outlook with identified support and resistance levels. The RSI indicates neutral momentum, and the volume suggests moderate investor interest. Moving averages provide a mixed trend signal. Investors should carefully consider sector and market conditions, along with potential risks, before making investment decisions.
AXIS BANK - Trendline Trading StrategyTrendline Trading Strategy: Entry & Exit Points
A trendline trading strategy involves using trendlines to identify potential buy and sell opportunities in a market. The trendlines act as dynamic support and resistance levels.
1. Understanding the Trendline Strategy
Uptrend: The price forms higher highs and higher lows, and the trendline is drawn connecting the lows (support).
Downtrend: The price forms lower highs and lower lows, and the trendline is drawn connecting the highs (resistance).
Channel: If two parallel trendlines contain price movement, the price oscillates between support and resistance.
2. Entry Points (Buy & Sell)
Buying (Long Entry)
When the price touches the lower trendline (support) and shows bullish signals (e.g., bullish candlestick patterns, volume increase, RSI oversold).
Example in the image: Around ₹900-₹950 levels where the price touches the lower trendline.
Stop-loss: Below the trendline, ensuring minimal risk.
Target: Mid-level of the channel or the upper trendline (resistance).
Selling (Short Entry)
When the price touches the upper trendline (resistance) and shows bearish signals (e.g., bearish engulfing pattern, volume spike, RSI overbought).
Example in the image: Around ₹1,400 levels where the price reversed.
Stop-loss: Slightly above the trendline to avoid false breakouts.
Target: Mid-level of the channel or the lower trendline.
3. Exit Strategy
For Long Trades: Exit near the upper trendline (₹1,300-₹1,400).
For Short Trades: Exit near the lower trendline (₹900-₹950).
Trailing Stop: Adjusting stop-loss to lock in profits as price moves in favor.
The information provided in this discussion is for educational and informational purposes only and should not be considered financial, investment, or trading advice. Trading and investing in financial markets involve risk, and past performance does not guarantee future results.
Before making any trading or investment decisions, it is recommended to conduct thorough research, seek professional advice, and assess your risk tolerance. The use of trendline trading strategies or any other technical analysis methods should be done with caution, and traders should always use proper risk management techniques.
The author and publisher are not responsible for any financial losses incurred as a result of using the information presented. Always trade and invest responsibly.

Trading Plan for AXIS BANK (NSE)
Timeframe: 4H
Current Price: ₹1,015.60
Bias: Bullish
Entry Strategy:
Ideal Buy Zone: Between ₹970 - ₹996 (buyside liquidity area)
Confirmation: Look for a bullish candle confirmation in this zone before entering.
Target Levels:
Primary Target: ₹1,120
Final Target: ₹1,192 (Sell-side liquidity)
Stop Loss:
Below ₹910 (Strong support and invalidation level)
Risk-Reward Ratio:
Approximately 3:1 (Good R:R setup)
Additional Notes:
Price has broken out from a recent structure and is heading towards liquidity.
A potential retracement to the buy zone could offer a better entry.
Be cautious of market conditions and broader indices movement.

Axisbnk**Axis Bank Ltd. (AXISBANK) Stock Analysis**
**Company Overview:**
Axis Bank Ltd. is a leading private-sector bank in India, offering a comprehensive range of financial products and services, including retail banking, corporate banking, and wealth management. Established in 1993, the bank has expanded its footprint across the country with an extensive network of branches and ATMs.
**Fundamental Analysis:**
- **Market Capitalization:** Approximately ₹3.12 trillion. citeturn0search6
- **Price-to-Earnings (P/E) Ratio:** The stock is trading at a P/E ratio of 11.08, which is a 12% premium to its peers’ median range of 9.93. citeturn0search6
- **Earnings Per Share (EPS):** ₹105.52, reflecting the bank's profitability.
- **Return on Equity (ROE):** 13.6% over the last 3 years, indicating moderate efficiency in generating profits from shareholders' equity. citeturn0search7
- **Debt-to-Equity Ratio:** 0.62, suggesting a moderate level of debt in the bank's capital structure.
- **Dividend Yield:** 1.2%, indicating a conservative dividend payout policy.
**Technical Analysis:**
- **Current Price:** ₹1,008.95. citeturn0search6
- **52-Week Range:** The stock has traded between ₹915.50 and ₹1,118.90 over the past year, indicating significant volatility. citeturn0search1
- **Support Levels:**
- First Support: ₹1,000.00
- Second Support: ₹950.00
- **Resistance Levels:**
- First Resistance: ₹1,100.00
- Second Resistance: ₹1,150.00
- **Breakout Point:** A sustained move above ₹1,100.00 could signal the start of a bullish trend.
- **Retest Levels:** After a breakout above ₹1,100.00, a retest of this level would confirm its strength as new support.
**Recent Performance:**
- **1 Week:** The stock has decreased by 2.00%.
- **1 Month:** The stock has decreased by 5.39%.
- **6 Months:** The stock has decreased by 3.61%.
**Analyst Ratings:**
- Morgan Stanley maintains an 'Overweight' rating on Axis Bank with a target price of ₹1,300, suggesting a 25% upside from the current market price. citeturn0search0
- CLSA has reiterated its 'Outperform' rating on Axis Bank with a target price of ₹1,400, indicating a potential upside of 34%. citeturn0search0
**Conclusion:**
Axis Bank Ltd. exhibits strong fundamentals with a diverse business portfolio and efficient use of equity. Technically, the stock is trading near its support levels, indicating potential for upward movement if these levels hold. Investors should monitor the breakout above ₹1,100.00 and consider the support levels at ₹1,000.00 and ₹950.00 for potential entry points.
*Please note that stock market investments carry inherent risks. It is advisable to conduct thorough research or consult with a financial advisor before making investment decisions.*

Axis Bank - Reversal from Support? Bullish Continuation Ahead!Axis Bank weekly chart shows a potential reversal setup as it tests key support levels: the lower boundary of an ascending channel and the 200-week EMA. If bullish confirmation emerges, this could present an excellent swing trade opportunity. Let me know your thoughts in the comments! #AXISBANK #TechnicalAnalysis #SwingTrading"
Key Observations:
1. Ascending Channel Support:
- The price is currently testing the **lower boundary of the ascending channel**, which has acted as dynamic support since 2020.
2. 200-Week EMA Support:
- The **200-week EMA is providing additional support, reinforcing the likelihood of a bounce from this level.
3. Bullish Structure Intact:
- Despite the recent correction, the overall trend remains bullish as long as the price respects the channel's lower boundary.
5. **Upside Potential**:
- If the reversal materializes, the price could aim for the midline of the channel and eventually retest the upper boundary.
---
Disclaimer:
This analysis is for informational and educational purposes only and does not constitute financial advice. Trading involves risk, and past performance is not indicative of future results. Always conduct your own research and consult with a qualified financial advisor before making any investment decisions.

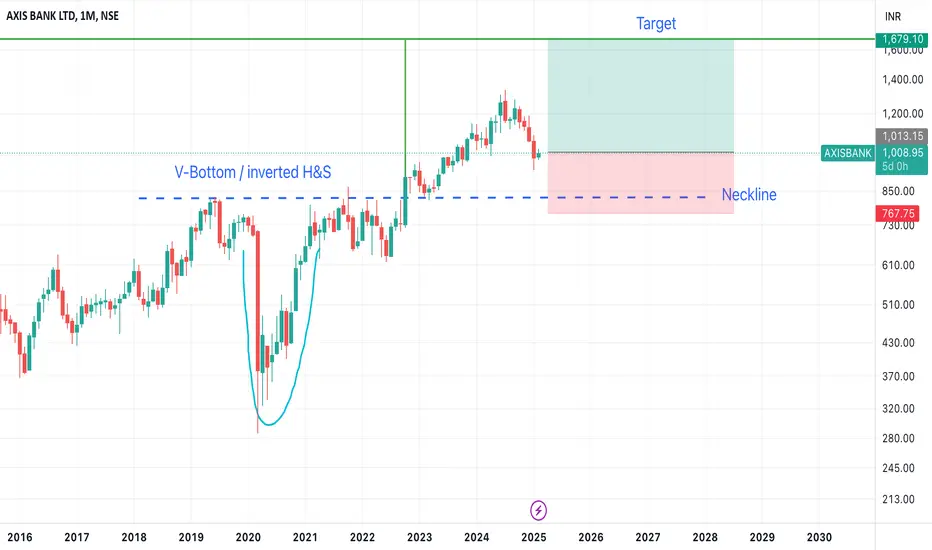
Long term: V bottom / Inverted H&SLong term: V bottom / Inverted H&S
- Stock didn't have strong momentum and had a channel resistance
- Pattern target is yet to reach
- Long term position (3-5 years)
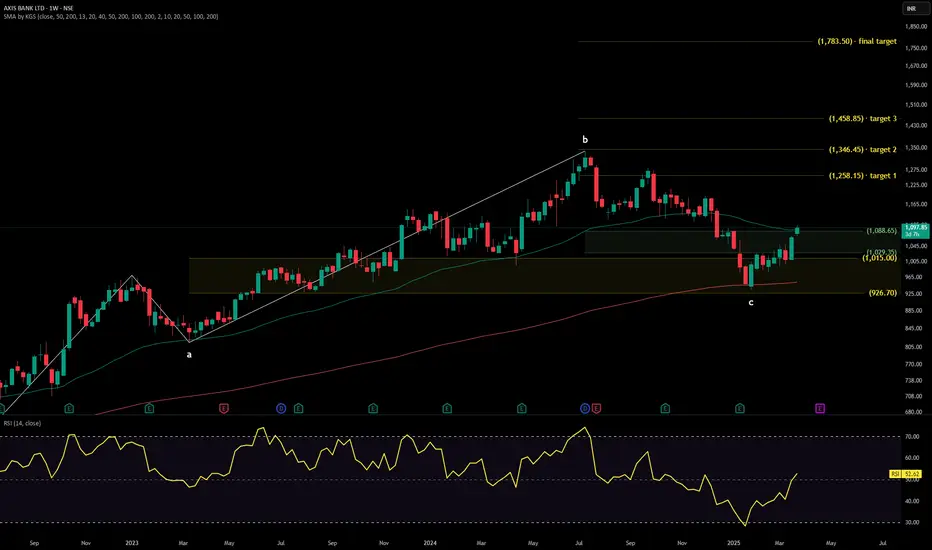
Axis Bank Ltd (NSE)📢 Axis Bank Ltd (NSE) – Swing & Short-Term Trade Analysis 📢
🚀 Profit from Market Swings with Strategic Trading! 🚀
This analysis provides a structured entry-exit strategy based on the Butterfly Pattern and key support-resistance levels.
📊 Swing Trading (1 to 3 Months) – Short-Term Profit Strategy
🔹 Entry Zone – Above ₹995.70 (Confirmation Needed)
🔹 Current Price – ₹1,008.95 📈
🔹 Target 1 – ₹1,094.55
🔹 Target 2 – ₹1,193.15
🔹 Short-Term Target – ₹1,340.40 🚀
🔹 Stop-Loss (SL) – Below ₹933.55
🔹 Risk-Reward Ratio – Maintain a 1:3 or 1:6 strategy
🔹 Market Condition – Works best if price sustains above entry level
📌 Key Strategy for Swing Traders:
✔ Enter above ₹995.70 to confirm bullish momentum
✔ Book partial profits at ₹1,094.55 and ₹1,193.15
✔ Adjust SL to break-even once Target 1 is achieved
✔ Exit fully if trend weakens near key resistance
📈 Short-Term Holding (6 to 12 Months) – Investment Strategy
🔹 Entry Level – ₹995.70 (Breakout Zone)
🔹 Target Potential – ₹1,340.40 🚀
🔹 Stop-Loss (SL) – Below ₹933.55
🔹 Strong Support & Re-Entry Zone – ₹834.50
🔹 Profit Booking Strategy – Gradual exit as price nears targets
📌 Key Strategy for Short-Term Holders:
✔ Accumulate near ₹995.70 with a strict SL
✔ Monitor price movement above ₹1,094.55 for momentum
✔ Hold for 6-12 months for maximum gains
✔ Reassess position if price falls below ₹933.55
🔻 Risk Management – Bearish Scenario
🔻 Immediate Support – ₹933.55
🔻 If Breakdown Happens – Price may test ₹834.50
🔻 Risk Reduction – Exit early if bearish momentum increases
📌 Risk Management Guidelines:
✔ Trade with predefined Stop-Loss (SL)
✔ Avoid overexposure; secure profits systematically
✔ Stick to entry-exit strategy for risk control
🚀 Why This Trade? 🚀
✅ Clear Buy & Sell Zones – Reduces uncertainty
✅ Multiple Targets for Profit-Taking – Ensures flexibility
✅ Risk-Controlled Approach – Minimizes potential losses
✅ Technical Confirmation – Based on Butterfly Pattern & Key Levels
📢 💡 Trade Smart, Stay Profitable! 💡
⚠ Important Disclaimer ⚠
All detail for chat. good entry at mark price only. and must stoploss minimum risk and good profit. risk ratio 1:1 to manage modified SL.
📌 This is not a buy/sell recommendation, just an educational trading idea.
📌 Market conditions can change; always conduct your own research.
📌 Understand risks before investing and take full responsibility for decisions.

what is vwap statergy ?**VWAP (Volume-Weighted Average Price)** is a popular trading indicator that represents the average price of a security, weighted by volume, over a specific time period (usually a trading day). The VWAP strategy is a technique used by traders to determine the average price at which an asset has traded throughout the day, factoring in both the price and volume of the trades. It is particularly useful for assessing the fairness of the current price relative to the overall trading activity and volume during the day.
### How VWAP Works:
- **VWAP** is calculated by taking the sum of the value of all trades (price × volume) over a specific time period and then dividing that sum by the total volume for that period. The result is the average price at which the asset has traded, weighted by volume.
The formula for VWAP is:
\
Where:
- **Price** = the price at which the asset was traded.
- **Volume** = the number of shares/contracts traded at that price.
### Key Points:
1. **Time Frame**: VWAP is typically calculated for each trading day, and it resets at the start of each new day.
2. **Volume-Weighted**: Unlike a simple moving average (SMA), VWAP considers volume in its calculation, which gives more weight to prices where more trades have occurred.
3. **Dynamic Indicator**: VWAP moves throughout the day as new trades occur, making it a dynamic, real-time indicator.
### VWAP Strategy:
Traders use VWAP as a reference point to make trading decisions, particularly in **intraday** trading. The key idea is that prices above or below VWAP can signal bullish or bearish conditions, respectively. Here are some of the ways the VWAP strategy is typically used:
#### 1. **VWAP as a Trend Indicator**:
- **Above VWAP**: If the price is trading **above** the VWAP, it is considered to be in a **bullish trend**. Traders may look for long (buy) opportunities as this suggests that the market is generally in an uptrend.
- **Below VWAP**: If the price is trading **below** the VWAP, it is considered to be in a **bearish trend**. Traders may look for short (sell) opportunities as this suggests the market is in a downtrend.
#### 2. **VWAP as Support/Resistance**:
- The **VWAP line** can act as **support** in an uptrend and as **resistance** in a downtrend. If the price is moving higher and retraces towards the VWAP, traders may look for buying opportunities near the VWAP, expecting the price to bounce off the VWAP and continue upwards.
- Conversely, if the price is falling and retraces towards the VWAP in a downtrend, traders may look for selling opportunities, anticipating the VWAP to act as resistance and the price to continue downwards.
#### 3. **VWAP and Reversals**:
- **Reversal Signal**: A reversal from the VWAP can be a significant signal for a change in trend. For example:
- If the price has been below the VWAP and suddenly crosses above it, traders may interpret this as a **bullish reversal** and look for long entry points.
- Conversely, if the price has been above the VWAP and suddenly crosses below it, traders may interpret this as a **bearish reversal** and look for short entry points.
#### 4. **VWAP Crossovers**:
- **Bullish Crossover**: When the price crosses above the VWAP from below, it can be a sign that buying momentum is building, and traders may use this as a **buy signal**.
- **Bearish Crossover**: When the price crosses below the VWAP from above, it can signal that selling pressure is increasing, and traders may interpret it as a **sell signal**.
#### 5. **VWAP and Volume**:
- VWAP works well in conjunction with **volume analysis**. High volume during a price move above the VWAP suggests strong buying interest and can confirm the strength of the trend.
- Low volume while the price is near the VWAP can indicate lack of conviction, suggesting that the price may stay near VWAP or move sideways until stronger volume emerges.
### Advantages of VWAP Strategy:
1. **Helps Identify Trend Strength**: VWAP allows traders to determine whether the market is trending up or down and helps confirm whether the trend has strength based on price relative to VWAP.
2. **Good for Intraday Trading**: VWAP is especially useful for **day traders**, as it gives real-time information on the average price level for the day, helping them make decisions based on the broader market's movement.
3. **Provides Context for Entry and Exit Points**: VWAP helps traders decide when to enter or exit trades. Prices near or at VWAP can present buying or selling opportunities, depending on the broader trend.
4. **Objective Indicator**: Since VWAP is calculated objectively based on price and volume, it removes emotion from the trading decision and provides clear signals that traders can rely on.
### Disadvantages of VWAP Strategy:
1. **Lagging Indicator**: Since VWAP uses past price and volume data, it can be a **lagging indicator**, meaning it reacts to price movements rather than predicting them. As a result, it might be slower to react to fast-changing market conditions.
2. **Not Suitable for Long-Term Trading**: VWAP is best suited for **intraday trading** or short-term trades, as it resets at the beginning of each trading day. It is not ideal for swing traders or long-term investors.
3. **Whipsaw in Choppy Markets**: In volatile or sideways markets, VWAP can produce false signals. For example, if the price is bouncing around the VWAP in a range-bound market, it might generate many false breakouts or crossovers that lead to losses.
4. **Requires Other Indicators**: While VWAP can provide valuable signals, it is often more effective when used in combination with other indicators, such as **RSI**, **MACD**, or **Moving Averages**, to confirm trends and signals.
### Practical Example of VWAP Strategy:
Let's say you're trading a stock during the day, and the price has been trending **above the VWAP** for most of the morning, indicating a bullish sentiment. You then notice that the stock experiences a pullback towards the VWAP, but instead of falling below it, the price holds steady or bounces back higher, signaling continued bullish momentum.
In this scenario, you might:
- **Buy the stock near the VWAP** as the pullback to VWAP is acting as support.
- **Set a stop-loss just below the VWAP** to protect against a reversal in case the price fails to hold above it.
- **Target a price level above the VWAP**, following the continuation of the bullish trend.
If the price moves **below VWAP**, this could be a signal to **exit the trade** or even **short the stock** (if you trade in a downtrend), depending on your strategy and risk tolerance.
### Conclusion:
The **VWAP strategy** is a highly effective tool for intraday traders to identify the direction of the market and spot entry and exit points based on the volume-weighted average price. It works best when used as part of a broader strategy, incorporating trend-following principles and confirming signals from other indicators. However, traders must be cautious of its lagging nature and adapt the strategy to the prevailing market conditions, especially in volatile or range-bound markets.

Axis Bank Gap Fill, Long SetupAxis Bank is giving a breakout on hourly chart
Can very likely move towards 1030/1050 and fill the upside gap

Axisbank for InradayAs per price action we can see a bounce till 1010 to 1020 levels and from their we can see a fall till 980 to 970 on intraday basis just a view not a reco...

Why risk managment is important in trading ?**Risk management** is one of the most crucial aspects of trading, and it can be the difference between long-term success and failure. While making profits is important, **protecting your capital** and **minimizing losses** is essential to ensure you stay in the game and can continue to trade. Here's why risk management is so important in trading:
### 1. **Preserving Capital**
Capital is your most valuable asset in trading. Without it, you can’t take advantage of future opportunities. Risk management helps protect your capital from significant losses, ensuring you can survive through rough patches and continue to trade. If you don’t manage risk, a single large loss can wipe out a significant portion of your account, which can be very difficult to recover from.
- **Risk of Ruin**: Without proper risk management, the chances of losing your entire trading account become much higher. A series of big losses can erode your capital and make it impossible to recover without taking undue risk.
### 2. **Limiting Losses**
Every trader experiences losing trades. However, with effective risk management, you can limit the amount you lose on each trade, preventing small losses from snowballing into larger ones.
- **Stop-Loss Orders**: One of the simplest and most important risk management tools is the **stop-loss order**, which automatically exits a trade if the price moves against you beyond a certain level. This ensures that you don’t lose more than you're willing to on a single trade.
- **Position Sizing**: By adjusting the size of your positions based on the risk you're willing to take, you ensure that no single loss has a devastating impact on your overall portfolio.
### 3. **Mitigating Emotional Stress**
Trading can be emotionally stressful, especially during periods of high volatility or when facing a losing streak. If you don't manage your risk properly, emotional trading becomes much more likely, which often leads to poor decision-making. Fear and greed can cloud your judgment, making you take on larger risks to recover losses or take unnecessary trades to chase profits.
- **Consistency**: A solid risk management plan helps you stay consistent, reducing emotional reactions to market fluctuations. It allows you to trade with a clear strategy, even during tough times, and helps you stick to your plan instead of making impulsive decisions.
### 4. **Ensuring Longevity in the Market**
Trading is not about winning every single trade; it's about **surviving long enough to see your strategy succeed**. If you take excessive risks and don't manage your losses, your chances of blowing up your account increase, and you’ll be out of the game prematurely.
- **Sustainable Growth**: By managing risk effectively, you can keep your account growing steadily over time without exposing yourself to the danger of large, devastating losses. This is how traders grow their wealth in the long run, rather than trying to make quick, unsustainable profits.
### 5. **Enhancing Risk/Reward Ratio**
Risk management allows you to improve your **risk/reward ratio**—a critical element of profitable trading. By controlling how much you're willing to risk on each trade and defining potential profit targets, you can set up trades where the rewards are much higher than the risks.
- **Risk/Reward Ratio**: For example, a **1:3 risk/reward ratio** means that you're willing to risk $1 to potentially gain $3. This allows you to be right on fewer trades and still make a profit overall, as your profits from winning trades outweigh your losses on the losing trades.
### 6. **Reducing the Impact of Drawdowns**
A **drawdown** is when your account balance decreases after a series of losing trades. Without proper risk management, a series of drawdowns can significantly reduce your account balance, sometimes beyond recovery.
- **Drawdown Control**: By limiting the amount you risk per trade, you reduce the size of drawdowns, which helps maintain account health even during losing streaks. A smaller drawdown means you can recover more quickly from losses, making it easier to bounce back.
### 7. **Helps with Strategy Testing**
Risk management allows you to test your trading strategy over time without significant consequences. By risking small portions of your capital and sticking to predefined rules, you can evaluate whether your strategy is sound over the long term, instead of making large bets based on emotions or impatience.
- **Backtesting and Simulation**: When you use risk management techniques, you can backtest your strategy on historical data or trade on demo accounts to refine your approach without putting your real money at risk. This gives you confidence in your system and helps you avoid costly mistakes when trading live.
### 8. **Protects Against Unexpected Market Moves**
The market is unpredictable. Even with the best analysis and research, there will be times when the market behaves in unexpected ways—such as a sudden economic event, news release, or geopolitical event—that could cause large price movements. Risk management helps protect you from these unpredictable situations.
- **Volatility**: By adjusting your position size and using stop-losses, you can protect yourself from sharp moves in the market, which can sometimes happen without warning.
### 9. **Improves Decision-Making**
Risk management takes some of the emotional burden off your shoulders, helping you make decisions based on logic and your trading plan, rather than impulsive reactions to the market. It allows you to set clear goals and limits, making your approach more structured and less emotional.
- **Plan Your Trade and Trade Your Plan**: By setting a maximum loss per trade and adhering to your plan, you avoid the trap of trying to "recover" a losing trade or overtrading to make up for past mistakes.
### 10. **Enables Compound Growth**
With good risk management, you can let your capital grow over time through compounding. By consistently managing risk, minimizing losses, and letting profits grow, you are more likely to accumulate wealth over the long run.
- **Long-Term Focus**: Compounding works in your favor when you preserve your capital. The more consistent you are with risk management, the more likely you'll see steady growth in your portfolio, as you’re able to take advantage of long-term trends.
---
### Key Risk Management Techniques:
1. **Stop-Loss Orders**: Define your maximum loss per trade and automatically exit if the price moves against you beyond that level.
2. **Position Sizing**: Control how much you risk on each trade based on your overall capital. The general rule is to risk **1-2%** of your trading account per trade.
3. **Risk/Reward Ratio**: Ensure the potential reward of a trade outweighs the risk. A common risk/reward ratio is **1:3** or higher.
4. **Diversification**: Spread your risk across different assets or markets to reduce the impact of a single loss.
5. **Trailing Stop-Losses**: Allow profits to run by moving your stop-loss along with the market price, locking in profits as the price moves in your favor.
6. **Risk Limits**: Set daily, weekly, or monthly risk limits to ensure that you don’t exceed your risk tolerance.
---
### Conclusion:
In trading, **risk management** is critical for ensuring longevity, preserving capital, and managing emotional stress. By controlling your risk, you can **protect your account from large losses**, **stay consistent in your approach**, and **capitalize on long-term trends**. Remember, trading isn't just about making profits—it's about staying in the game long enough to see the profitable opportunities and knowing how to manage risk to weather the ups and downs of the market.

How to use indicators in trading ?Indicators do not specifically provide any buy and sell signals; a trader must interpret the signals to determine trade entry and exit points that conform to his or her own unique trading style. Several different types of indicators exist, including those that interpret trend, momentum, volatility, and volume.
Traders will plot a MACD line on a chart. This is the distance between two moving averages. A signal line, which is the moving average of the MACD line, is then added to the mix. If the MACD line cuts through the signal line from below, it can be used as a buy signal.
The strategy is named after its three key components: 5 (five currency pairs to focus on), 3 (only three trading strategies), and 1 (pick one time to trade). The main goal of this forex algo trading strategy is to maintain consistency, minimize risks, and maximize the traders' overall returns.

Axis Bank - Tough times aheadRecently stock managed to breach the yearly low of around 994 and went downhill upto 933
We saw some buying from the same areas as it had monthly n weekly demand zones
With that stock managed to pull itself back to 1k+ levels
But it seems struggling days are not yet over for axis
As we can clearly see, stock has got multiple and strong resistance point on daily time frame
1st starts immediately as a gap resistance zone between 1015 to 1030
2nd area at 1035 to 45
3rd at 1050 to 60
4th at 1085 to 95
5th from 1105 to 1120
Stock may or will try to reverse from these points in coming days
Alerts can be set accordingly
Lower TF confirmation is a must before entering
R:R on each level is excellent
Trade accordingly and cautiously

Axis Bank Outlook For SwingHello friends hope you all are doing well and trading well, so let's talk about the weekly chart of Axis Bank today which is not a trading idea but if you want to take a trade in it then maybe you can get some help from the view I am sharing.
So first of all I would like to tell you that in the last working day we saw a big fall in the share price due to the quarterly results presented by the company but if we talk about the technical setup here then as you can see that the price has almost come to the demand zone so in such a situation we can expect a bounce from here and for this we all should follow our respective time frames and our respective setups. I have also plotted Fibonacci retracement and 200 day moving average on this chart which is an important level supporting the support zone, both are free indicators provided by Tradingview you can use in your trades too.
If there is confirmation of bounce on any setup then we can keep a target of 10 to 15 percent for this bounce and can also set our stop loss accordingly. So I will share my trade active target and stop loss in the next update.
Best Regards- Amit.

Axis Bank : Swing Trade Pick#axisbank #swingtrade #momentumtrade #trendingstock
Axis Bank : Swing Trade
>> Low PE Stock
>> Banking Sector Theme, most likely to perform
>> Trending stock
>> Low Risk Trade
Swing Traders can lock profit at 10% and keep Trailing
Please Boost, comment and follow us for more Learnings.
Note : Markets are still Tricky and can go either ways so don't be over aggressive while choosing & planning your Trades, Calculate your Position sizing as per the Risk Reward you se and most importantly don't go all in
Disc : Charts shared are for learning purpose only, not a Trade recommendation. Do your own research and consult your financial advisor before taking any position.

AxisbankI see this stock on very strong support zone on Daily time frame where we can see a big bounce in coming days and even marked resistance trendline which gives you an edge for entry and levels are marked on chart just a view not a Reco... even the correction very steep so expecting same wise rally. may be wrong too better enter in cash or options of FEb. Note: we do have an event of Feb02 Budget.

Axis bank - 30-01-2015Axis bank fundamentals look weak and is expected to correct more to s1, s2, s3 levels.
Long term hold suggestions.

Axis Bank On Daily Time Frame Bullish ViewAxis Bank Limited, established in 1993 as UTI Bank and rebranded in 2007, is India's third-largest private sector bank. Headquartered in Mumbai, Maharashtra, the bank offers a comprehensive range of financial services to diverse customer segments, including large and mid-sized corporates, small and medium-sized enterprises (SMEs), agriculture, and retail businesses. ( (www.axisbank.com))
**Key Financial Highlights:**
- **Revenue:** As of the fiscal year ending March 31, 2024, Axis Bank reported significant revenue growth, reflecting its strong market position.
- **Net Income:** The bank's net income for the same period demonstrated robust profitability, underscoring its effective financial strategies.
- **Total Assets:** Axis Bank's total assets have seen substantial growth, reinforcing its status as a leading financial institution in India.
**Branch Network and International Presence:**
As of September 2024, Axis Bank operates a vast network of 5,577 branches and extension counters, along with 16,026 ATMs and cash recyclers across India. The bank also has a significant international presence, with branches in Singapore, Hong Kong, Dubai (at the DIFC), Shanghai, and Colombo, as well as representative offices in Dhaka, Dubai, Sharjah, and Abu Dhabi. Additionally, Axis Bank has a wholly-owned subsidiary in the United Kingdom, Axis Bank UK Limited. ( (en.wikipedia.org))
**Services Offered:**
- **Retail Banking:** Axis Bank provides a wide array of services, including savings and current accounts, fixed deposits, loans (home, personal, auto), credit and debit cards, and digital banking solutions.
- **Corporate Banking:** The bank offers services such as corporate loans, trade finance, treasury services, and cash management solutions to large and mid-sized corporates.
- **SME Banking:** Customized financial products and services are available to meet the unique needs of small and medium-sized enterprises.
- **Agricultural Banking:** Axis Bank supports the agricultural sector with specialized products like Kisan Credit Cards, agricultural loans, and investment advisory services.
**Leadership:**
- **Chairman:** Shri Rakesh Makhija
- **Managing Director & CEO:** Amitabh Chaudhry
Under their leadership, Axis Bank has continued to strengthen its position in the banking sector. ( (en.wikipedia.org))
**Awards and Recognitions:**
Axis Bank has received numerous accolades, including:
- 'Bank of the Year in India' by The Banker Magazine, Financial Times
- 'Most Trusted Private Sector Bank' in the 'Most Trusted Brand Survey' conducted by Brand Equity, Economic Times
- 'Best Domestic Bank in India' by Asiamoney Best Banks
These awards highlight the bank's commitment to excellence in financial services. ( (www.axisbank.com))
With a strong legacy and a comprehensive suite of services, Axis Bank continues to play a pivotal role in India's banking industry, catering to the diverse financial needs of its customers.

25/01/2025 AXISBANK BREKDOWN SUPPORTAxisbank Brekdwon his last 2 year ago support line. Next Strong support for Axisbank 815.
Axisbank berish trand in this time ,This trend to be contine as my prediction .

Axis Bank & HDFC Mein Same Circumstance Watch Carefully ! Axis Bank Limited, established in 1993 as UTI Bank and rebranded in 2007, is India's third-largest private sector bank. Headquartered in Mumbai, Maharashtra, the bank offers a comprehensive range of financial services to diverse customer segments, including large and mid-sized corporates, small and medium-sized enterprises (SMEs), agriculture, and retail businesses. ( (www.axisbank.com))
**Key Financial Highlights:**
- **Revenue:** As of the fiscal year ending March 31, 2024, Axis Bank reported significant revenue growth, reflecting its strong market position.
- **Net Income:** The bank's net income for the same period demonstrated robust profitability, underscoring its effective financial strategies.
- **Total Assets:** Axis Bank's total assets have seen substantial growth, reinforcing its status as a leading financial institution in India.
**Branch Network and International Presence:**
As of September 2024, Axis Bank operates a vast network of 5,577 branches and extension counters, along with 16,026 ATMs and cash recyclers across India. The bank also has a significant international presence, with branches in Singapore, Hong Kong, Dubai (at the DIFC), Shanghai, and Colombo, as well as representative offices in Dhaka, Dubai, Sharjah, and Abu Dhabi. Additionally, Axis Bank has a wholly-owned subsidiary in the United Kingdom, Axis Bank UK Limited. ( (en.wikipedia.org))
**Services Offered:**
- **Retail Banking:** Axis Bank provides a wide array of services, including savings and current accounts, fixed deposits, loans (home, personal, auto), credit and debit cards, and digital banking solutions.
- **Corporate Banking:** The bank offers services such as corporate loans, trade finance, treasury services, and cash management solutions to large and mid-sized corporates.
- **SME Banking:** Customized financial products and services are available to meet the unique needs of small and medium-sized enterprises.
- **Agricultural Banking:** Axis Bank supports the agricultural sector with specialized products like Kisan Credit Cards, agricultural loans, and investment advisory services.
**Leadership:**
- **Chairman:** Shri Rakesh Makhija
- **Managing Director & CEO:** Amitabh Chaudhry
Under their leadership, Axis Bank has continued to strengthen its position in the banking sector. ( (en.wikipedia.org))
**Awards and Recognitions:**
Axis Bank has received numerous accolades, including:
- 'Bank of the Year in India' by The Banker Magazine, Financial Times
- 'Most Trusted Private Sector Bank' in the 'Most Trusted Brand Survey' conducted by Brand Equity, Economic Times
- 'Best Domestic Bank in India' by Asiamoney Best Banks
These awards highlight the bank's commitment to excellence in financial services. ( (www.axisbank.com))
With a strong legacy and a comprehensive suite of services, Axis Bank continues to play a pivotal role in India's banking industry, catering to the diverse financial needs of its customers.

Axis Bank - Bullish - Qularterly TimeframeGood time to buy Axis bank for 3-5 months.
Stock has entered the quarterly demand zone
Average more if it reaches the 860-880 Levels. Be Patient with it
First Signal of reversal would be close above 980 on weekly basis.
Targets 1143 & 1231 Book Profits
