Bajaj Finserv in a bullish trend; Watch and trade?Bajaj Finserv has been in a good trend even when overall market remained negative, the stock has been trading around the recent highs.
There has been a Break out of the resistance zone but the market has formed a Tweezer top after the break out on the weekly charts.
If there is trend reversal of the indices, high chance of it forming new high while be there.
YTD the stock has posted 17% positive returns while the markets are down by the approximately the same percentage.
Major Resistance levels :-1860-19410
Possible Target levels (as per fibonacci levels) :- 2304, 2771
This can be the stock of the year. 20-40% return can be captured as per the holding capacity. Keep strict SL
Wait for the price action and trade as per the trading plan/setup.
BAJAJ FINSERV LTD.
1,985.80INRR
−46.50−2.29%
At close at Jul 25, 10:27 GMT
INR
No trades
BAJAJFINSV trade ideas

I Learned Something From This Chart !Hello fellow traders I hope you all are doing well so as we can see the market is not supporting any long position at the moment but the chart of Bajaj Finserv looks very attractive however I am not creating any trading position in it because the company is going to give it's financial figures tomorrow and it can be harmful for my trading position so all of you please also read this idea only for learning.
So through this chart we can learn that when price breaks 200 moving average, then a good fall or a good upside move comes. One pattern is formed which we call double bottom in which price after going above the swing low again comes near the old swing low and forms a double bottom and from where the price has come back is called the pattern neckline. Apart from this I have plotted a resistance zone where price took support for the first few days and later it became a resistance zone. This thing reminded me again about the theory of support and resistance.
So as I have told you, I will not create any trading position because tomorrow its financial result is due and that can harm my long position. But even if a long position is created after this resistance zone breakout then I will keep my target on the old swing high or all time low which was recently created by the stock a few days ago which was around 2000 keep that as my target and will keep my stop loss below the moving average of 200 days. If we look at the risk to reward then it is 1:2 risk reward ratio which is fine considering the current market perspective. I will not give any update for this idea because I am sharing this idea only for learning purpose. It does not seem to be a proper educational publication therefore i am not adding educational flag but adding long flag beacuse that is my current view.
I hope you like my work, Thanks in advance.
Best regards- Amit.

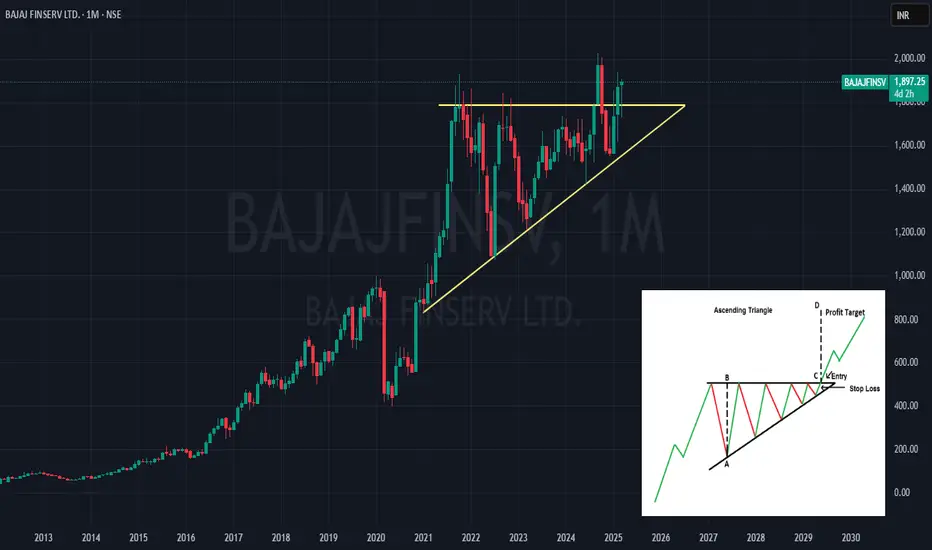
Bajaj Finserv (BAJAJFINSV) forming an Ascending Triangle patternBajaj Finserv's stock is currently forming an Ascending Triangle pattern, which is often considered a bullish continuation pattern. This marks the second time the stock has broken above its September 2021 highs. The first attempt occurred in September 2024, but it failed to maintain momentum above that level and eventually found support within its channel. However, in February 2025, the stock successfully broke through the resistance and closed above it, which had previously acted as a strong resistance level.
This breakout could signal potential bullish momentum.
Bajaj Finserv Ltd. chart analysis
The chart of Bajaj Finserv Ltd. (NSE) on a Daily frame, showing price movement, volume, and two key indicators – MACD (Moving Average Convergence Divergence) and RSI (Relative Strength Index). It highlights price divergences, key support and resistance zones, and a potential bullish reversal.
---
🔍 Key Chart Feature and Pattern Observation:
1️⃣ Support & Resistance:
- Support: ₹1,523.25 (blue horizontal line).
- Resistance: ₹1,700.65 (magenta horizontal line).
2️⃣ Bullish & Bearish Divergence:
- Bearish Divergence: Observed on the MACD during the price rise in August-September.
- Bullish Divergence: Observed in December, indicating a potential trend reversal.
3️⃣ Volume Spike:
- A significant volume increase during the recent price surge suggests strong buying interest.
4️⃣ Price Action:
- The price has bounced off the support zone and is approaching the resistance zone.
---
📈 Indicator Analysis:
1️⃣ MACD:
- Bearish Divergence: Previously indicated weakness, leading to a downtrend.
- Bullish Divergence: Recently formed, suggesting potential upward momentum.
- The MACD histogram has turned green, indicating positive momentum.
2️⃣ RSI:
- RSI is currently at 33, suggesting it is recovering from an oversold zone.
- A rising RSI supports the bullish sentiment.
3️⃣ Volume:
- A spike in volume during the upward price movement signals buying strength.
---
📌 Key Levels or Price Levels:
- Support: ₹1,523.25
- Resistance: ₹1,700.65
- Intermediate Resistance: ₹1,690.50
---
📊 Overall Summary:
- The chart indicates a potential bullish reversal supported by a bullish divergence in MACD and rising RSI.
- The recent price surge, accompanied by high volume, suggests strong buying interest.
- If the price sustains above ₹1,690.50, it could break through the resistance at ₹1,700.65.
---
📚 Trading Strategy:
1️⃣ For Long Entry:
- Enter near ₹1,562.05 with a stop-loss at ₹1,523.25.
- Target price: ₹1,700.65
2️⃣ For Short Entry:
- If the price fails to break ₹1,690.50, consider shorting with a stop-loss at ₹1,700.65.
3️⃣ Confirmation Point:
- Wait for confirmation with price action or candlestick patterns near key levels.
---
✅ Conclusion:
The chart signals a bullish reversal with confirmation from the MACD bullish divergence and improving RSI levels. Traders can look for buying opportunities near support levels with proper risk management. A breakout above ₹1,700.65 will strengthen the bullish momentum further. 🚀

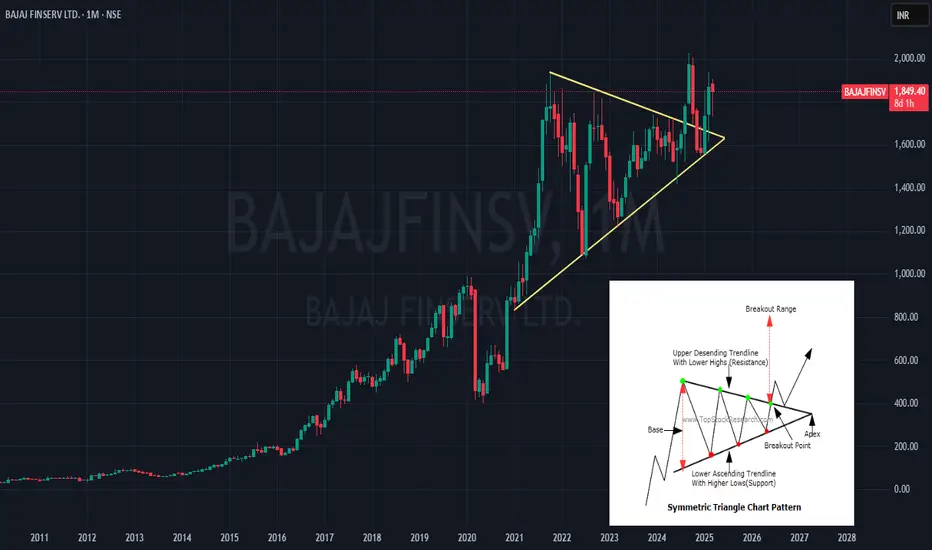
Bajaj Finserv (BAJAJFINSV) – Symmetrical Triangle BreakoutBajaj Finserv has formed a symmetrical triangle pattern on the monthly time frame, indicating a potential strong breakout. This pattern is often seen as a sign of consolidation, and with the recent breakout, it could lead to significant price movement.
Bajaj Finserv LtdBajaj Finserv Ltd. is the holding company for the various financial services businesses under the Bajaj group.
Platforms
1 Bajaj Finserv Direct Limited - Digital Marketplace & Technology Services
2 Bajaj Finserv Health Limited - Health-tech Platform
3 Bajaj Financial Securities Limited - Digital Stockbroker
I will wait for a breakout retest so the price when reached a support zone after a massive fall. So now from here I will wait for a bounce if a fresh long entry near 1600 INR.

An opportunity to book profitsBajaj Finserv CMP 1872
V shaped pattern- this is a directional signal and hence this rally is an opportunity to exit.
RSI - the stock has nearly reached its previous highs which means strong resistance and RSI has just reached its bear zone and also below its averages. This is very negative.
Elliott- This is the zig zag corrective pattern. To me the devastating C wave should start now.
Conclusion - these negative indication on higher time frame charts is very negative. It just shows that the longer term trend could be in danger. So best is to book profits.


#BAJAJFINSVFundamentals:
* ROCE - 11.7%, ROE - 15.3%. Debt to Equity - 4.66 (Financial companies have higher debt considering debt is their inventory)
* EPS / Revenue - has been steadily increasing
* FIIs - Have reduced stake this quarter which has been picked up by DIIs and MFs
* Retail holding levels have gone down
* Promoter holding has remained steady
* Please note, the ROCE/ROE is not that great but this stock is a decent performer and tends to grow
Technicals:
* Cup and Handle in a larger consolidation phase which can lead to Phase 2
* Price is surfing the 10 DMA
* RS is strong / Momentum is picking up
* ADR is below 4 which can make this a slow moving stock
* On weekly chart, the price is extended beyond its 10 WEMA hence a cautious exposure is advised
* Price breached the 61.8% Fibo levels with strong volume and now retesting
* Low risk entry possible
Note - Entry / SL / Target / Position size - Please figure out on your own based on risk appetite
Disclaimer - Your money requires your due diligence! I merely analyze and bring out probabilities. All the best.

What is momentum trading and how it is useful ?**Momentum trading** is a popular trading strategy that aims to capitalize on the continuation of existing market trends. The idea behind momentum trading is that assets that have been rising in price will continue to rise, and those that have been falling will continue to fall, at least in the short-term. This strategy relies on the observation that "trends tend to persist" and that price momentum often builds on itself.
### **Key Concepts of Momentum Trading**
1. **Momentum**: This refers to the speed or rate at which the price of an asset is moving in a particular direction (up or down). Momentum traders focus on identifying and riding these trends.
2. **Buy on Strength, Sell on Weakness**: Momentum traders look to buy stocks (or other assets) that are showing strength, meaning they're rising in price, and sell (or short) stocks that are weakening and falling.
3. **Trend Following**: Momentum trading is a **trend-following strategy**, which means it focuses on entering trades in the direction of the prevailing trend, rather than trying to predict reversals or turns in the market.
### **How Momentum Trading Works**
1. **Identifying Momentum**:
Momentum traders typically use technical indicators to identify trends and potential entry points. Some common momentum indicators include:
- **Moving Averages**: Short-term moving averages crossing above longer-term moving averages can signal upward momentum (e.g., the **50-day moving average crossing the 200-day moving average**, known as the **Golden Cross**).
- **Relative Strength Index (RSI)**: RSI is used to measure the speed and change of price movements. An RSI above 70 suggests overbought conditions, while an RSI below 30 suggests oversold conditions.
- **Moving Average Convergence Divergence (MACD)**: MACD helps identify momentum shifts by comparing the difference between short-term and long-term moving averages.
- **Bollinger Bands**: These bands help identify periods of high or low volatility, which can indicate strong momentum when the price breaks through the upper or lower bands.
2. **Entry Points**:
- **Breakouts**: Momentum traders often enter positions when a stock breaks above a resistance level (for long trades) or falls below a support level (for short trades).
- **Continuation Patterns**: Traders look for chart patterns such as **flags**, **pennants**, **triangles**, and **rectangles** that indicate a trend continuation.
3. **Exit Points**:
- Momentum traders will typically exit a position when the trend shows signs of weakening or reversing. This could be indicated by technical signals like a **moving average crossover in the opposite direction** or a **stochastic oscillator** indicating overbought/oversold conditions.
- Some traders will also set predefined **stop-loss** orders to protect against unexpected reversals.
### **Momentum Trading Strategies**
1. **Trend Continuation**:
This strategy assumes that if an asset is trending upward, it will continue to do so, and vice versa. Traders identify trends using indicators like moving averages, RSI, or MACD, and enter positions in the direction of the trend.
2. **Breakout Momentum**:
Traders enter positions when a stock breaks out of a defined price range or chart pattern (such as a triangle or flag). They anticipate that the breakout will lead to continued momentum in the direction of the breakout.
3. **Gap Trading**:
Gaps occur when the price of an asset opens significantly higher or lower than the previous day’s closing price. Momentum traders may take advantage of these gaps, expecting the momentum to carry the price in the direction of the gap.
4. **Mean Reversion (Inverse Momentum)**:
While not strictly a momentum trading strategy, some traders use mean reversion techniques that work opposite of momentum trading, betting that strong moves (both up or down) will eventually correct themselves. They may enter trades when they believe an overbought or oversold condition will reverse.
### **Benefits of Momentum Trading**
1. **Profit from Trends**:
Momentum trading allows traders to profit from strong trends, which can lead to significant returns if the trend is sustained. The strategy works well in markets that are trending in one direction for a prolonged period.
2. **Short-Term Profit Potential**:
Since momentum trading typically involves short-term trades, it offers the opportunity for quick profits. This appeals to active traders who want to take advantage of market inefficiencies on a shorter time scale.
3. **Clear Entry and Exit Signals**:
Momentum trading strategies often rely on technical indicators, which can provide clear and objective entry and exit signals, helping traders manage their trades effectively.
4. **Capitalizes on Volatility**:
Momentum trading thrives in volatile markets, where price movements are more pronounced. Traders can capture larger moves in a shorter amount of time.
### **Risks of Momentum Trading**
1. **Risk of Reversals**:
Momentum trading relies on the assumption that trends will continue, but markets can reverse suddenly. If the trend changes, momentum traders can incur significant losses, especially if they do not use stop-loss orders effectively.
2. **Choppy Markets**:
Momentum trading tends to underperform in choppy, sideways, or range-bound markets. If a market lacks a clear trend, it becomes difficult to identify valid momentum plays.
3. **Overtrading**:
Because momentum traders often look for quick profits and act on short-term trends, there’s a risk of overtrading—taking too many positions in quick succession without proper risk management.
4. **High Transaction Costs**:
Given that momentum trading involves frequent entry and exit points, it can incur higher transaction costs, including commissions and spreads, which can erode profits, especially in lower-margin trades.
### **Momentum Trading vs. Other Strategies**
- **Momentum vs. Value Investing**:
- **Value Investing** focuses on buying undervalued assets and holding them long-term, while **momentum trading** involves buying stocks that are already on an uptrend, hoping that the trend continues.
- Momentum traders rely on technical indicators and trends, whereas value investors analyze the fundamental aspects of a company.
- **Momentum vs. Swing Trading**:
- **Swing Trading** involves capturing short- to medium-term price swings, usually over several days or weeks, while momentum trading focuses on taking advantage of strong trends that are likely to continue over shorter time frames.
- Momentum traders may hold their positions for a few hours or days, while swing traders may hold their positions longer.
### **How to Get Started with Momentum Trading**
1. **Understand the Key Indicators**: Learn how to use popular momentum indicators like RSI, MACD, and moving averages. These will help you spot trends and identify potential trades.
2. **Backtest Your Strategy**: Before diving into live trading, backtest your momentum strategy using historical data to see how well it would have performed in different market conditions.
3. **Risk Management**: Always use stop-loss orders and define your position size to ensure you're not risking too much on a single trade. Consider the **risk-to-reward ratio** and stick to a trading plan.
4. **Follow the Market News**: Keep an eye on news events that could drive momentum in the market (earnings reports, economic releases, or major geopolitical events).
5. **Paper Trading**: Practice momentum trading on a demo or paper trading account to get a feel for how the strategy works without risking real money.
### **Conclusion**
Momentum trading is a dynamic and potentially profitable strategy that aims to capitalize on the continuation of price trends. By focusing on assets that are moving in a particular direction, momentum traders can generate returns in trending markets. However, it requires good timing, risk management, and a deep understanding of technical analysis. Like all strategies, it is important to backtest and practice to hone your skills and manage risks effectively.

Bajaj Finserv cmp 189.25 by Weekly Chart viewKeep the stock on radar for probable New ATH creation basis a good Technical Chart Setup
Bajaj Finserv cmp 189.25 by Weekly Chart view
- Old time Support Zone 1520 to 1560 Price Band
- Stock Price is attempting to keep above the Falling Resistance Trendline
- Stock Price seems to be traversing along both the Rising Support Trendlines
- Technical Indicators seem trending positively for the likes of EMA, MACD and RSI
- Volumes seen going in sync with avg traded quantity and attempting to stay above it
- Weekly Support seen at 1726 > 1520 > 1375 with the Resistance seen only at the ATH 2029.90


Bajaj FinServ cmp 1791.00 by Weekly Chart viewKeep stock on radar for a very captivating Technical Chart setup for New Lifetime High Milestone creation
Bajaj FinServ cmp 1791.00 by Weekly Chart view
- Triangle Breakout Completed
- Volumes seem stable and inching to cross avg traded quantity
- Weekly Support at 1680 > 1450 > 1220 Resistance seen at 1900 > ATH 2029.90
- *Repeat Bullish Head & Shoulders, Rounding Bottoms appear inside the slightly sliding Ascending Triangle pattern*


Bajaj Finserv: Is a Major Move Coming?Introduction:
Bajaj Finserv Limited, a leader in India’s non-banking financial services and insurance sector, has consistently captured investor interest with its diversified offerings. From technical patterns signaling an impending move to its robust financial performance and macroeconomic tailwinds, this analysis provides a 360-degree perspective on the stock.
Technical Analysis:
The weekly price chart of Bajaj Finserv reveals significant levels and patterns:
1. Formation: Ascending Triangle and Support Trendline
• The stock is confined within an ascending triangle, respecting trendline supports.
• Key support levels include ₹1,458 (close to the 200-week EMA) and ₹1,607 (50-week EMA).
• Resistance lies near ₹1,800; a breakout could lead to a rally toward ₹2,000–₹2,200.
2. Moving Averages: Support Zones
• 200-Week EMA (₹1,458): Indicates strong long-term support.
• 50-Week EMA (₹1,607): A pivot for medium-term trends.
3. Fibonacci Retracement Levels:
Based on the price move from ₹900 to ₹1,750 in 2022, a 38.2% retracement around ₹1,480 has acted as a strong demand zone.
4. Volume Patterns:
Spikes in buying volume near ₹1,450–₹1,600 zones signal strong institutional support.
Bullish Triggers:
• Sustained breakout above ₹1,800 can lead to potential targets of ₹2,200–₹2,500.
Bearish Risks:
• Breach of the ₹1,458 support could take the stock toward ₹1,300, intensifying selling pressure.
Fundamental Analysis:
1. Revenue and Profit Performance:
• Bajaj Finserv reported total revenue growth of 18% YoY in Q2 FY2025, reaching ₹17,920 crore, driven by its lending and insurance verticals.
• Consolidated net profit grew by 25%, touching ₹1,800 crore, indicating robust profitability across segments.
2. Business Segments:
• Bajaj Finance: Delivered exceptional growth, aided by higher loan disbursements in retail and SME sectors.
• Insurance Businesses: Recorded a growth of 30% in Gross Written Premium (GWP) YoY in both life and general insurance.
3. Key Metrics (Q2 FY2025):
• EPS (Earnings Per Share): ₹50.85, growing 23% YoY.
• GNPA (Gross Non-Performing Assets): Stable at 1.12%, showcasing asset quality strength.
• ROE: ~16.8%, reflecting superior capital efficiency.
4. Financial Ratios Comparison:
Metric Bajaj Finserv Industry Average
P/E Ratio ~30x ~28x
Price-to-Book (P/B) ~4.2x ~3.5x
Dividend Yield ~0.24% ~0.60%
Market News and Developments:
1. Positive Catalysts:
• Bajaj Finserv’s proposed asset management business (AMC) is set to boost diversification. Regulatory approvals are awaited, but investor confidence remains high.
• Digitalization Strategy: Over 70% of customer acquisition in FY2025 came from digital platforms, solidifying its position in fintech.
• Insurance Growth Potential: Rising insurance penetration and expanding middle-class demographics in India.
2. Challenges to Watch Out For:
• Global Headwinds: The possibility of slower global economic growth in 2025 could affect financial markets and investment income.
• Rising Competition: Increased competition in the NBFC space might impact margins.
Bullish and Bearish Scenarios:
Bullish Case (Targets: ₹2,200–₹2,500):
1. Sustained breakout above ₹1,800 with strong volume confirmation.
2. Continued growth momentum in revenue and profitability, coupled with positive macroeconomic support like a potential rate cut by the RBI.
Bearish Case (Risk: ₹1,300 or lower):
1. Break below ₹1,458 could intensify selling and lead the stock to revisit its June 2022 lows.
2. Unanticipated macro events, like regulatory actions or NPAs rising above expectations, could derail long-term bullish sentiment.
Investment Outlook:
Bajaj Finserv combines growth in lending, insurance, and soon-to-be asset management operations. From a technical standpoint, the current price level offers a pivotal moment for traders. Fundamentally, it remains one of the stronger NBFC players in the sector, backed by operational stability and a growing customer base.
Disclaimer:
The analysis provided is for informational and educational purposes only. It does not constitute financial advice, a recommendation, or an endorsement of any specific investment or strategy. Consult your financial advisor before making investment decisions. The author holds no responsibility for potential gains or losses incurred from your trades.

BAJAJFINSV Stock is trading near resistance level in daily
#BAJAJFINSV
Stock is trading near resistance level in daily timeframe.Can expect good upmove in coming days once resistance is broken and starts trading above it.Keep on Radar.
Disclaimer:-All views are my personal and only for educational purpose.
#StockMarketIndia
#LetsLearnTogether


Chart Analysis for Bajaj Finserv Ltd. (Weekly Timeframe)The stock is forming a bullish triangle pattern, a classic continuation pattern signaling potential upside. The price is respecting the ascending trendline, showing strong support near ₹1,700 levels, while the upper resistance line has been tested multiple times. This signifies increasing buyer strength.
Key Levels to Watch:
• Support: ₹1,698
• Resistance (Breakout Level): ₹2,050
• Target Price (Post Breakout): ₹2,336 (derived from the triangle’s height projection).
• Stop Loss: ₹1,515 (below the trendline support).
Short-Term Long Trade Setup
• Entry: Around ₹1,700, once the price shows bullish confirmation (e.g., reversal candlestick patterns or high volume).
• Target: ₹2,050 (short-term) and ₹2,336 (medium-term).
• Stop Loss: ₹1,515 to manage risk effectively.
Market Sentiment:
The stock shows a bullish structure, supported by prior consolidation and breakout potential. Patience is key for confirming a breakout above ₹2,050 before expecting the measured move towards ₹2,336.
DISCLAIMER- Please do your own research before investing in the market. This is for educational purposes only
