Balaji Amines – Chart Reversal Setup (Idea Only)This is not trading advice and I’m not a financial analyst — just sharing a chart observation.
On the monthly timeframe,
Balaji Amines appears to be forming a potential long‑term reversal:
- Price has corrected significantly from its highs
- A falling wedge structure is visible, often considered
Balaji Amines Limited
No trades
Next report date
—
Report period
—
EPS estimate
—
Revenue estimate
—
44.45 INR
1.58 B INR
13.91 B INR
10.50 M
About Balaji Amines Limited
Sector
Industry
CEO
Ram Reddy Dundurapu
Website
Headquarters
Hyderabad
Founded
1988
IPO date
May 31, 1995
Identifiers
2
ISIN INE050E01027
Balaji Amines Ltd. engages in the manufacture and sale of specialty chemicals, aliphatic amines, and derivatives. It operates through the following segments: Amines and Specialty Chemicals, Hotel, and CFL Lamps. The company was founded on October 27, 1988 and is headquartered in Hyderabad, India.
Related stocks

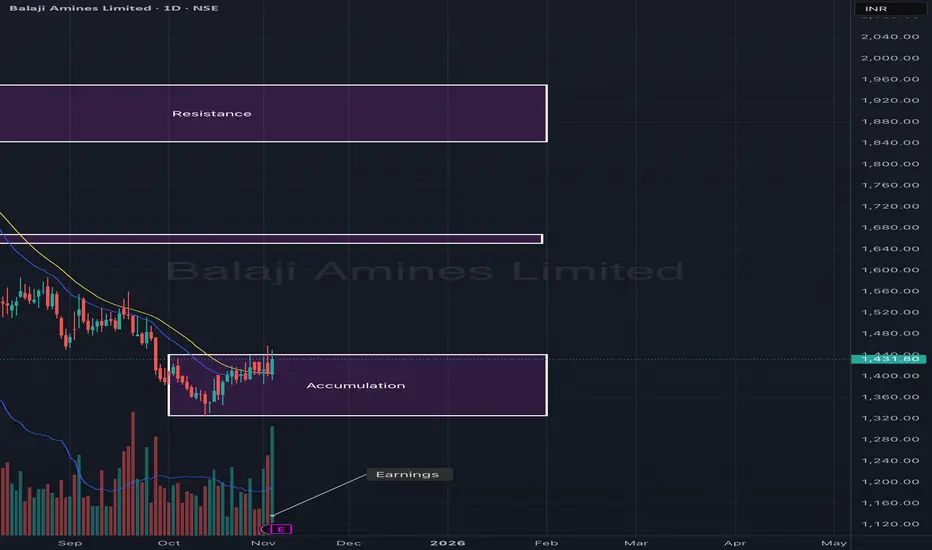
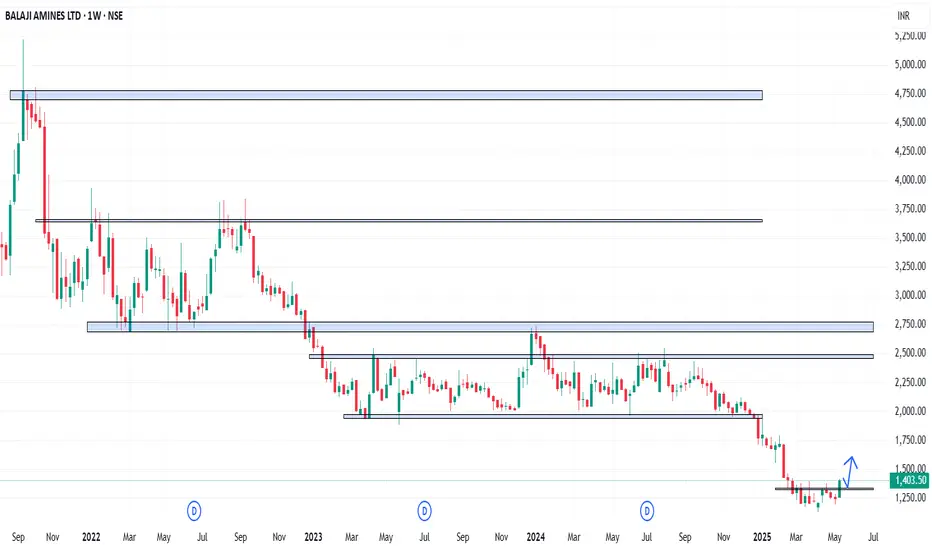
Balaji Amines Ltd – Accumulation Phase Before Potential UpsideBalaji Amines appears to be in a strong accumulation zone after an extended downtrend. The stock has been consolidating between ₹1,350–₹1,450, forming a solid base supported by stable volumes. A sustained move above this range could mark the beginning of a trend reversal and initiate a fresh leg tow
BALAMINES - Weekly AnalysisIn the Weekly Chart of BALAMINES ,
we can see that, it is at decision making point.
Possible momentums are shown in chart.

Balaji Amines LtdBalaji Amines is the stock which has created a very strong base and also if you can see in 1 hrs time frame volumes as squeezing and also this stock belong to chemical sector so we can see some strong momentum in this particular stock

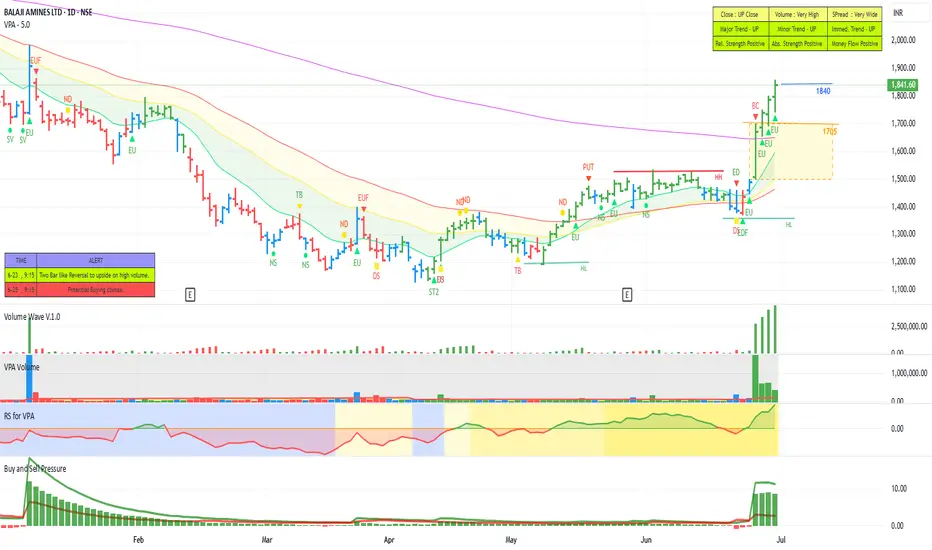
BALAJI AMINES - STEPPING INTO STAGE 2 ?The leading amine manufacturing company stocks had seen a huge down move of 50 to 60 percent. Of late many of these stocks have seen smart recovering. Leading stocks like alkyl amine, Vinati organics etc. crossed above the short-term moving averages. 200 DMA and moving up. Another stock in the group
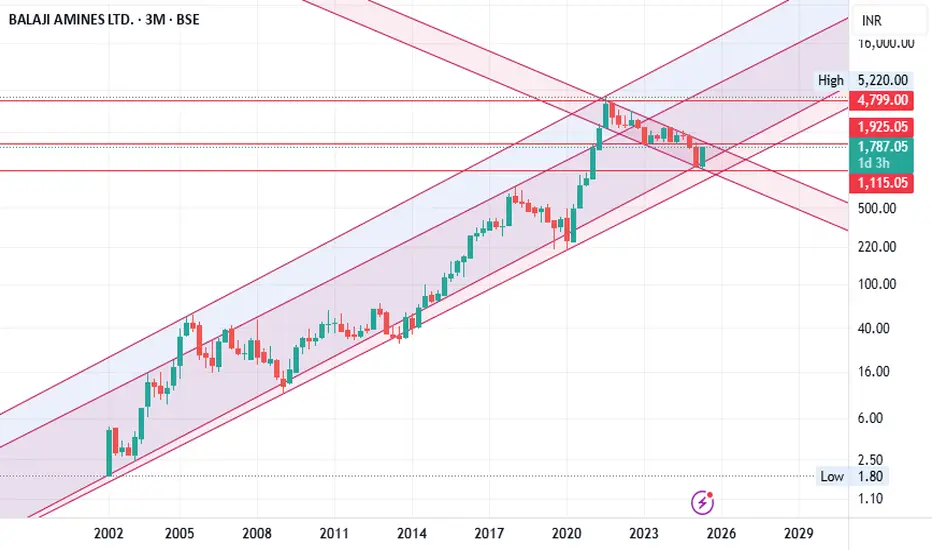
Balamines- History repeats itselfLong-Term Technical Analysis Summary
Trend: The price has been moving inside a strong upward-sloping parallel channel for over two decades.
Recent correction: After peaking in 2021, the stock corrected sharply and has now tested the lower boundary of the channel (support zone), bouncing from around
BALAJI AMINES all set to touch 1700CUP formation complete in W.
Good supports taken on MA
RSI divergence with strength.
Hoping to consolidate for few more day before the breakout.
SL:1390, TGT 1700,
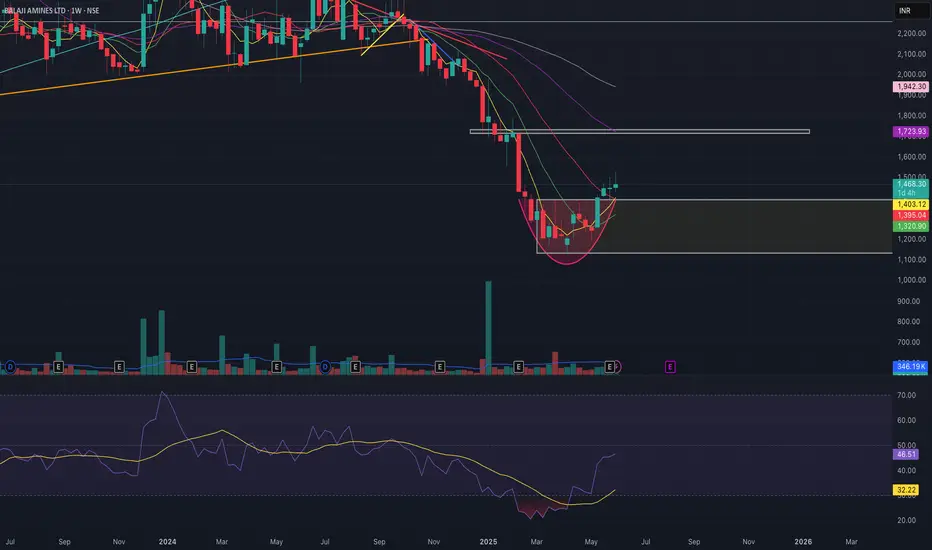
BALAMINES - Weekly AnalysisIn the Weekly Chart of BALAMINES ,
we can see that; it has shown W shape recovery with a strong Bullish Candle.
Let it create one or two Halt candles to get more strong momentum.
Expected momentum is shown in chart.
Potential upmove | Bottom fishing - BALAMINESThese analysis is based on bottom fishing method. Meaning that the stock shows an uprising potential from the bottom. Fundamentally it can be due to any major decisions in the management or tremendous performance shown or any such positive actions. Technically, it would have shown an upmove using MA


See all ideas
Summarizing what the indicators are suggesting.
Neutral
SellBuy
Strong sellStrong buy
Strong sellSellNeutralBuyStrong buy
Neutral
SellBuy
Strong sellStrong buy
Strong sellSellNeutralBuyStrong buy
Neutral
SellBuy
Strong sellStrong buy
Strong sellSellNeutralBuyStrong buy
An aggregate view of professional's ratings.
Neutral
SellBuy
Strong sellStrong buy
Strong sellSellNeutralBuyStrong buy
Neutral
SellBuy
Strong sellStrong buy
Strong sellSellNeutralBuyStrong buy
Neutral
SellBuy
Strong sellStrong buy
Strong sellSellNeutralBuyStrong buy
Displays a symbol's price movements over previous years to identify recurring trends.
Frequently Asked Questions
The current price of BALAMINES is 1,092.00 INR — it has decreased by −2.36% in the past 24 hours. Watch Balaji Amines Limited stock price performance more closely on the chart.
Depending on the exchange, the stock ticker may vary. For instance, on NSE exchange Balaji Amines Limited stocks are traded under the ticker BALAMINES.
BALAMINES stock has fallen by −2.34% compared to the previous week, the month change is a −10.90% fall, over the last year Balaji Amines Limited has showed a −27.98% decrease.
We've gathered analysts' opinions on Balaji Amines Limited future price: according to them, BALAMINES price has a max estimate of 1,561.00 INR and a min estimate of 1,334.00 INR. Watch BALAMINES chart and read a more detailed Balaji Amines Limited stock forecast: see what analysts think of Balaji Amines Limited and suggest that you do with its stocks.
BALAMINES reached its all-time high on Sep 15, 2021 with the price of 5,223.55 INR, and its all-time low was 9.25 INR and was reached on Feb 18, 2009. View more price dynamics on BALAMINES chart.
See other stocks reaching their highest and lowest prices.
See other stocks reaching their highest and lowest prices.
BALAMINES stock is 3.99% volatile and has beta coefficient of 1.83. Track Balaji Amines Limited stock price on the chart and check out the list of the most volatile stocks — is Balaji Amines Limited there?
Today Balaji Amines Limited has the market capitalization of 34.95 B, it has increased by 1.32% over the last week.
Yes, you can track Balaji Amines Limited financials in yearly and quarterly reports right on TradingView.
Balaji Amines Limited is going to release the next earnings report on May 13, 2026. Keep track of upcoming events with our Earnings Calendar.
BALAMINES net income for the last quarter is 314.33 M INR, while the quarter before that showed 345.59 M INR of net income which accounts for −9.05% change. Track more Balaji Amines Limited financial stats to get the full picture.
Yes, BALAMINES dividends are paid annually. The last dividend per share was 11.00 INR. As of today, Dividend Yield (TTM)% is 1.02%. Tracking Balaji Amines Limited dividends might help you take more informed decisions.
Balaji Amines Limited dividend yield was 0.91% in 2024, and payout ratio reached 22.63%. The year before the numbers were 0.54% and 17.40% correspondingly. See high-dividend stocks and find more opportunities for your portfolio.
As of Feb 16, 2026, the company has 1.17 K employees. See our rating of the largest employees — is Balaji Amines Limited on this list?
EBITDA measures a company's operating performance, its growth signifies an improvement in the efficiency of a company. Balaji Amines Limited EBITDA is 2.31 B INR, and current EBITDA margin is 16.96%. See more stats in Balaji Amines Limited financial statements.
Like other stocks, BALAMINES shares are traded on stock exchanges, e.g. Nasdaq, Nyse, Euronext, and the easiest way to buy them is through an online stock broker. To do this, you need to open an account and follow a broker's procedures, then start trading. You can trade Balaji Amines Limited stock right from TradingView charts — choose your broker and connect to your account.
Investing in stocks requires a comprehensive research: you should carefully study all the available data, e.g. company's financials, related news, and its technical analysis. So Balaji Amines Limited technincal analysis shows the sell today, and its 1 week rating is sell. Since market conditions are prone to changes, it's worth looking a bit further into the future — according to the 1 month rating Balaji Amines Limited stock shows the sell signal. See more of Balaji Amines Limited technicals for a more comprehensive analysis.
If you're still not sure, try looking for inspiration in our curated watchlists.
If you're still not sure, try looking for inspiration in our curated watchlists.