Balkrishna Industries LtdDate 16.08.2025
Balkrishna Industries
Timeframe : Day Chart
About
(1) Active in segments such as agricultural, construction and industrial as well as earthmoving, port and mining, ATV, and gardening applications
(2) The company has a 5-6% market share in the global specialty market
(3) It has a product range with more than 3,200 SKUs
(4) It enjoys “the Five Star Export House” status
(5) Also an Authorised Economic Operator (AEO) Tier III which helps in faster processing and clearance of cargo, deferred payment of duty, direct port delivery/entry, and other benefits
(6) The company primarily caters to more than 160 countries in the export markets
Sales Volume Mix
Customer Segment-Wise
(1) Agriculture: 59%
(2) OTR: 37%
(3) Others: 4%
* OTR - (Off-the-Road tyre)
Channel-Wise
(1) Replacement: 73%
(2) OEM: 25%
(3) Others: 2%
*(OEM-Original Equipment Manufacturer)
Geography-Wise
(1) Europe: 44%
(2) India: 29%
(3) Americas: 16%
(4) RoW: 11%
Clientele
JCB, Ferrari, Goldoni, Terex, John Deere, New Holland, Kubota, Greaves, Claas, etc
Valuations
(1) Market Cap = ₹ 46,390 Cr
(2) Stock P/E = 31.9
(3) Book Value = 4.5X
(4) ROCE = 16.7 %
(5) ROE = 15.8 %
(6) Operating Profit Margin = 22%
(7) Promoter Holding = 58%
(8) DII = 25%
(9) FII = 10%
(10) Sales Growth = 5.5%
Regards,
Ankur
Trade ideas

BALKRISIND – Zone Based Price Action Setup________________________________________________________________________________
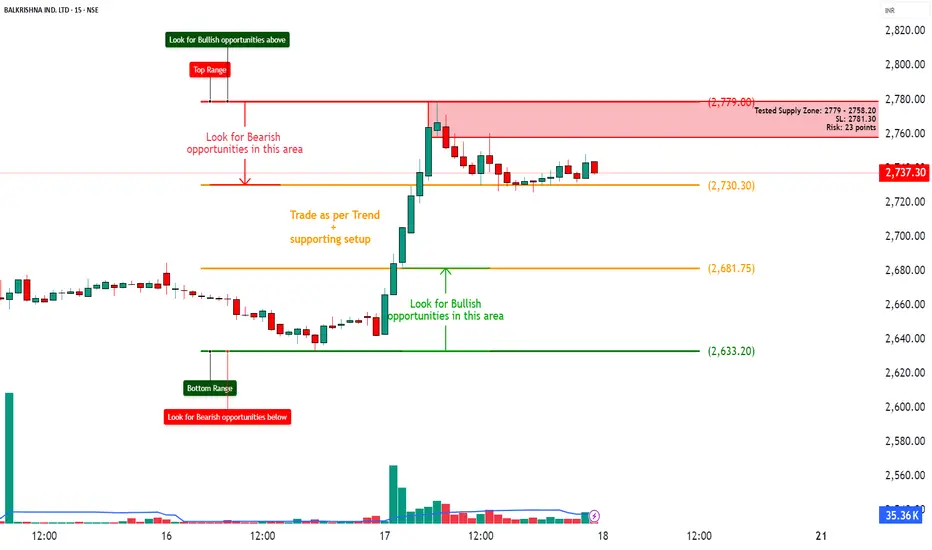
📈 BALKRISIND – Zone Based Price Action Setup
🕒 Chart Type: 15-Min | 🗓 Date: 17th July 2025
🔍 Easy-to-Understand Setup for New Traders
________________________________________________________________________________
🚦 Key Zones to Watch
🔴 Top Range (Resistance) – 2779.00
🟠 Mid-Level Zones – 2730.30 | 2681.75
🟢 Bottom Range (Support) – 2633.20
________________________________________________________________________________
💡 What’s Happening on the Chart?
✅ Strong Up-Move seen from the support zone 📈
✅ Price is now consolidating below a tested Supply Zone (2779 - 2758)
✅ Volume spike shows interest near breakout
✅ A clean structure for price action-based planning 🔍
________________________________________________________________________________
🎯 How to Plan Trades (Educational Purpose Only):
🔼 Best Buy Setup:
• Entry: Above 2779 (Breakout signs)
• SL: Below 2730
• Target: R:R 1:1 | 1:2 +
• Reason: Trend continuation + price holding above key levels
🔽 Best Sell Setup:
• Entry: Near 2775–2780 (Supply Zone)
• SL: 2781.30
• Target: R:R 1:1 | 1:2 +
• Reason: Strong supply zone tested + limited upside + defined risk
________________________________________________________________________________
🧠 Simple Learning Points:
• ✅ Trade with the trend until price reaches an opposing zone
• 🧱 Use zones (not random entries) for planning
• 📉 If price enters Supply → look for bearish signs
• 📈 If price pulls back to Demand → look for bullish setups
________________________________________________________________________________
📦 Zone Markings for Reference:
• 🔴 Supply Zone: 2779 – 2758.20
⚠ Disclaimer (Please Read):
• These Trades are shared for educational purposes only and is not investment advice.
• I am not a SEBI-registered advisor.
• The information provided here is based on personal market observation.
• No buy/sell recommendations are being made.
• Please do your own research or consult a registered financial advisor before making any trading decisions.
• Trading involves risk. Always use proper risk management.
I am not responsible for trading decisions based on this post.
________________________________________________________________________________
💬 Found this helpful?
Drop your thoughts or questions in the comments below ⬇️
🔁 Share this post with your trading community – let them benefit from clean charts, structured setups, and zone-based learning.
✅ Follow simpletradewithpatience for charts, clean setups, and educational content based on price action, zones, and risk-managed trades.
🚀 Trade with patience, trust your charts, and stay clear-headed!
Be Self-Reliant | Trade with Patience | Learn with Charts & Zones 📊
________________________________________________________________________________
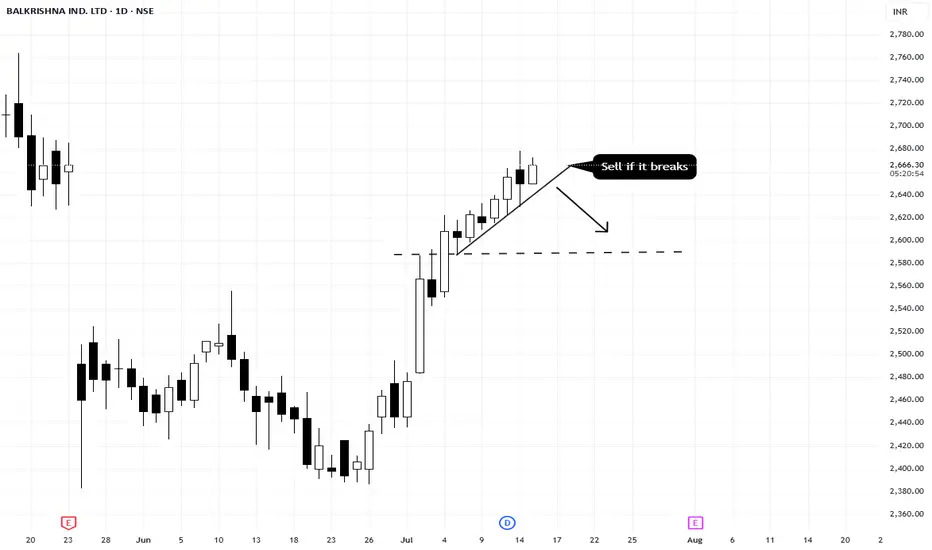
[Positional] Balkrishna Weekend StrategyNote -
One of the best forms of Price Action is to not try to predict at all. Instead of that, ACT on the price. So, this chart tells at "where" to act in "what direction. Unless it triggers, like, let's say the candle doesn't break the level which says "Buy if it breaks", You should not buy at all.
=======
I use shorthands for my trades.
"Positional" - means You can carry these positions and I do not see sharp volatility ahead. (I tally upcoming events and many small kinds of stuff to my own tiny capacity.)
"Intraday" -means You must close this position at any cost by the end of the day.
"Theta" , "Bounce" , "3BB" or "Entropy" - My own systems.
=======
I won't personally follow any rules. If I "think" (It is never gut feel. It is always some reason.) the trade is wrong, I may take reverse trade. I may carry forward an intraday position. What is meant here - You shouldn't follow me because I may miss updating. You should follow the system I share.
=======
Like -
Always follow a stop loss.
In the case of Intraday trades, it is mostly the "Day's High".
In the case of Positional trades, it is mostly the previous swings.
I do not use Stop Loss most of the time. But I manage my risk with options as I do most of the trades using derivatives
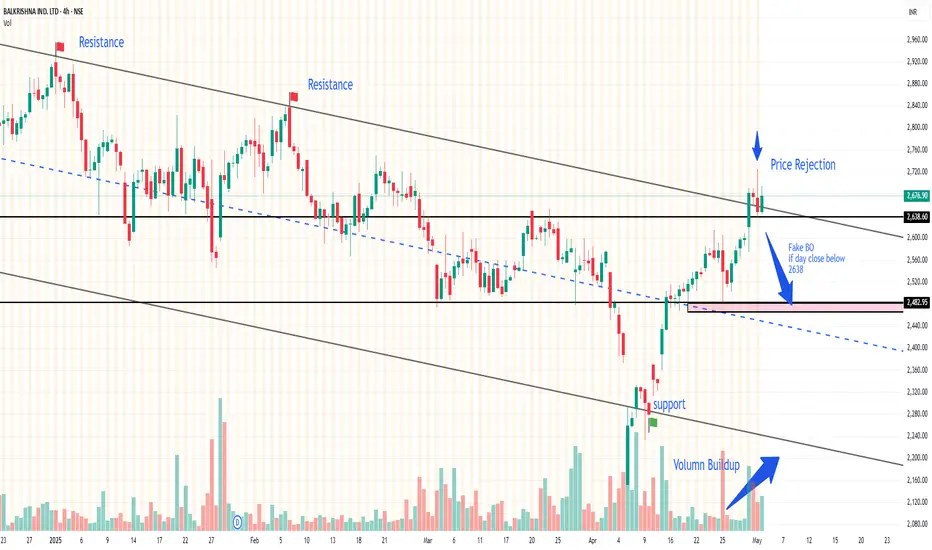
BALKRISIND case study on a possible fake BO1. Balkrisna IND made a Breakout of a long run parallel channel of 9 months (starting from 23rd sep 24)
2. Good volume buildup but there is price rejection from the top.
3. A possible case of fake BO if close below key support and channel @2638.
4. Analysis invalidated if the price in day candle close above 2724.
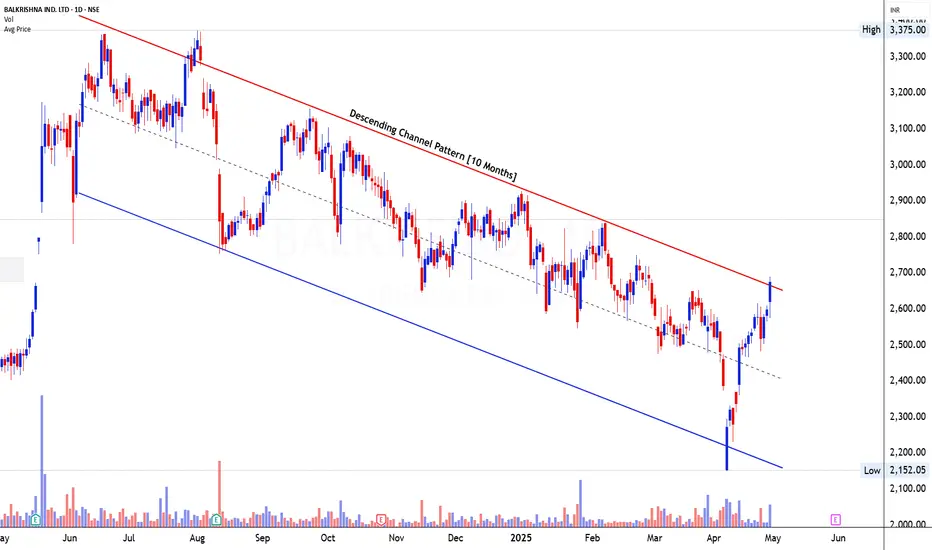
BALKRISHNA INDUSTRIES LTD – Descending Channel Pattern
1. Pattern Analysis
The price structure has developed a Descending Channel Pattern over a span of 10 months, making it a tradable and valid setup as per Mr. Chartist's methodology. The pattern is defined by a sequence of lower highs and lower lows, bounded by clearly marked red resistance and blue support trendlines. The price is currently hovering very close to the upper resistance of this descending channel, indicating an attempt at a breakout. Given that descending channels are typically considered bullish reversal formations when price action breaches the upper trendline, this chart now sits at a critical juncture.
2. Volume Analysis
The volume dynamics offer strong evidence of accumulation, particularly in the recent phase where the price surged from the lower end of the channel toward resistance. There has been a notable increase in volume during the most recent upswing, especially as the price approached the upper trendline. This suggests the presence of institutional buying or smart money entering the stock at lower levels. The previous downswings were characterized by muted volume, while the upswings are supported with rising participation — a classic bullish divergence in volume behavior.
3. Candlestick Analysis
Recent price action has been marked by bullish candles with expanding bodies and strong closes near the day’s highs. This aggressive price movement toward the channel resistance, backed by rising volume, reinforces the bullish undertone. In particular, the bullish momentum off the lower support (around ₹2,150) to the current level suggests a shift in sentiment from supply dominance to demand. However, the current candle sitting just at the resistance line is crucial — a strong breakout with a wide-range candle closing above ₹2,700 would confirm a pattern breakout and trend reversal.
4. Validation of Signal
The bullish setup is nearly validated but not fully confirmed yet. The descending channel pattern’s resistance has been tested but not conclusively broken. The stock is showing strength as it challenges this upper boundary with both price action and volume signaling intent. If the price can sustain above the channel with follow-up buying pressure, it would mark a valid breakout. Until then, the breakout anticipation remains strong but requires confirmation on a closing basis. The risk/reward remains favorable, given the proximity to breakout level and supportive buying volumes.
5. Tradable Points Determination
Entry Point Determination
A clean and confirmed entry will be on a breakout above ₹2,700 with strong bullish follow-through. Traders may also consider a pre-breakout entry between ₹2,660–₹2,690 with a tight stop, expecting a breakout in the next few sessions.
Target Point Determination
Based on the height of the descending channel (roughly ₹600), the measured move target after breakout would project toward ₹3,250–₹3,300, aligning well with previous consolidation zones from early 2024.
Stop Loss Placement and Trailing SL Follow-Up
For initial risk control, a stop loss can be placed below the most recent swing low at ₹2,500. Upon breakout confirmation, this can be trailed to the breakout zone (around ₹2,700). As the stock moves past ₹2,900, further trailing can be done using higher swing lows on the daily chart to lock in gains while allowing trend continuity.
BALKRISIND 1HRSWING TRADE
- EARN WITH ME DAILY 10K-20K -
BALKRISIND Looking good for Downside..
When it break level 2476 and sustain.. it will go Downside...
SELL @ 2476
Target
1st 2430
2nd 2381
FNO
BALKRISIND MAR FUT – LOT 7 (Qty-2100)
BALKRISIND MAR 2580 PE – LOT 7 (Qty-2100)
Enjoy trading traders.. Keep add this STOCK in your watch list..
Big Investor are welcome..
Like this Post??? Hit like button..!!!
Follow me for FREE Educational Post and Alert..

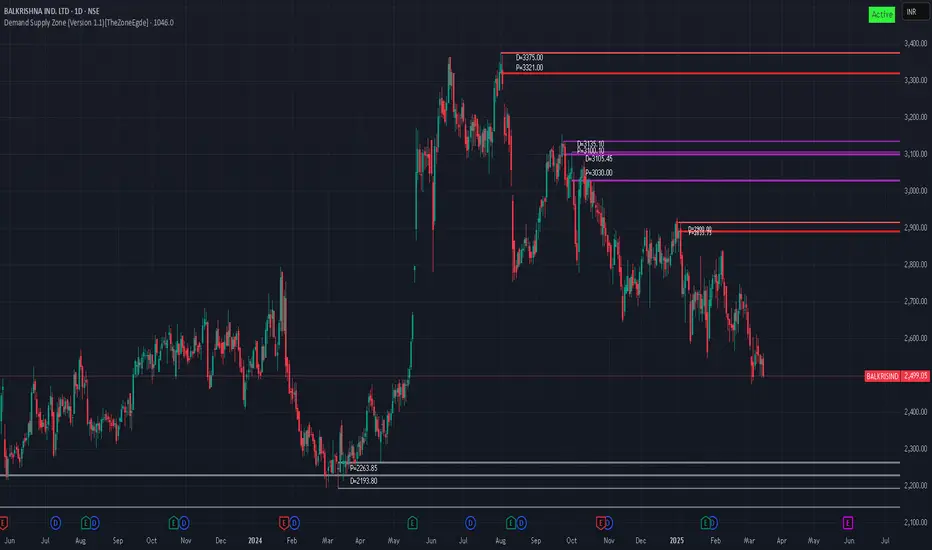
BALKRISIND Trading Within Demand Zone (2528.0-2475.5)The stock BALKRISIND is currently trading at 2499.05, within its demand zone ranging from 2528.0 to 2475.5. The last leg out occurred on 2024-05-16.
Disclaimer: This analysis is for informational purposes only and should not be considered financial advice. Please perform your own due diligence or consult a financial advisor before making any investment or trading decisions.
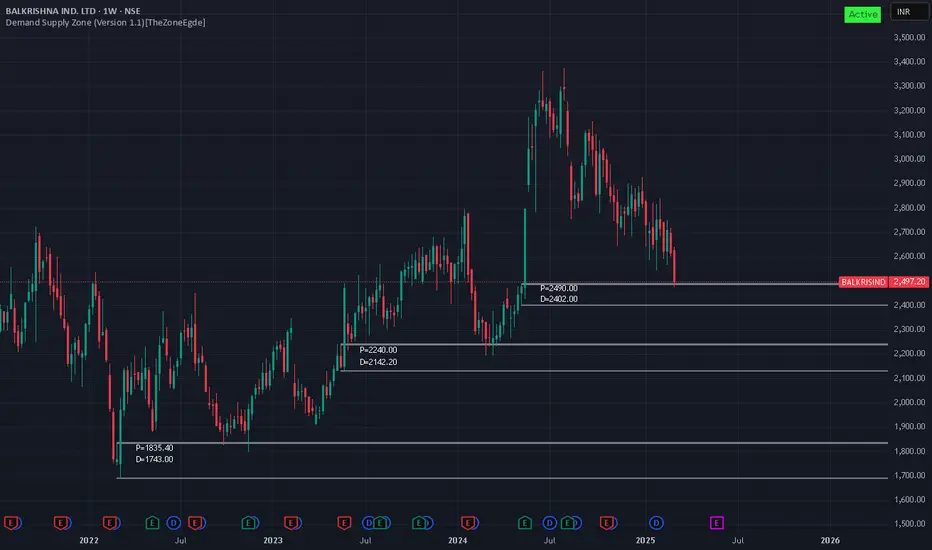
BALKRISIND Trading Within Weekly Demand ZoneBALKRISIND is currently trading at ₹2497.2, positioned within the weekly demand zone ranging from ₹2490 (baseHigh) to ₹2402 (baseLow), identified on 17th May 2024. This zone could act as a support level, potentially attracting buying interest. Investors may watch for signs of price stability or upward movement before making decisions.
Disclaimer: This analysis is for informational purposes only and should not be considered financial advice. Please perform your own due diligence or consult a financial advisor before making any investment or trading decisions.
Balkrishna Inds cmp 2669.95 by Daily Chart viewKeep the stock on radar for probable upside price move basis testing Support Zone and Falling Resistance Trendline
Balkrishna Inds cmp 2669.95 by Daily Chart view
- Support Zone at 2605 to 2650 Price Band
- Resistance Zone at 2890 to 2955 Price Band
- Stock Price seems to be testing and retesting the Support Zone since early January 2025
- 02 nos Gap Up opening of May 2024 and 01 Gap Down opening of Aug 2024 are been filled up
- 01 Gap Down Opening after ATH profit booking is yet to be filled up and will happen in near future
- Falling Resistance Trendline was cushioning an upwards Price move but seems it is been tested again

28th jan balkrisindustries for intradayhello everyone,
i know its not a buyer market , but still we have to stick to our strategies
and trust the technicals, as far as technicals are concerned, on daily chart
balkrisind is showing huge rsi divergence, apart from it, there is good prevolume today
so buy balkrisind at open and add on dip or buy in zone 2500-2540
sl will be at 2490 for tgt 2600-2650++ in intraday

Balkrishna Industries (BALKRISIND) Monthly Chart AnalysisThe technical setup combines Fibonacci retracements, trendlines, and moving averages to reveal key insights into future price action.
The following analysis covers key support and resistance levels, bullish and bearish scenarios, and potential trade opportunities.
Trend Overview :
The stock is in a long-term uptrend, supported by a rising trendline that has acted as a strong base.
Recent corrections indicate a healthy retracement within this uptrend.
Fibonacci Retracement Levels :
The Fibonacci retracement is drawn from a major swing low to swing high.
Key levels:
23.6% at 3,096.30.
38.2% at 2,966.30 (currently breached).
50% at 2,785.30 (tested as support).
61.8% at 2,605.30 (a critical level for buyers).
78.6% at 2,466.30 (final support zone).
Support Zones :
Primary Support: 50% retracement at 2,785.30 coinciding with EMA-21 (~2,661.59).
Secondary Support: 61.8% retracement at 2,605.30 aligned with a consolidation zone.
The long-term trendline also intersects around these levels, adding confluence.
Resistance Zones :
Immediate Resistance: 23.6% retracement at 3,096.30.
Strong Resistance: Previous swing high near 3,374.30.
Psychological resistance at 3,500.
Exponential Moving Averages (EMAs):
EMA-9 at 2,850.54 is currently supporting the price.
EMA-21 at 2,661.59 aligns with the 50% Fibonacci level, acting as a critical support zone.
The EMAs are in a bullish crossover, indicating long-term strength despite short-term corrections.
Volume Analysis :
Monthly volumes are consistent, with higher volumes during bullish candles, signaling strong institutional interest.
The recent pullback has seen declining volumes, suggesting a lack of aggressive selling.
Bullish Scenario :
If the price holds above the 50% retracement (2,785.30) and regains 3,096.30, the uptrend could resume.
Breakout above 3,374.30 may lead to new all-time highs, targeting 3,826.20 as per the Fibonacci extension.
Bearish Scenario :
A breakdown below the 61.8% retracement (2,605.30) and the long-term trendline could invalidate the uptrend.
Further downside could target the 78.6% retracement at 2,466.30 and psychological support at 2,400.
Trade Plan
For Bulls :
Entry: Near 2,785.30 (50% retracement) with confirmation of reversal signals.
Target 1: 3,096.30 (23.6% retracement).
Target 2: 3,374.30 (previous high).
Target 3: 3,826.20 (Fibonacci extension).
Stop Loss: Below 2,605.30 (61.8% retracement).
For Bears :
Entry: On breakdown below 2,605.30 with strong bearish momentum.
Target 1: 2,466.30 (78.6% retracement).
Target 2: 2,400 (psychological level).
Stop Loss: Above 2,785.30.

BALKRISIND - Breakout in Falling WedgeView : Bullish
Entry Zone- 2860- 2800 (Trend line breakout)
Exit Zone - Based on Trader mindset. Exit 1 - 2935
Exit 2- 3050
Exit 3 - 3300
Stoploss : Close below 2750
Timeframe: Daily
Notes: Trednline break out the Falling wedge pattern. Price consolidates since May 2024.

balkrishna ind long tradebalkrishna ind is showing early signs of a bounce, for next few sessions at least , a long side trade may be initiated, how ever as the over all market sentiments are weak, one need to be swift enough to exit the trades in case it goes wrong, also regular profit booking is a must.

bullish trendabove 2870 it will start to move up best buying will be above 2870 who have time to hold it will reward good an its reversed from golden level 0.618 its taken weekly trendline support its only for educational purpose only

Good to go long with minimum Risk /Reward Change in Polarity, Resistance become support, go long with good risk / reward.

Auto Index In Nifty AnalysisThrough this video I will tell you about the auto index that there is still a chance in it, the components of the auto index are also in the range and they are showing signs of low prices, this is the place where you can buy better products at low prices

BUY SET UPMonthly- Cup with change in polarity, inside candle, 20 MA hammer
WEEKLY- RSI 40 Support, doji with high volume
daily-RSI Bullish range shift, gap support

Short Term Trend tradingI consider this stock is in side ways move based on daily
which gives an potentially to trade with the Bracketed Range
One can look for trading in Equity with small Quantity
Goodluck

BALKRISIND Descending Triangle Pattern NSE:BALKRISIND
Chart Patterm : Descending Triangle pattern.
📉 Descending Triangle Pattern 📉
The Descending Triangle is marked by a series of lower highs and a relatively flat support level. It’s typically a bearish continuation pattern, suggesting the price might break below the support level after the consolidation phase.
Possible Targets Based on the Pattern:
🔻 Breakdown Target: If the stock breaks below the support level around ₹2779.00, the target can be estimated by measuring the height of the triangle and subtracting it from the breakdown point. The height of the triangle is approximately ₹596.00 (₹3375.00 - ₹2779.00). Therefore, the breakdown target would be around ₹2183.00 (₹2779.00 - ₹596.00).
🚀 Breakout Target: If the stock breaks above the resistance level around ₹3080.20, the target can be estimated by adding the height of the triangle to the breakout point. Therefore, the breakout target would be approximately ₹3676.20 (₹3080.20 + ₹596.00).
📢 Disclaimer: This is not financial advice. Please do your own research before making any investment decisions. The views expressed here are for educational purposes only.
Happy trading! 📊✨

Balkrishna Ind Ltd - BearishStock currently in downtrend
Making constant LLs - LHs
3030-50 strong supply area
View changes if close above 3050
Downside 2800 possible

Trade set up I believe this current structure in the stock suggest it can move another 5 %+ today
or Tomorrow one can look to make Gain with pre defined entry methods
Good luck

Balkrishna Industries Ltd Date : 11-10-2024
Balkrishna Industries
NSE: BALKRISIND
Remarks : Good area for scalping, long keeping trendline as stoploss
Regards,
Ankur

BALKRISIND looks good for a swing tradeBalkrishna Industries (BALKRISIND) has shown a strong uptrend in the major trend and has recently formed an inverse head and shoulders pattern during the pullback phase of this uptrend. The neckline of this inverse head and shoulders pattern has been broken, and the stock has also taken support at this neckline, further reinforcing the pattern. These factors together indicate a high potential for an upward move in the near future, suggesting that BALKRISIND could see significant upside.
