bharatforg swing trade for 5-6 days analysed on 21 oct 2021bharatforg swing trade for 5-6 days analysed on 21 oct 2021
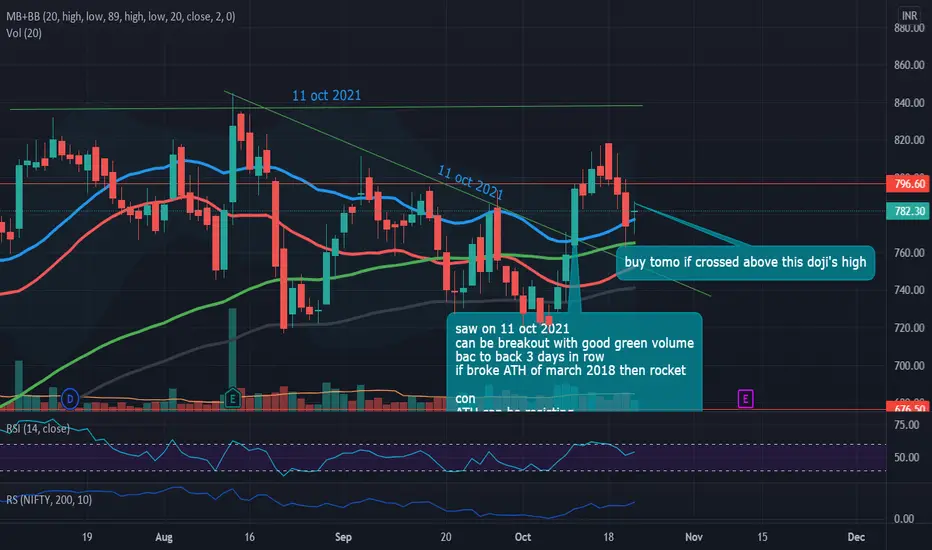
buy tomo if crossed above this doji's high
BHARATFORG trade ideas

Bharat Forge analysis.How NIFTY AUTO stocks performing for the past few days, we all saw that. Now the industrial manufacturing division also ready to give a good +ve move.
Reasons for going long in Bharat Forge->
1. Give a breakout from descending triangle.
2. Retest after breakout.
3. Also takes support from golden zone i.e 0.5-0.6 fib zone.

BHARATFORGBHARATFORG me box ke upra opne hota hai to buy krna hai aur 800 t1 bana hai jada up kulta hai ti fir koi maja nhi aaye gaa

Bharat Forge Long opportunityNSE:BHARATFORG
Hello All!
Bharat Forge has been consistently following the lower channel trendline since April 2020. It came on its trendline and has shown a strong bullish swing reversal with healthy volumes.The trendline 1 which depicts how the stock was falling has also been broken. This I believe has generated a good opportunity to go long!
Along with the price action there are other reasons to go long as well:
1)The stock is has broken the 50 day EMA and is now trading above it.
2)Along with the lower trendline, the stock has bounced back up from a strong support zone.
The Reward to Risk ratio also seems good!
Do let me know your views on this
*NOT A CALL*

bullish triangle breakout on the verge
Target : 900/950
SL: 770 ( closing basis)
Reason : Ramkrishna Forgings has deliver a splendid quarterly result, this stock has potential to deliver the same. See the chart for more clearance approach.

Bharatforge can be breakout analysed on 11 oct 2021saw on 11 oct 2021
can be breakout with good green volume
bac to back 3 days in row
if broke ATH of march 2018 then rocket
con
ATH can be resisting
analysed on 11 oct 2021

BhartForge-11Oct2021-Triangle-LongTriangle is getting formed. If it breaks out then marked target can be achieved.


Descending Triangle Pattern breakout in BHARATFORGOn a daily timeframe, BHARATFORG gives breakout of descending triangle pattern also MACD crossover indicating upside rally in this stock. After this breakout if stock sustain above 790 level then it will give 100+ points rally in upcoming few trading session.
Key Points for Bullish in this stock:
1) Descending Triangle Pattern resistance Breakout
2) This stock in uptrend
3) MACD bullish crossover in Oversold Zone indicating reversal of short term correction.

Bharatforge longBharatforge long
around 2 months trendline breakout
Buy at CMP-788
SL- 736
Target- 840, 908
Join us, Learn more, Earn more
Disclaimer- We are not SEBI registered advisor.
Charts and views are only for educational purpose.

falling wedge - weekly time frame at top with daily breakoutscript following through falling wedge in daily time frame with breakout givern recently along with similiar pattern seen in the weekly time frame
buy for long term
buy @ - 766
sl - 715
target - 834, 970

BHARAT Forge TL BoTL Breakout in Bharat Forge. Swing players can watch this with SL below the BO TL.

Bharatforg - Trend line rejection Price rejecting from the trend line and taking the support from the same level which makes it very strong level. When ever price reaching these levels then one can enter the trade with stop loss.

BHARATFORG LONG VIEWBHARATFORG LONG VIEW
POC Level: 753
In Triangle Now.
Buy at/above 775 SL: 700 TARGETS: 820/880/900/960
+ve Divergence in Volume
Data, Volume, Delivery & News in favor
*For educational purpose only

Not able to sustain highs After hitting a lifetime high, it hasn't attempted again and this suggest there is a lot of selling pressure at the top. 3 weeks of downward movement and all indicators have turned bearish.
Will short at the current levels for a medium term target of 650. View will be negated if weekly candle opens in green.


[POSITIONAL] BHARATFORG SHORT BET risk: Reward ratio is 1: 2
Rest as per Charts
********
Note -
One of the best forms of Price Action is to not try to predict at all. Instead of that, ACT on the price. So, this chart tells “where” to act in “what direction. Unless it triggers, like, let’s say the candle doesn’t break the level which says “Buy/Sell if it breaks”, You should not buy/sell at all.
=======
I use shorthands for my trades.
“Positional” - means You can carry these positions and I do not see sharp volatility ahead.
“Intraday” -means You must close this position at any cost by the end of the day.
=======
Always follow a stop loss.
In the case of Intraday trades, it is mostly the “Low/High of the Candle”.
In the case of Positional trades, it is mostly the previous swings
********

Swing Bharat forge Clearly it can be seen bullish divergence on the 1hour time frame ...can go for swing position !!!!


Bharat Forge - Keep on radarThe chart is self-explanatory. After breakout on any side, there will a good opportunity.
Only for learning and sharing purposes.
Not a bit of trading advice.
Please comment or suggest your views.
