Blue Dart Express Ltd: Evaluating Investment Potential Technical Analysis: Cypher Pattern and Support Levels
Blue Dart Express Ltd has formed a Cypher pattern in its stock chart and is currently trading with a 40% decline from its recent highs. The stock is finding significant support around the ₹5600 level, which may present a strategic entry point for long-term investors.
Fundamental Performance Overview
Revenue Growth: In the latest financial quarter, Blue Dart Express reported a 9.36% increase in net sales, amounting to approximately ₹1,448.46 crore, indicating resilience in demand for its logistics services despite market challenges.
Net Profit: The company experienced a 13.99% decline in net profit, reporting ₹62.84 crore for Q2 FY24-25, which reflects pressures from rising operational costs and competitive market conditions.
Price-to-Earnings (P/E) Ratio: The current P/E ratio for Blue Dart stands at approximately 49.08, suggesting that the stock may be considered overvalued relative to its earnings potential, especially in a competitive logistics sector.
Debt Levels: Blue Dart maintains a low debt-to-equity ratio of 0.01, indicating strong financial health with minimal reliance on debt financing, which enhances its stability and operational flexibility.
Return on Equity (ROE): The company reported an ROE of 10.45%, reflecting its effectiveness in generating profits from shareholders' equity, although this is lower than some industry peers.
Dividend Yield: Blue Dart Express offers a modest dividend yield of around 0.77%, providing some returns to investors amidst market fluctuations.
Market Capitalization: As of January 2025, Blue Dart Express has a market capitalization of approximately ₹14,775 crore, reinforcing its position as a key player in the logistics and express delivery sector.
BLUEDART trade ideas

BUY TODAY SELL TOMORROW for 5%DON’T HAVE TIME TO MANAGE YOUR TRADES?
- Take BTST trades at 3:25 pm every day
- Try to exit by taking 4-7% profit of each trade
- SL can also be maintained as closing below the low of the breakout candle
Now, why do I prefer BTST over swing trades? The primary reason is that I have observed that 90% of the stocks give most of the movement in just 1-2 days and the rest of the time they either consolidate or fall
Trendline Breakout in BLUEDART
BUY TODAY SELL TOMORROW for 5%

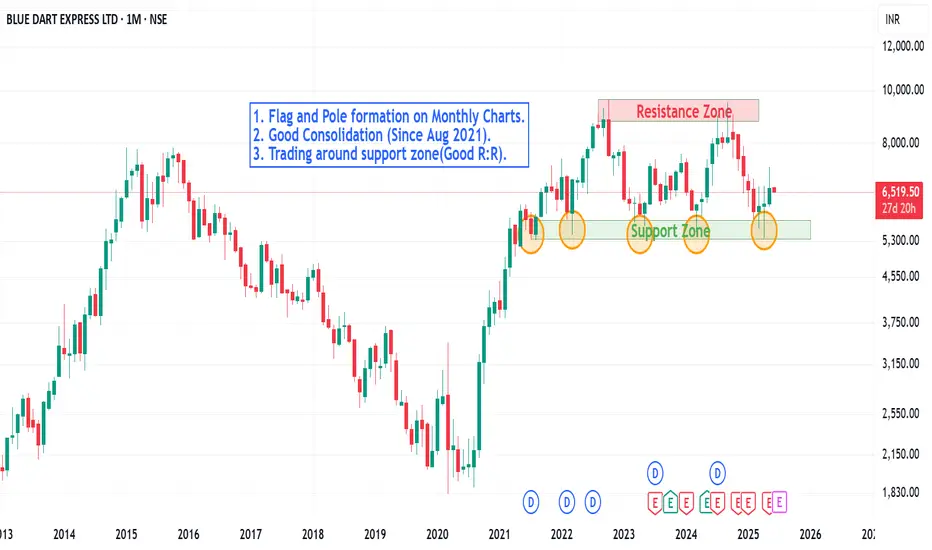
Is Bluedart Gearing Up for a Breakout? A Technical PerspectiveA good consolidation in there in the stock and on the monthly chart the stock has reconfirmed the support zone.
Major buying in happening there around 5500-5670 zone.
Weekly charts are showing consolidation phase around the very closing level as the price is trading between the various Moving averages.
A buying opportunity around 6200 levels can be initiated with a proper SL.
Technical Indicators:-
1. Stochastic : The weekly charts are trading around the oversold zone and on monthly charts its showing some lower levels coming on the charts.
2. Relative Strenght Indicator : On the monthly charts the stock has formed a bearish divergence and can be purchased once a 'W' formation is there in the RSI or price chart.
The stock has respected the support level since August 2021, a bearish trade can only be initiated once the major support level of 5500 is taken out. Avoid shorting till these levels.
Blue dart owning the logistic market can benefit from the E-commerce growth.
Long term buying opportunity can be seen in the stock with a potential returns of around 33-35% with a risk of 12-13% in coming years.
Watch the price action and enter only when the setup/pattern is formed on the charts.
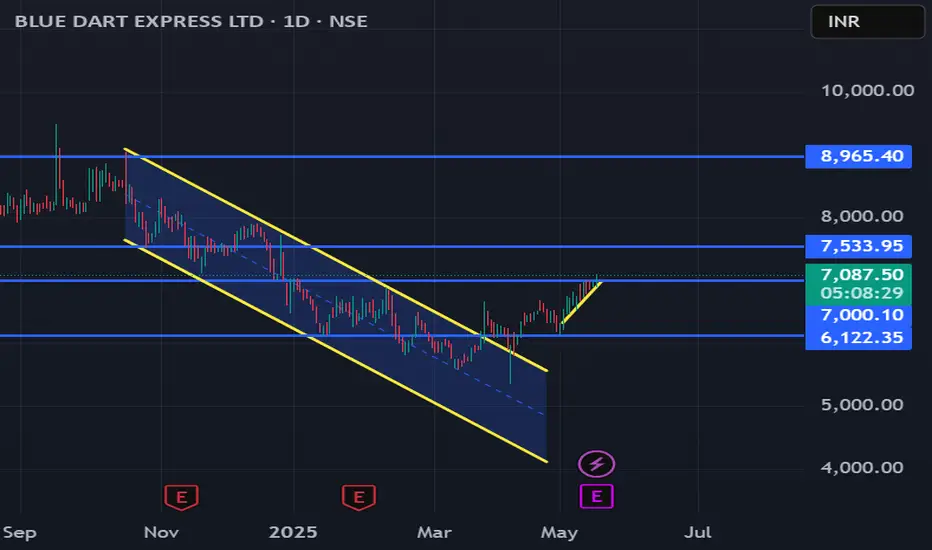
Blue Dart: Channel Breakout & Retest Above 7000Details:
Asset: Blue Dart Express Ltd (BLUEDART)
Breakout Level: 7000
Potential Targets: 7500, 8000, 8900
Stop Loss: Below 6850 or as per risk management
Timeframe: Medium to long-term
Rationale: Blue Dart has shown a confirmed breakout from a channel pattern with a successful retest above 7000. The pullback confirmation suggests renewed buying interest, targeting higher levels in the coming weeks.
Market Analysis:
Technical Setup: Breakout followed by a healthy retest strengthens the bullish setup.
Sector Strength: Increasing demand for logistics and e-commerce delivery services post-economic recovery boosts long-term fundamentals.
Risk Management:
Maintain a stop loss below 6850 to safeguard against a false breakout.
Timeframe:
Medium to long-term trend expected to continue if price sustains above breakout level.
Risk-Reward Ratio:
Highly favorable due to well-defined breakout and layered targets.
Look for increasing volume on further upmove as confirmation of trend continuation.
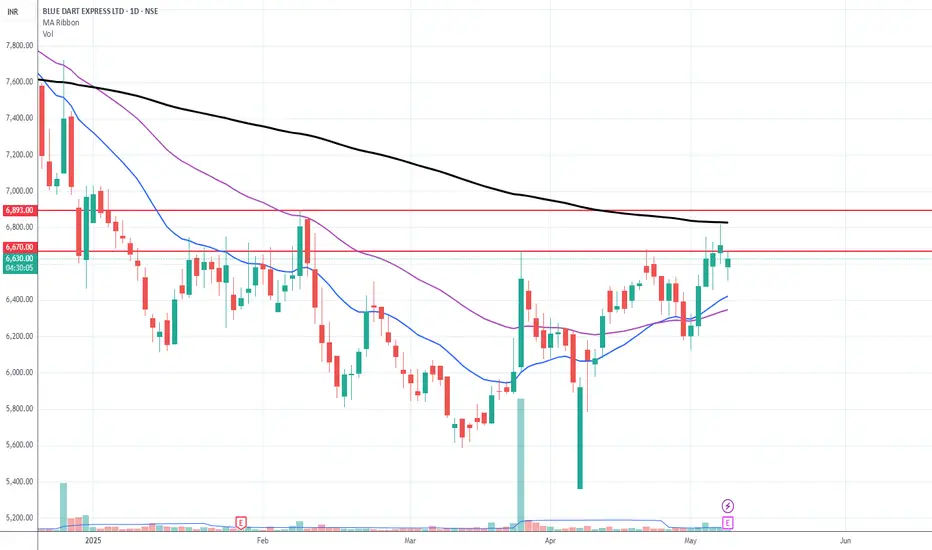
Blue Dart looks like bottoming outPrice is above both 21 and 50 EMA
6670 is acting as resistance with volatility contracting on right side
It could be an opportunity to accumulate some on break of 6670 and rest on break of 6893
BlueEntryStrategy for Entry:
Wait for Confirmation:
Monitor the ₹6,000 zone closely. If the price stabilizes or forms bullish reversal patterns (e.g., hammer, engulfing), consider entering.
RSI Divergence:
Look for positive RSI divergence (price makes lower lows, but RSI makes higher lows) near support for confirmation.
Risk Management:
Place a stop-loss below ₹5,900 to minimize risk in case the support fails.
Target previous resistance levels for profit, such as ₹7,200.

BLUEDART - A must watch long term portfolio stock!MONTHLY TF VIEW:
Price Observations:
1. Good Volume support
2. Price structure is bullish
3. Reclaiming 9 years BO level
4. Bouncing from Monthly swing 50% fib level.
5. Bouncing from the Weekly Demand zone
6. Earnings are showing good growth as well.
Trade Plan:
1. Entry can be planned above 7900 with 15% Sl
2. Targets can be huge 14000 I'm expecting not immediately but eventually will reach there. Since it is a portfolio pick. For swing trade 9000 & 10000 can be considered as the TP levels
- Stay tuned for further insights, updates and trade safely!
- If you liked the analysis, don't forget to leave a comment and boost the post. Happy trading!
Disclaimer: This is NOT a buy/sell recommendation. This post is meant for learning purposes only. Please, do your due diligence before investing.
Thanks & Regards,
Anubrata Ray

BlueDart Long PositionalDate : 02-10-2024
-------------------------------------
Breakout Soon (PICK RESEARCH TO OBSERVE)
BlueDart Looks Good Above 9034
SL 7090
Target 10330, 12922++
Hold Period : Few Weeks to Months
Reason for Pick : Consolidation & Breakout, Above 20, 50, 200 SMA
Please consult your financial advisor before investing
All research for educational purposes only.

About to Break Parallel Channel ConsolidationNSE:BLUEDART is about to break parallel Channel Consolidation and is about to Break Key Levels. A Close above 9000 is important. Keep in Radar.
Check out my other stock ideas below until this trade gets activated, I would love your feedback.
Disclaimer: This analysis is intended solely for informational and educational purposes and should not be interpreted as financial advice. It is advisable to consult a qualified financial advisor or conduct thorough research before making investment decisions.

BLUEDART // Level // 1H"Welcome to SkyTradingZone "
Hello Everyone 👋
Bluedart Level 1H Challenge:
Task: Complete a series of tasks within a 1-hour timeframe to test your skills and knowledge related to logistics and courier services.
Tasks may include:
Processing and sorting packages
Tracking and updating delivery status
Resolving customer complaints or issues
Completing a series of logical puzzles or brain teasers related to logistics and delivery
Tips to succeed in the Level 1H Challenge:
Focus on efficiency and accuracy: With only 1 hour to complete the tasks, it's essential to work quickly and accurately.

BLUEDART - Cup and Handle—Breakout -DailyBLUEDART - Cup and Handle—Daily
Upward Trend Line:
Indicates a general increase in price over time.
Neckline - 8995 => exit:
Suggests a potential exit point at the price level of 8995.
Breakout with Very High Volume:
Indicates a significant price movement accompanied by high trading volume, which often confirms the strength of the breakout.
For a potential price target of 12,555.
This analysis suggests that the price has broken out of a previous resistance level with strong volume and may continue to rise, potentially reaching the 12,555 level. However, always consider other factors and conduct further research before making any trading decisions

BlueDart Express - Daily Trendline Break - Target of 9600+BlueDart has breached its daily down trendline. We can see good volumes as well. The target here is 9600+. We can wait for a pull back and it should not breach the trendline. Other factors:
1. RSI is above 60
2. MACD is on the verge of making a green histograms
Good risk ratio on this trade.
"Clean Charts, Easy Charts"
Learning & Earning!!!
Cheers!!!

Longterm Opportunity on Blue DartGo Long @ 6195.1.1 for Targets of 7060, 7550, and 8040 with SL 5700
Reasons to go Long :
1. On a Monthly timeframe if we draw the Fibonacci retracement tool from the recent swing low (point A) to the recent swing high (point B) then we see stock took support from the 0.5 Fibonacci level.
2. In addition to this a bullish candlestick pattern Bullish Hammer (marked with orange color) is formed around the 0.5 Fibonacci level.
3. Also there is a strong demand zone (marked with green color), from which the stock is taking support and moving up.
4. Also on a weekly timeframe stock has formed a double bottom (W) pattern.

Bluedart - Weekly viewBluedart :
Approaching resistance zone
Sustaining 9250 is crucial for an all time high
Support at 9000

BLUEDART#BLUEDART is entering into stage 2 after breaking out from a long base.Stock is ready to fire up.

Amazing breakout on Weekly / Daily Timeframe - BLUEDARTCheckout an amazing breakout happened in the stock in Weekly timeframe, macroscopically seen in Daily timeframe. Having a great favour that the stock might be bullish expecting a staggering returns of minimum 25% TGT. IMPORTANT BREAKOUT LEVELS ARE ALWAYS RESPECTED!
NOTE for learners: Place the breakout levels as per the chart shared and track it yourself to get amazed!!
#No complicated chart patterns
#No big big indicators
#No Excel sheet or number magics
TRADE IDEA: WAIT FOR THE STOCK TO BREAKOUT IN LOWER TIMEFRAME AND RETRACE IF NEEDED. SL IS NEARER SUPPORT ZONE IN Daily TIMEFRAME.
PS: No new Nifty500 script can escape from me when making a breakout. :-)

BLUEDART - Don't miss this courier companyBLUEDART has broken its mid term resistance at 7400 and now headed to its long term resistance at 7900-8000.
If this manages to close above 7900 (8000+ for safe traders), it can witness good upside momentum.
7400 level will become support area (SL).
9000-9100 is target 1.
Once this target is reached, will post an update.

BLUEDART - Don't miss this courier company BLUEDART has broken its mid term resistance at 7400 and now headed to its long term resistance at 7900-8000.
If this manages to close above 7900 (8000+ for safe traders), it can witness good upside momentum.
7400 level will become support area (SL).
9000-9100 is target 1.
Once this target is reached, will post an update.
Thanks
Piyush Gupta
Learn & Earn

[Swing Trade] BLUEDART looks promising after BOBLUEDART seems to be getting ready for some 5% up move..keep it under radar.. I dont recommend others to trade on my views.
Il wait for BO, volume build up and retracement

Monopoly Courier Stock given Breakout,Which has 54% Market ShareHello Everyone, I hope you all will be doing good in your Trading and life as well. I have brought another good stock, which has given breakout with good volume on weekly timeframe, Company is industry leader in their segment, Co. is a market leader in organized air express with a market share of 54% in FY21 v/s 45% in FY15. Co. is on 4th market position in Organized Ground Express with a market share of ~17%. Company name is Blue Dart Express Limited , incorporated in 1983, is involved in transportation and door-to-door distribution of time-sensitive shipments, through an integrated ground and air transportation network. The company is regarded as South Asia’s leading courier and integrated air express package distribution company.
STOCK HAS GIVEN BREAKOUT OF BULLISH TRIANGLE PATTERN
STOCK IS ABOVE 200-DEMA LINE
MACD IS GIVING BULLISH CROSSOVER
RSI ALSO INDICATING BULLISH CROSSOVER IN STOCK (I HAVE NOT PLACED RSI ON CHART, JUST DID MY ANALYSIS)
THINK FOR LONG TERM, STOCK IS GOOD TO DO SIP IN LONG TERM..
STOCK IS GIVING BEST ENTRY TO ENTER AND HOLD FOR LONG TERM.
Market Cap
₹ 17,081 Cr.
Current Price
₹ 7,198
High / Low
₹ 7,650 / 5,487
Stock P/E
56.7
Book Value
₹ 576
Dividend Yield
0.42 %
ROCE
19.9 %
ROE
23.6 %
Face Value
₹ 10.0
Industry PE
56.7
Debt
₹ 1,073 Cr.
EPS
₹ 127
Promoter holding
75.0 %
Intrinsic Value
₹ 1,255
Pledged percentage
0.00 %
EVEBITDA
19.9
Change in Prom Hold
0.00 %
Profit Var 5Yrs
27.3 %
Sales growth 5Years
10.7 %
Return over 5years
19.1 %
Debt to equity
0.78
Net profit
₹ 301 Cr.
ROE 5Yr
29.6 %
Profit growth
-16.0 %
PROS:-
Company has delivered good profit growth of 27.3% CAGR over last 5 years
Company has a good return on equity (ROE) track record: 3 Years ROE 35.1%
Company has been maintaining a healthy dividend payout of 25.4%
CONS:-
Stock is trading at 12.5 times its book value
Disclaimer:- Please always do your own analysis or consult with your financial advisor before taking any kind of trades.
Dear traders, If you like my work then do not forget to hit like and follow me, and guy's let me know what do you think about this idea in comment box, i would be love to reply all of you guy's.
Thankyou.

Bluedart: Triangle pattern breakoutFor education purposes only.
Breakout happens with the good upside move. This can fall to the mentioned level and can be bought at the mentioned level for the target of 7250.

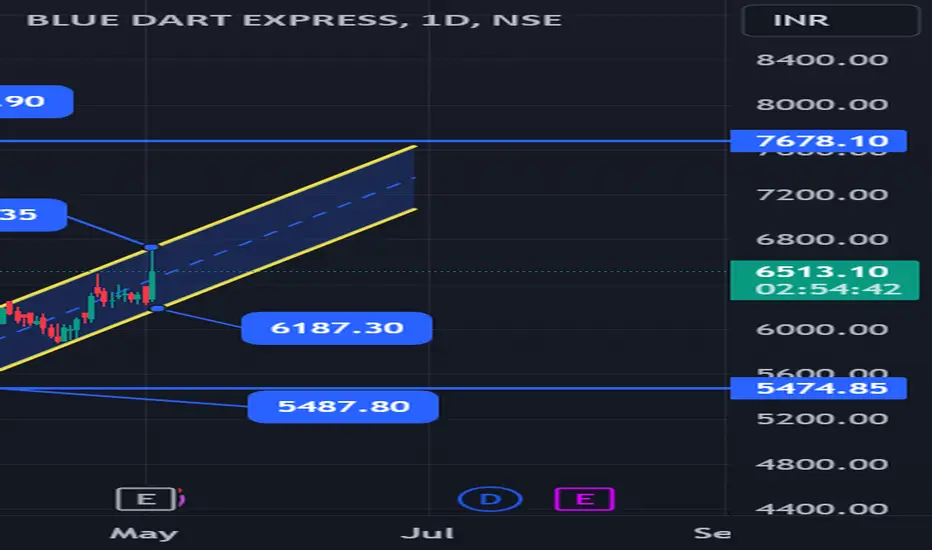
Bullish Channel Formation in Blue Dart with Strong Support LevelBullish Channel Formation in Blue Dart with Strong Support Levels
Body: The stock of Blue Dart is exhibiting a promising bullish channel pattern, suggesting an upward trajectory in the long term. The current support levels are firmly established at ₹6187 and ₹6731, providing a robust foundation for potential price appreciation.
Key Points:
Strong Support: The stock has consistently bounced off the ₹6187 support level, indicating solid buyer interest.
Resistance Break: A decisive move past the ₹6731 resistance could accelerate the uptrend.
Long-Term Target: If the bullish momentum continues, we might see the stock price reach as high as ₹7690 over an extended period.
Analysis: The technical indicators align with the bullish sentiment, as the stock is poised to continue its upward movement within the channel. Traders should monitor volume and price action closely for confirmation of the trend.
Conclusion: Blue Dart’s stock is on a path to potentially significant gains, with key support levels providing a safety net for investors. The long-term target of ₹7690 remains in sight, making it an attractive opportunity for those looking to capitalize on this momentum.
Remember to include a chart that illustrates the channel pattern and the mentioned price levels to provide a visual aid for your analysis. Good luck with your post! 📈