BPCL trade ideas

BPCL LongStock has formed inverse head & shoulder pattern. Breakout has happened with good volumes. Chart is self explanatory

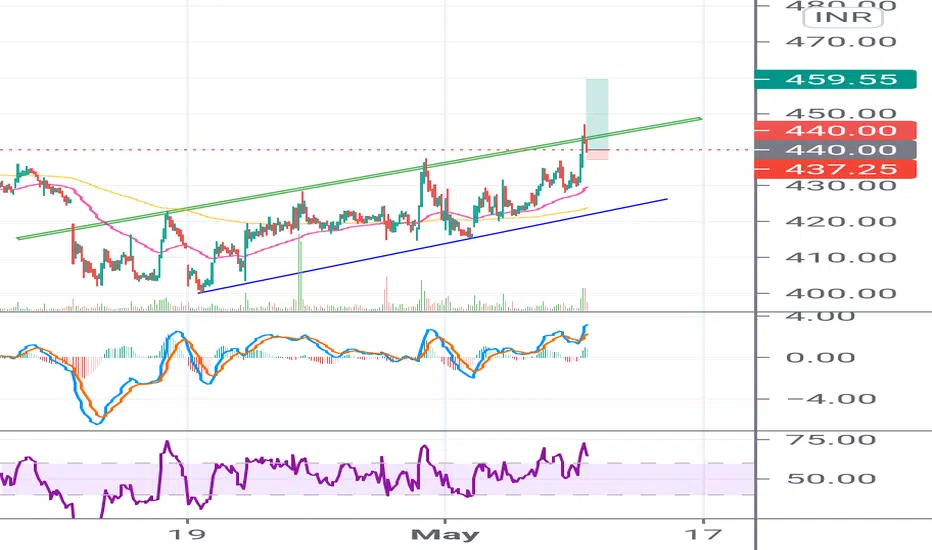
BPCL go longBpcl looks good can buy at the current price or at previous support level of 438 and 1 target of 463 and then second target of 475 can be easily achieved.

BPCL Again Opportunity🔥🍂BPCL again😋🍂
🍁our second entry in BPCL
First entry @380, trgt 480 done.
🍂🍂 buy@ 410-18 range
trgt 480-550
long 700-800-1000+(long target based on growth) 🍂🍂
✔expecting good upmovemnt in the stock
✔respecting symmetrical triangle & ascending triangle
✔trend reversed @ weekly support area

BPCL_OUT OF CHANNEL PATTERNBPCL has given a breakout of a channel pattern and now in a retracement phase.
It can go bullish from here.
(for educational purpose only)

BPCL LongSeems stock is preparing to move up . Can buy with a SL of 400 for target of 440 / 460 and above ..

BPCL, slightly risky but if works will be worth it.BPCL is forming ascending Triangle.
It's Interesting to see the rejections at the resistance level marked by red arrows, because those 2 candle show strong reversal with upper wicks and short bodies , following by big down move.
The Trend line is acting as a good support since March 2020 fall. It's been tested multiple times, that's why I mentioned slightly risky
Reason for going long, bullish engulf candle at supporting trend line. SL will be around previous support at trend line around 370 area. At this entry point risk reward is most favorable being closer to the support.
First target will be the resistance zone yellow area.
Yellow marked area Being a strong rejection zone, if crossed will trigger a sharp upmove or will be crossed will be crossed with sharp move. Next target is much much higher, that's why most favorable risk reward at current levels.
Week on week for 4 weeks now volumes picking up.
On daily chart below see, check the stock is in narrow range and at the upper end of it.
Check previous Idea on BPCL
Link attached

BPCL : slow and steady one for portfolioIt is retesting the latest breakout on weekly charts. One should look for adding it on all dips in the portfolio for a 4-digits target.


BPCL (short term)1) Range bound market
2) buy above 425 for the targets of 440 460 & 475
3) sell below 395 for the targets of 375 & 355
4) stop loss 410
**trade should be taken only after the zone breakout(after the candle closing)**

BPCLBPCL GIVE A BIG BULLISH ENGULFING PATTERN ON CHART NOW IT'S ON REVERSAL. NEXT TARGET 435, 445, 460. IF YOU GET PROFIT SO PLEASE LIKE AND FOLLOW FOR MORE UPDATE.

BPCL Buy NowBPCL is looking strongly bullish on chart....
one can go long positionally..
Any query regarding Buying/Target1/Target2/Target3 with Trailing Stop Loss, Kindly reply in comment, i will be happy to respond...
Note: Only for education purpose/Do not trade without consulting your financial advisor...

BPCLBPCL can be a long candidate for short term. PSU stocks can be good for swing trading.
For educational purposes.


BPCL Breakout BPCL has already given a breakout if it sustains the levels we can see a good upside movement if nifty also sustians we can see a good movement.

BPCLBPCL (NSE Cash)
Market cap is above 241.297b
Volumes are above 666.887k
Average volume is 2.28
Float is 77.522M
LTP: 423.05
Support: 413.55
Resistance: 434.60 / 441.85
Daily charts (long term)
A bullish engulfing candle was made on 22nd April followed by a confirmation green candle on the 23rd.
There is a reversal seen in the DEMA as well. 5 DEMA has crossed 100 DEMA and is on the way to cross 10 DEMA. Once 5 DEMA crosses 10 DEMA and both of them cross the 20 DEMA we can expect a steep bull run.
The volume is in greens as well.
MACD, though in the bear zone has started a reversal. We will soon see MACD climb in the bull zone if the momentum continues.
RSI is in an uptrend. It is now in the neutral zone which is very close to the 50 mark. We may see a bull rally once RSI crosses the 50 mark and sustains.
***All signs for long term are bullish.
Hourly charts (medium term)
DEMA is aligning. It is messy at this point but the reversal is quite prominent.
Higher tops and high bottom formation is seen which is a bullish trend.
The last volume bar is strong and green.
MACD is in the bull zone and looks strong.
RSI is well above the 50 mark and looks strong as well.
***Again, all signs are bullish.
15m chart (short term)
DEMA is well aligned and the candles are holding strong above it.
Volumes look good.
RSI is in the bull zone and is strong.
RSI is above the 50 mark and looks strong as well.
*** All signs are bullish.
Can buy now and add if the prices come down for short term targets of 440+

Buy BPCLMy idea is for educational purpose.
Buy BPCL @ 430 and decline for short term gain of 10-20%.

BPCL forming a Hammer patternLogic
1) Big time frame Triangle pattern retesting
2) Trend line retesting
3) Hammer formation

BPCL IN VERY GOOD PATTERN AND SHORT TERM MOVEMENT CAN BE CAPTURBPCL IN 15 MIN CHARTS IS IN GOOD CHANNEL GOOD MOVEMENT CAN BE SEEN BREAKING THE TREND CAN GIVE GOOD MOVEMENT,,,,,,,,,,,,,,,NIFTY DIRECTION CAN BE DIRECTIONAL..
