Study and Bullish on Result Tomorrow | Castrol India Ltd Castrol India is showing an interesting setup both fundamentally and technically ahead of its upcoming quarterly results on 4th November 2025.
🔹 Fundamental View:
The company has maintained strong performance over recent quarters —
Net Sales steadily growing from ₹1,293 Cr (Mar 2023) to ₹1,496 Cr (
Next report date
—
Report period
—
EPS estimate
—
Revenue estimate
—
9.87 INR
9.27 B INR
53.65 B INR
482.52 M
About Castrol India Limited
Sector
Industry
CEO
Kedar Lele
Website
Headquarters
Mumbai
Founded
1919
ISIN
INE172A01027
FIGI
BBG000CPS5Y1
Castrol India Ltd. engages in the business of manufacturing and marketing of automotive, non-automotive lubricants and related services. It has products for commercial vehicles, diesel cars and sports utility vehicles, scooters, and the industrial, marine, and building and construction sectors. The firm markets automotive lubricants brands such as Castrol and BP. The company was founded in 1919 and is headquartered in Mumbai, India.
Related stocks
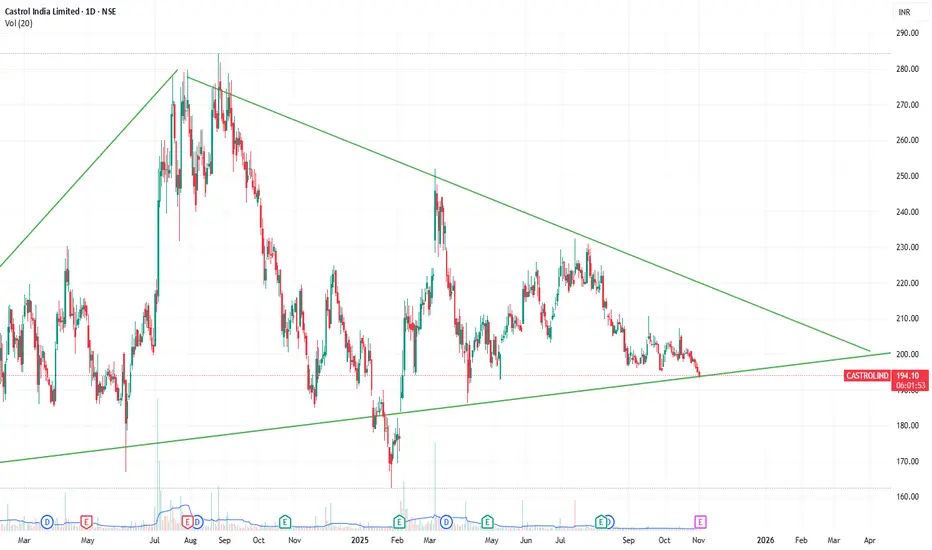
Castrol India (NSE: CASTROLIND) – Bullish Study Idea🧩 Chart Pattern:
Price is consolidating within a descending triangle and forming a strong base near ₹190–₹192.
A breakout above ₹202–₹204 could trigger a trend reversal and a potential 10% short-term rally.
📊 Technical View:
Trendline Resistance: ₹202–₹204
Support Zone: ₹190–₹192
RSI: Around 40, s
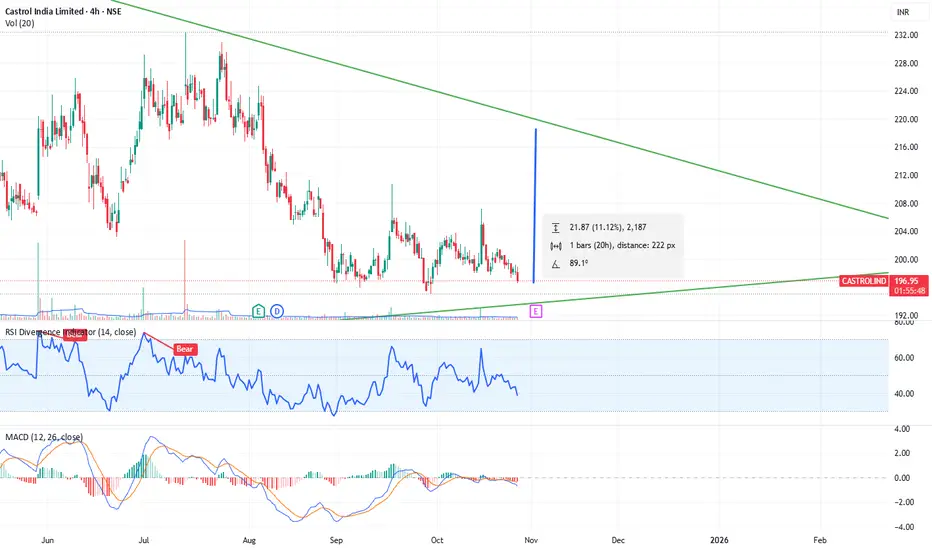
Triangle Pattern Strategy for Breakout within Range | Study OnlyThis chart showcases a symmetrical triangle pattern, where the price consolidates between two converging trendlines, indicating a period of market indecision. The formation of lower highs and higher lows suggests that the price is narrowing, setting up for a potential breakout.
Technically, the RSI
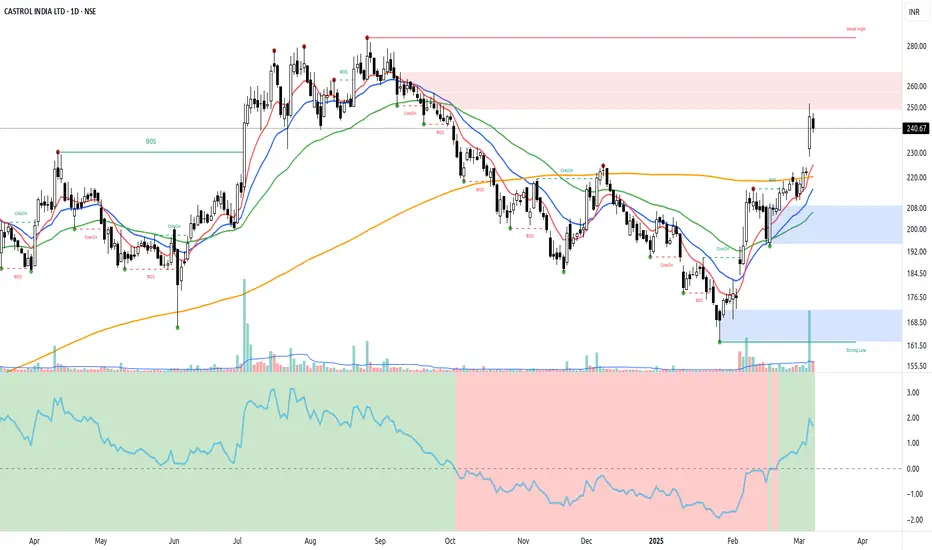
Castrol: Lubricant Oil Giant's Ends Consolidation PhaseNSE:CASTROLIND : Lubricant Oil Giant's Consolidation Phase Offers Strategic Entry Opportunity
Looking at NSE:CASTROLIND chart on the Daily Timeframe, the stock presents a compelling technical setup after months of consolidation following a significant decline from its October 2024 highs.
Price
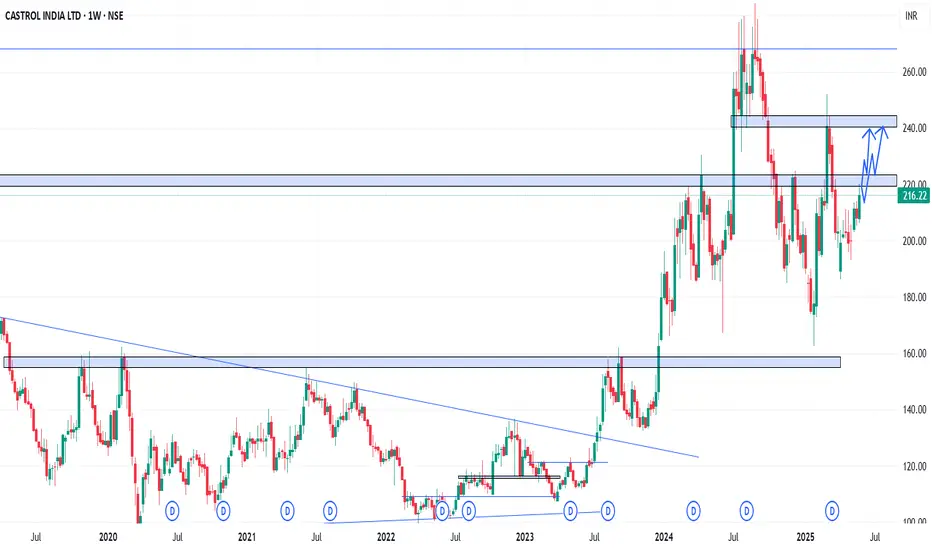
CASTROLIND - Weekly AnalysisIn the Weekly Chart of CASTROLIND ,
we can see that; 220 is a crucial level.
Expecting a Halt candle for resting the level.
Expected momentums are shown in chart.
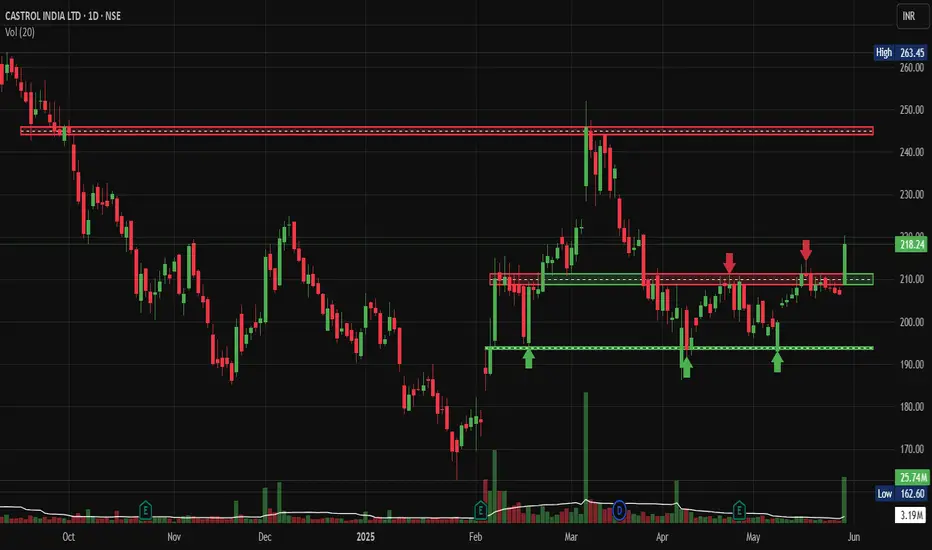
CASTROL technical analysisStock Overview: Castrol India Ltd, NSE, current price: INR 202.98. Castrol India Ltd is a prominent player in the manufacturing and marketing of automotive and industrial lubricants, greases, and related products, with a strong presence in the automotive sector.
Key Levels:
Support levels: INR 191

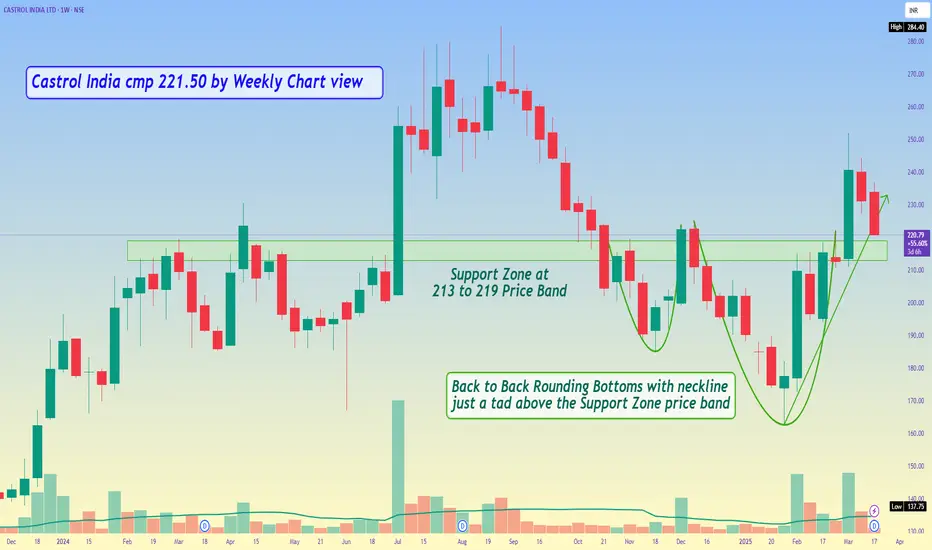
Castrol India cmp 221.50 by Weekly Chart viewCastrol India cmp 221.50 by Weekly Chart view
- Support Zone at 213 to 219 Price Band
- Resistance Zone at 242 to 250 Price Band
- Rising Support Trendline seems to be respected for upside move
- Back to Back Rounding Bottoms with neckline just a tad above the Support Zone price band
Castrol IndiaDate 10.03.2025
Castrol India
Timeframe : Weekly
Technical Remarks :
1 Currently under wave c after completion of corrective phase 5-3-5 abc wave
2 Formed bullish crab under harmonics pattern & target 1 is already achieved
3 Therefore, for fresh longs enter above 242 & keep targets of extensi

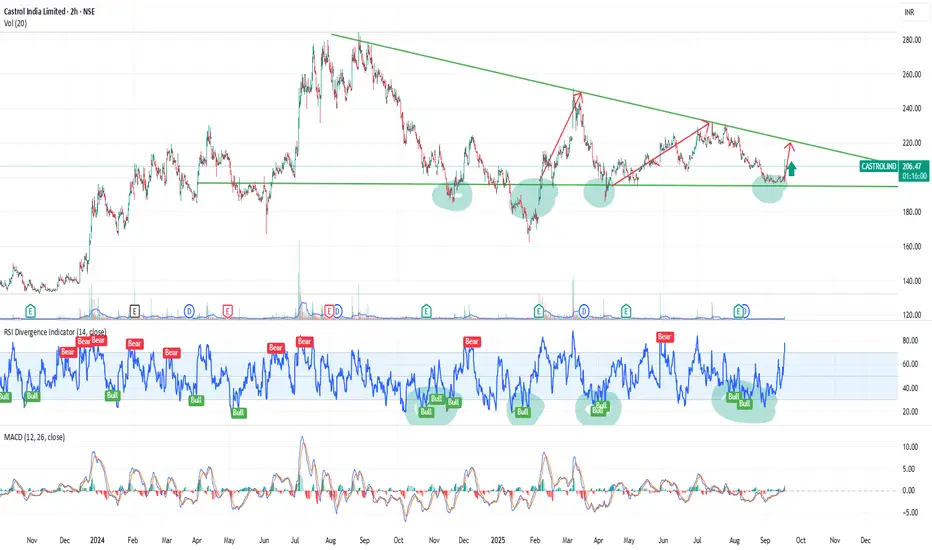
#CastrolIndia – Strong Breakout, Eyeing Higher Levels! #CastrolIndia – Strong Breakout, Eyeing Higher Levels! 🚀🔥
Technical Analysis:
✅ Breakout Above 200 SMA: The stock has successfully broken above the 200 SMA, confirming a trend reversal.
✅ Strong Volume: The recent rally is backed by high volume, signaling strong buying interest.
✅ Relative Strengt
Castrol India LtdCastrol India Ltd is principally engaged in the business of manufacturing & marketing of automotive and industrial lubricants and related services.
The company manufactures and sells various kinds of oil lubricants and other fluids for cars, motorcycles, commercial vehicles, industrial use, energy s

See all ideas
Summarizing what the indicators are suggesting.
Neutral
SellBuy
Strong sellStrong buy
Strong sellSellNeutralBuyStrong buy
Neutral
SellBuy
Strong sellStrong buy
Strong sellSellNeutralBuyStrong buy
Neutral
SellBuy
Strong sellStrong buy
Strong sellSellNeutralBuyStrong buy
An aggregate view of professional's ratings.
Neutral
SellBuy
Strong sellStrong buy
Strong sellSellNeutralBuyStrong buy
Neutral
SellBuy
Strong sellStrong buy
Strong sellSellNeutralBuyStrong buy
Neutral
SellBuy
Strong sellStrong buy
Strong sellSellNeutralBuyStrong buy
Displays a symbol's price movements over previous years to identify recurring trends.
SMALLCAP
Mirae Asset Nifty Smallcap 250 Momentum Quality 100 ETF Units Exchange Traded FundWeight
1.35%
Market value
1.09 M
USD
Explore more ETFs
Curated watchlists where CASTROLIND is featured.

Downstream oil: Petroleum through the pipes
39 No. of Symbols
See all sparks
Frequently Asked Questions
The current price of CASTROLIND is 194.01 INR — it has decreased by −0.87% in the past 24 hours. Watch Castrol India Limited stock price performance more closely on the chart.
Depending on the exchange, the stock ticker may vary. For instance, on NSE exchange Castrol India Limited stocks are traded under the ticker CASTROLIND.
CASTROLIND stock has fallen by −1.35% compared to the previous week, the month change is a −5.58% fall, over the last year Castrol India Limited has showed a 3.08% increase.
We've gathered analysts' opinions on Castrol India Limited future price: according to them, CASTROLIND price has a max estimate of 260.00 INR and a min estimate of 211.00 INR. Watch CASTROLIND chart and read a more detailed Castrol India Limited stock forecast: see what analysts think of Castrol India Limited and suggest that you do with its stocks.
CASTROLIND reached its all-time high on Aug 27, 2024 with the price of 284.40 INR, and its all-time low was 23.75 INR and was reached on Jan 22, 2008. View more price dynamics on CASTROLIND chart.
See other stocks reaching their highest and lowest prices.
See other stocks reaching their highest and lowest prices.
CASTROLIND stock is 3.61% volatile and has beta coefficient of 0.88. Track Castrol India Limited stock price on the chart and check out the list of the most volatile stocks — is Castrol India Limited there?
Today Castrol India Limited has the market capitalization of 186.75 B, it has increased by 0.52% over the last week.
Yes, you can track Castrol India Limited financials in yearly and quarterly reports right on TradingView.
Castrol India Limited is going to release the next earnings report on Feb 3, 2026. Keep track of upcoming events with our Earnings Calendar.
Castrol India Limited revenue for the last quarter amounts to 13.63 B INR, despite the estimated figure of 13.53 B INR. In the next quarter, revenue is expected to reach 13.97 B INR.
CASTROLIND net income for the last quarter is 2.28 B INR, while the quarter before that showed 2.44 B INR of net income which accounts for −6.64% change. Track more Castrol India Limited financial stats to get the full picture.
Castrol India Limited dividend yield was 4.31% in 2024, and payout ratio reached 90.67%. The year before the numbers were 4.17% and 85.85% correspondingly. See high-dividend stocks and find more opportunities for your portfolio.
As of Nov 24, 2025, the company has 835 employees. See our rating of the largest employees — is Castrol India Limited on this list?
EBITDA measures a company's operating performance, its growth signifies an improvement in the efficiency of a company. Castrol India Limited EBITDA is 13.56 B INR, and current EBITDA margin is 24.31%. See more stats in Castrol India Limited financial statements.
Like other stocks, CASTROLIND shares are traded on stock exchanges, e.g. Nasdaq, Nyse, Euronext, and the easiest way to buy them is through an online stock broker. To do this, you need to open an account and follow a broker's procedures, then start trading. You can trade Castrol India Limited stock right from TradingView charts — choose your broker and connect to your account.
Investing in stocks requires a comprehensive research: you should carefully study all the available data, e.g. company's financials, related news, and its technical analysis. So Castrol India Limited technincal analysis shows the neutral today, and its 1 week rating is sell. Since market conditions are prone to changes, it's worth looking a bit further into the future — according to the 1 month rating Castrol India Limited stock shows the buy signal. See more of Castrol India Limited technicals for a more comprehensive analysis.
If you're still not sure, try looking for inspiration in our curated watchlists.
If you're still not sure, try looking for inspiration in our curated watchlists.