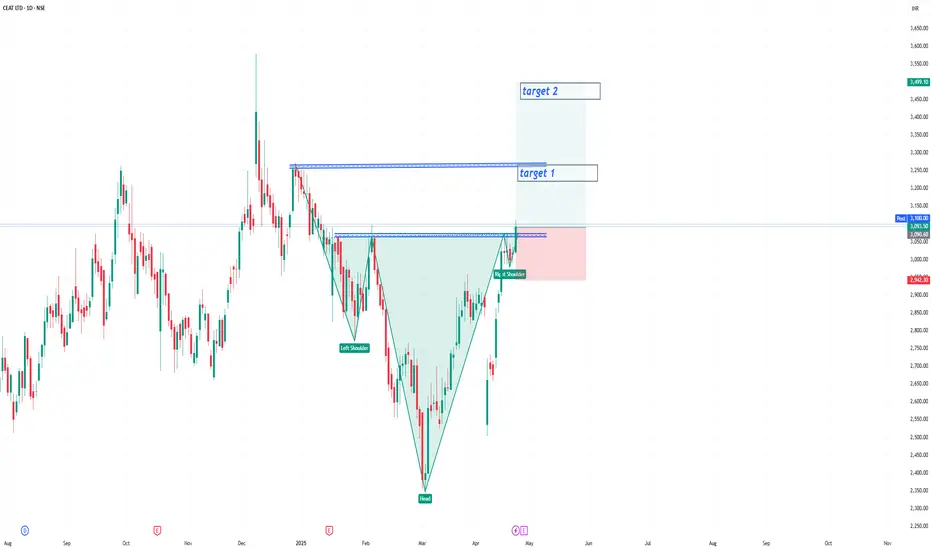
CEAT Ltd: Is a Rebound on the Horizon? A Confluence of TechnicalTraders — let’s dig into CEAT Ltd NSE:CEATLTD . where both demand-supply dynamics and classic technical signals are flashing something worth watching. What’s setting up here isn’t just noise — there’s real structure underneath the surface.
Demand Zone & Institutional Footprints
Let’s start
Next report date
≈
October 28
Report period
Q2 2025
EPS estimate
40.35 INR
Revenue estimate
36.96 B INR
106.55 INR
4.73 B INR
130.93 B INR
19.90 M
About CEAT LTD
Sector
Industry
CEO
Arnab Banerjee
Website
Headquarters
Mumbai
Founded
1958
ISIN
INE482A01020
FIGI
BBG000CPTJW2
CEAT Ltd. engages in the manufacture and sale of automotive tyres, tubes, and flaps. It offers tyres to all user segments and manufacturers for all vehicles including heavy-duty trucks and buses, light commercial vehicles, earthmovers, forklifts, tractors, trailers, cars, auto-rickshaws, motorcycles, and scooters,. The company was founded on March 10, 1958 and is headquartered in Mumbai, India.
2.5%
3.1%
3.7%
4.3%
4.9%
Q1 '24
Q2 '24
Q3 '24
Q4 '24
Q1 '25
0.00
9.00 B
18.00 B
27.00 B
36.00 B
Revenue
Net income
Net margin %
Revenue
COGS
Gross profit
Op expenses
Op income
Non-Op income/ expenses
Taxes & Other
Net income
0.00
9.00 B
18.00 B
27.00 B
36.00 B
Revenue
COGS
Gross profit
Expenses & adjustments
Net income
0.00
9.00 B
18.00 B
27.00 B
36.00 B
Q1 '24
Q2 '24
Q3 '24
Q4 '24
Q1 '25
0.00
6.00 B
12.00 B
18.00 B
24.00 B
Debt
Free cash flow
Cash & equivalents
No news here
Looks like there's nothing to report right now
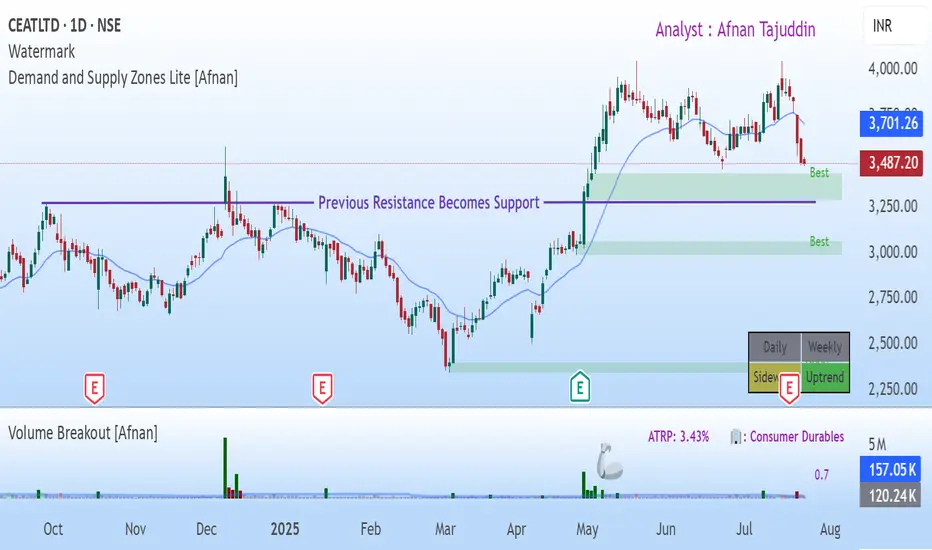
CEATLTD Price actionCEAT Ltd has recently shown a recovery in its price action after a period of volatility. The stock closed at ₹3,645.30, rebounding over 2% in the latest session following a brief dip earlier in the week. Over the past month, CEAT experienced a mild correction, with the price dropping about 4%, but t

BUY TODAY SELL TOMORROW for 5%DON’T HAVE TIME TO MANAGE YOUR TRADES?
- Take BTST trades at 3:25 pm every day
- Try to exit by taking 4-7% profit of each trade
- SL can also be maintained as closing below the low of the breakout candle
Now, why do I prefer BTST over swing trades? The primary reason is that I have observed that

CEATAfter a multiyear breakout of 6 year from 2017-2023 lost momentum was back to retest zone near 2300-2400 zone seeing strong buying interest any fall towards 3000-3200 range in coming weeks would be good long opportunity for big bounce towards 5000-6000 range .view fails if monthly start closing belo

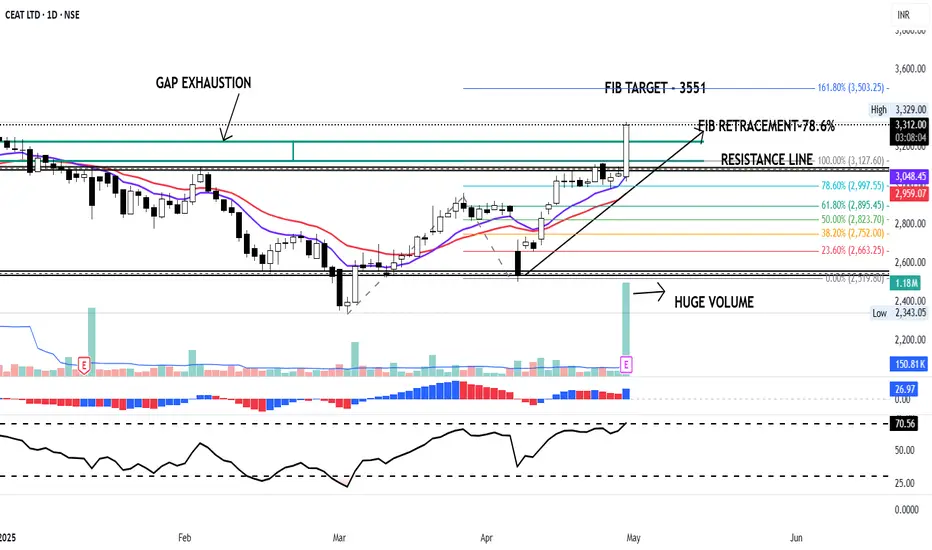
CEAT - Bullish Price actions satisfies following conditions.
1) Supertrend cross over 50 DMA
2) 50 DMA cross over 200 DMA
3) daily vol > 30 DMA Vol
4) ADX > 25
Breakout has already come and hence the stock will rise with all its might. Targets are marked as per Fibonacci retracement
The study is for academic p

Ceat- Rounding Bottom Breakout, cruising towards 5000 ?Ceat made a rounding bottom breakout on its daily chart. The target price of this pattern comes to 5000.
I already published an article on Ceat () in which I talked about Fibonacci Retracement and Targets. It looks like the Ceat is cruising along and will soon achieve its target in near term.
Fun

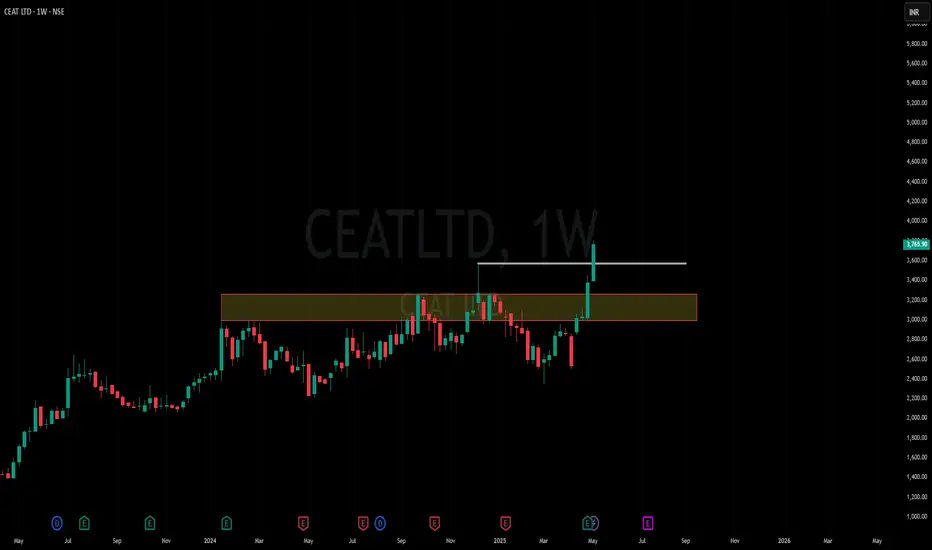
Amazing breakout on WEEKLY Timeframe - CEATLTDCheckout an amazing breakout happened in the stock in Weekly timeframe, macroscopically seen in Daily timeframe. Having a great favor that the stock might be bullish expecting a staggering returns of minimum 25% TGT. IMPORTANT BREAKOUT LEVELS ARE ALWAYS RESPECTED!
NOTE for learners: Place the break
CEAT on a roll.Ceat announced its quarterly results on 29.4.2025 and the market gave big thumbsup to its numbers making the stock price surge up to 8% to Rs.3300 at the time of writing.
On the technical charts CEAT is looking very strong for the more upmove ahead. The stock has broken out of its Resitance zone of
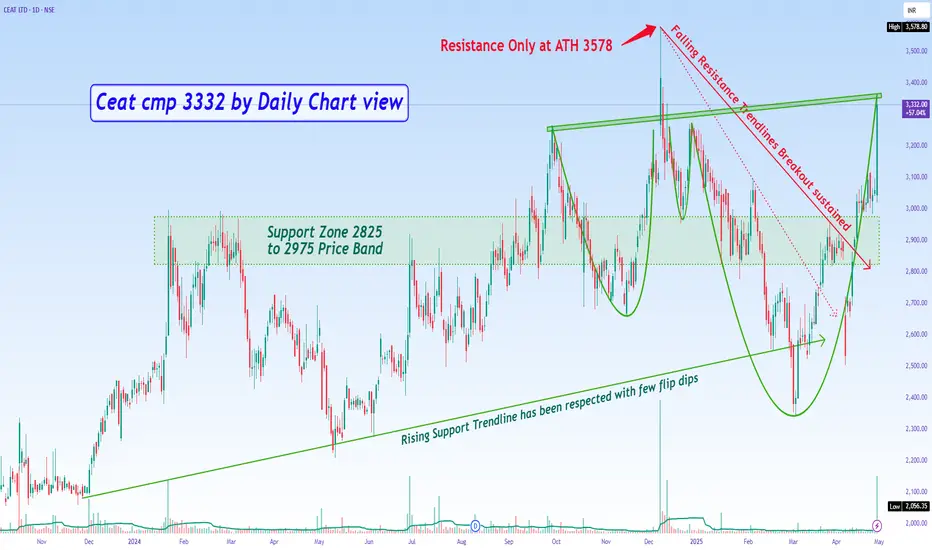
Ceat cmp 3332 by Daily Chart viewCeat cmp 3332 by Daily Chart view
- Resistance Only at ATH 3578
- Support Zone 2825 to 2975 Price Band
- Falling Resistance Trendlines Breakout sustained
- Back to Back Bullish Rounding Bottoms completed
- Rising Support Trendline has been respected with few flip dips
- Heavy Volumes surge on 30-Ap
CEAT Ltd | Cup and Handle Breakout | Targets Ahead CEAT Ltd has formed a classic Cup & Handle pattern on the daily chart, indicating a strong bullish continuation setup.
Breakout supported by increasing volume
Retest zone: 3,000 – 3,050 (Good entry opportunity)
SL: 2,870 (below handle support)
📈 Targets:
T1: 3,300
T2: 3,500
T3: 3,900 (measure
See all ideas
Summarizing what the indicators are suggesting.
Neutral
SellBuy
Strong sellStrong buy
Strong sellSellNeutralBuyStrong buy
Neutral
SellBuy
Strong sellStrong buy
Strong sellSellNeutralBuyStrong buy
Neutral
SellBuy
Strong sellStrong buy
Strong sellSellNeutralBuyStrong buy
An aggregate view of professional's ratings.
Neutral
SellBuy
Strong sellStrong buy
Strong sellSellNeutralBuyStrong buy
Neutral
SellBuy
Strong sellStrong buy
Strong sellSellNeutralBuyStrong buy
Neutral
SellBuy
Strong sellStrong buy
Strong sellSellNeutralBuyStrong buy
Displays a symbol's price movements over previous years to identify recurring trends.
Frequently Asked Questions
The current price of CEATLTD is 3,398.40 INR — it has increased by 1.36% in the past 24 hours. Watch CEAT LTD stock price performance more closely on the chart.
Depending on the exchange, the stock ticker may vary. For instance, on NSE exchange CEAT LTD stocks are traded under the ticker CEATLTD.
CEATLTD stock has fallen by −3.21% compared to the previous week, the month change is a −6.91% fall, over the last year CEAT LTD has showed a 26.43% increase.
We've gathered analysts' opinions on CEAT LTD future price: according to them, CEATLTD price has a max estimate of 4,600.00 INR and a min estimate of 2,900.00 INR. Watch CEATLTD chart and read a more detailed CEAT LTD stock forecast: see what analysts think of CEAT LTD and suggest that you do with its stocks.
CEATLTD reached its all-time high on Jul 15, 2025 with the price of 4,044.00 INR, and its all-time low was 13.70 INR and was reached on Sep 17, 2001. View more price dynamics on CEATLTD chart.
See other stocks reaching their highest and lowest prices.
See other stocks reaching their highest and lowest prices.
CEATLTD stock is 4.20% volatile and has beta coefficient of 1.18. Track CEAT LTD stock price on the chart and check out the list of the most volatile stocks — is CEAT LTD there?
Today CEAT LTD has the market capitalization of 135.52 B, it has increased by 2.11% over the last week.
Yes, you can track CEAT LTD financials in yearly and quarterly reports right on TradingView.
CEAT LTD is going to release the next earnings report on Oct 28, 2025. Keep track of upcoming events with our Earnings Calendar.
CEATLTD earnings for the last quarter are 28.50 INR per share, whereas the estimation was 34.50 INR resulting in a −17.39% surprise. The estimated earnings for the next quarter are 40.35 INR per share. See more details about CEAT LTD earnings.
CEAT LTD revenue for the last quarter amounts to 35.29 B INR, despite the estimated figure of 35.09 B INR. In the next quarter, revenue is expected to reach 36.96 B INR.
CEATLTD net income for the last quarter is 1.12 B INR, while the quarter before that showed 994.90 M INR of net income which accounts for 13.03% change. Track more CEAT LTD financial stats to get the full picture.
Yes, CEATLTD dividends are paid annually. The last dividend per share was 30.00 INR. As of today, Dividend Yield (TTM)% is 0.90%. Tracking CEAT LTD dividends might help you take more informed decisions.
CEAT LTD dividend yield was 1.04% in 2024, and payout ratio reached 25.67%. The year before the numbers were 1.12% and 18.88% correspondingly. See high-dividend stocks and find more opportunities for your portfolio.
As of Jul 30, 2025, the company has 9.21 K employees. See our rating of the largest employees — is CEAT LTD on this list?
EBITDA measures a company's operating performance, its growth signifies an improvement in the efficiency of a company. CEAT LTD EBITDA is 14.79 B INR, and current EBITDA margin is 10.54%. See more stats in CEAT LTD financial statements.
Like other stocks, CEATLTD shares are traded on stock exchanges, e.g. Nasdaq, Nyse, Euronext, and the easiest way to buy them is through an online stock broker. To do this, you need to open an account and follow a broker's procedures, then start trading. You can trade CEAT LTD stock right from TradingView charts — choose your broker and connect to your account.
Investing in stocks requires a comprehensive research: you should carefully study all the available data, e.g. company's financials, related news, and its technical analysis. So CEAT LTD technincal analysis shows the neutral today, and its 1 week rating is neutral. Since market conditions are prone to changes, it's worth looking a bit further into the future — according to the 1 month rating CEAT LTD stock shows the buy signal. See more of CEAT LTD technicals for a more comprehensive analysis.
If you're still not sure, try looking for inspiration in our curated watchlists.
If you're still not sure, try looking for inspiration in our curated watchlists.