Chambal fertiChambal fertilizer again a re-rating candidate looking good above 500 but see the upper trendline too
Trade ideas

CHAMBLFERTStock was trading in a range and given breakout volumes are also good. Buy above 485, TGT 540+, SL 440. For educational purpose only. Kindly contact your financial advisor before entering any trade.

PERFECT SELL (SHORT) IN THIS SHARE.......PERFECT SELL IN THIS SHARE FOR 2 REASONS..
1- Take resistance from its resistance level.
2- make DOUBLE TOP PATTERN.

Possible Rounding Bottom formation in Chamblfert In a day chart Chambalfert forming Rounding bottom formation and stock is in its all time high @493.50 So, if it break that 493-500 Range with good volume can go till 630 range. Fundamentally company is not bad but there is 19% pledge. So do your own analysis before invest.

ChambalFert - ShortTerm analysisPossible Trades
- Current price is in entry zone
- Enter at the LTP and look for target - 484 and 512+
-Risk Free trade
- Can give multiple entry zone in coming months(Stay tuned - Will be updated)
Thanks
- Stock Explorers

CHAMBAL FERTILISER : Long term positive outlookNSE:CHAMBLFERT shows strong buy indicated by PSAR, MACD & Fisher crossover followed by EMA & MA Crossover
Target 1: 485.80
Stop Loss: 441.35
𝑫𝒊𝒔𝒄𝒍𝒂𝒊𝒎𝒆𝒓:
The analysis is only for illustration purposes only. Please consult your financial advisor, agent, broker before acting on any information. We may or may not have positions in the stock and our actions may be contrary to the one mentioned here. This analysis may or may not be updated. We would not be responsible for the profit/loss resulting from this analysis.

Chambalfert @ 476 target 500/520Chambalfert @ 476 should target 500 / 520 shortly considering its open interest longs

CHAMBAL FERTILISERSBuy ChambalFert Abv 486 On CLBS
Resistance 485
GOOD VOLUME SEEN TODAY AS WELL....
ALSO STOCK IS GOOD TO HOLD FOR LONG TERM
Target : 498/519/525


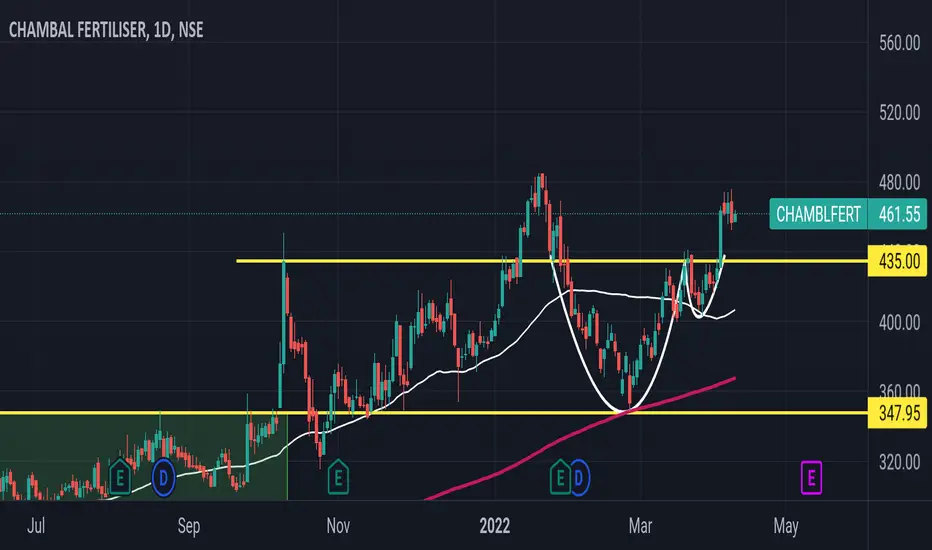
Chambal Fertilizers - Cup and Handle Breakout viewChambal Fertilizer :
Cup and Handle Breakout in progress
Looks good for 480 in short term
Support at 435


Chambal Fertilisers about to make continues big moves.The ban on Russian and Belarusian commodities is producing shortages of commodities in world market. Belarus caters most of the fertilizer requirement of world, and this is in shortage now. Food shortage is expected in coming years. Place yourself in a scrip which is better placed in Indian context. Chambal Fertilisers is the one which is going to benefit the most. If you are holding cheers, and if you want more, you can buy it at CMP.
Technical Chart is self sufficient to explain itself. On a daily chart Bullish Engulfing pattern is observed and on a weekly chart breakout of W pattern is observed. First target of 650 will be achieved very quickly as the rocket is about to take off. It has potential to reach target of 750-800 range in a very short term. Wouldn't be surprised if it starts hitting upper circuit from tomorrow on-wards.
Disclaimer: For educational purpose.

ChamblfertChamblfert...is looking strong ...any how the chemical sector is looking strong....GNFC,CHABLFERT and many more...


CHAMBALFERT 12%+ 440 LONG TRADE WATCHNSE:CHAMBLFERT
Trade Logic | 20 DMA BREAK STOCK. WATCH FOR LONG
Entry 391
Stop 374
Target 438
RR 2.0+ 2nd Target Open
Details on chart as always
1 FREE trade idea Daily/Weekly.
Trade Size 5%- 10% Max
Max Trades 10-20/ Month
Time Frame 1 WEEK - 1 MONTH. Max
Diversify Bet Small Lose less. | Our Motto.
#TRADEWORLD | #MARKET_MAGIC
----**All Stocks Shared are in My Personal Trade Portfolio***----
TEST FIRST / THEN TRADE

Chambalfertiliser looking good abv 420chambal fertiliser moving in upward channel..
moving towerds 450++
views are educational

BUY CE AT 420-On daily chart, its showing strong uptrend and parallel increasing trendlines confirms the trend.
- RSI >60
- Supertrend indicates buy signal
- 20 EMA crossing over 50EMA from below
- Near term target is 484 and SL is 414.
- ADX indicates strong trend
- Stock closed on upper BB .

Chamble fertilisers is looking goodChamble is taking support on 20 EMA. I am going to add my second tranche at the current level on the S.L. of 20 EMA

CHANBLFERT LongLooks good for a move up , levels plotted on chart
Disclaimer:
The content of the idea and the interpretation of data are solely my personal views which being said I do not warrant its completeness or accuracy.
This idea published is purely intended for educational and informative purposes, I urge traders to make their own trading decisions based on their specific trading objectives and financial position

Chambal Fertilizers Ltd - 04.03.2022Chambal Fertilizers Ltd - 04.03.2022
The stock is trading @ 390 levels
There is a SUPPORT Zone @ 370 levels
Stochastic is oversold in Weekly Charts
The prices are above EMA
Stochastic is overbought in Daily Chart
RSI is 53 in Weekly Chart
RSI is overbought in Monthly Chart
Watch out for the price action
Let the prices go above 405

Chambal Fertilizer - Expect some positive moveMorning Star Pattern at the Demand Zone along with +ve divergence with RSI
Lets see how this plays out

CHAMBERFERT FOR 18 FEB INTRADAY LEVELIntraday level has been given so play according to level and entry at 15 min candle closing
