CHAMBLFERT bullish breakout above 575..?? - 27th Feb. CHAMBLFERT: Bullish if ~8 month long consolidation range (@575)is broken on good volumes and sustains.
The above information does not constitute investment/trading recommendation and it is purely for educational purpose....
INTRADAY Trading Strategy in 3 stages of breakouts:
1) Impulse upmove stage: The strong upmove (nearly upto 1.5% from trigger-price) happens within five minutes. "High Risk Traders" buy on breakouts in hope of continuation of upmove. "High Risk Traders" may have to patiently wait through the Pullback-Consolidation stage to realize profits. High risk:High reward set up as breakouts may fakeout (reversal)also
2) Pullback-Consolidation stage: After the above "Impulse upmove stage"; the price may then pull back and move sideways (between "Open" price and "High" of the above "Impulse upmove stage"). "Safe traders" with minimum risk profile wait for a breakout from the consolidation stage to enter into trade , to book high profits in the final "Breakout continuation" stage
3) Breakout continuation: Stocks often in the third stage breaks up above the "High" of the first "Impulse upmove stage" and continue to go higher again.(another 2-3%)
Both Safe Traders/High Risk Traders book profits at this stage
SWING Trading Strategy:
Position is kept open, only upon stock closing above the entry price on day closing basis and is held on for 5-10 trading sessions for larger gains (5-10%)
The above information do not constitute, financial, investment, trading, or other types of advice or recommendation. It is purely for educational purpose....
Trade ideas

Chambal Fertilisers Nearing Breakout: Key Levels to WatchChambal Fertilisers and Chemicals Ltd is close to hitting a breakout point at ₹575, with its current price at ₹564. If it pushes past ₹575, it could start climbing higher. The next possible levels to watch are ₹585, ₹595, and ₹625.

Chambl-Fertilizer watch for breakoutLet's analyze **Chambal Fertilizers and Chemicals Ltd. (CHAMBLFERT)** from both a **fundamental** and **technical** perspective.
### **Fundamental Analysis of Chambal Fertilizers & Chemicals Ltd. (CHAMBLFERT)**
#### **Overview of Chambal Fertilizers & Chemicals Ltd.**
- **Sector:** Fertilizers & Agrochemicals
- **Industry:** Fertilizers, Chemicals
- **Founded:** 1985
- **Headquarters:** Kota, Rajasthan, India
- **Market Cap:** Approx. ₹20,000 crore (as per the latest data)
Chambal Fertilizers & Chemicals Ltd. is one of India’s leading manufacturers and marketers of fertilizers. The company primarily produces Urea and other nitrogenous fertilizers. It is part of the **SKS Group**, which has a strong presence in the Indian agricultural and chemical sectors.
#### **Key Financials (Latest Report)**
- **Revenue Growth:** Chambal Fertilizers has shown consistent growth, driven by increased demand for fertilizers, especially in India’s agricultural sector. The company's revenue is sensitive to changes in fertilizer subsidies, raw material costs, and government policies.
- **Profitability:** The company has maintained stable profitability due to its scale and integrated operations, with a focus on efficient production. Chambal Fertilizers benefits from favorable subsidies provided by the Indian government to the fertilizer sector.
- **Debt Levels:** Chambal Fertilizers has a moderate debt-to-equity ratio typical for companies in the capital-intensive fertilizer industry. The company’s debt levels have been manageable, as it generates stable cash flows.
- **Cash Flows:** The company benefits from a predictable cash flow structure due to the government support for fertilizers. However, fluctuations in raw material costs and subsidy payments can affect cash flow in the short term.
#### **Valuation Ratios**
- **P/E Ratio:** Chambal Fertilizers has a relatively low P/E ratio compared to many other sectors, which is typical for companies in the fertilizer space. The P/E ratio is influenced by the company's steady revenue and stable margins.
- **P/B Ratio:** The price-to-book ratio of Chambal Fertilizers is generally moderate, reflecting its asset base and efficient management of capital.
- **Dividend Yield:** Chambal Fertilizers has a strong dividend track record, reflecting its stable earnings and cash flow generation. Investors in this stock typically benefit from a regular dividend payout.
#### **Industry & Macro Trends**
- **Fertilizer Demand in India:** India remains one of the largest consumers of fertilizers due to its large agricultural sector. Government subsidies and policies support demand for fertilizer products, including urea and other nitrogenous fertilizers.
- **Subsidy Support:** The Indian government has a significant impact on the fertilizer sector due to subsidies for urea. Any changes in subsidy policy can influence the profitability of companies like Chambal Fertilizers.
- **Raw Material Costs:** Chambal Fertilizers' margins are sensitive to fluctuations in raw material costs, such as natural gas (used for urea production), which can affect production costs.
- **Agricultural Growth:** The growth in India’s agricultural output, including increased acreage for key crops like wheat and rice, directly impacts the demand for fertilizers.
- **Competition:** Chambal Fertilizers faces competition from other major fertilizer producers like National Fertilizers Ltd., IFFCO, and Rashtriya Chemicals and Fertilizers (RCF).
---
### **Technical Analysis of Chambal Fertilizers & Chemicals Ltd. (CHAMBLFERT)**
Let’s evaluate the **technical outlook** of Chambal Fertilizers, based on its stock price patterns and key levels:
#### **Price Action:**
- **Current Price:** Chambal Fertilizers' stock price tends to move in tandem with the overall agricultural and chemical sector sentiment. The price may consolidate within a range depending on the broader market conditions and agricultural output forecasts.
#### **Key Levels:**
- **Support Levels:**
- **₹300-₹320:** This range could be considered as the first level of support. If the stock approaches this level and bounces, it would suggest buying interest around this zone.
- **₹280-₹290:** If the stock falls below the ₹300 level, the ₹280-₹290 range could act as a secondary support level, marking a strong point for potential price stabilization or reversal.
- **Resistance Levels:**
- **₹350-₹370:** This level is a critical resistance zone, where selling pressure might emerge. A breakout above this level could signal bullish movement in the stock.
- **₹400:** This is a key psychological resistance level. If the stock breaks above ₹400 with strong volume, it could indicate further upside potential.
#### **Moving Averages:**
- **50-Day Moving Average (50-MA):** If the stock is trading above the 50-day moving average, it suggests short-term bullish momentum. A cross below the 50-MA could signal weakness.
- **200-Day Moving Average (200-MA):** This is the key indicator for long-term trends. If the stock is above the 200-day MA, it suggests that the long-term trend remains bullish. If the stock is below, it could indicate a prolonged downtrend or neutral market conditions.
#### **Momentum Indicators:**
- **RSI (Relative Strength Index):**
- An RSI above 70 would indicate that the stock is overbought and might be due for a pullback.
- An RSI below 30 suggests oversold conditions and could present a buying opportunity if the stock shows signs of reversal.
- **MACD (Moving Average Convergence Divergence):**
- A positive MACD (when the MACD line crosses above the signal line) would suggest bullish momentum.
- A negative MACD (when the MACD line crosses below the signal line) would suggest weakening momentum.
#### **Volume Analysis:**
- **Volume Trends:** Pay attention to volume trends. If the stock rallies with increasing volume, it would suggest strong buying conviction. Conversely, declining volume during price increases may suggest a lack of conviction.
- **Volume Spikes:** A significant volume spike at key support or resistance levels could indicate that a breakout or breakdown is imminent.
---
### **Conclusion:**
- **Fundamental Strengths:**
- Chambal Fertilizers benefits from a stable and predictable demand for its products due to India’s large agricultural sector and government subsidies.
- The company has a robust track record of profitability, strong cash flows, and a shareholder-friendly dividend policy.
- It faces risks from raw material cost fluctuations and any changes in government subsidy policy but is well-positioned in the fertilizer market due to its scale and distribution reach.
- **Technical Outlook:**
- **Support levels:** ₹300-₹320 (primary) and ₹280-₹290 (secondary).
- **Resistance levels:** ₹350-₹370 (primary) and ₹400 (psychological resistance).
- The stock is likely to remain range-bound unless it breaks out of the key resistance levels. Watch for momentum indicators like the MACD and RSI for potential trend changes.
#### **Risks to Consider:**
- **Policy Risks:** Any changes in fertilizer subsidies or government regulations could impact profitability.
- **Commodity Price Volatility:** Rising raw material costs could compress margins.
---
**Disclaimer:**
The information provided is for educational purposes only and should not be construed as financial or investment advice. I am not a SEBI-registered advisor, and this analysis is not a recommendation to buy, sell, or hold any securities. Accuracy and timeliness of the data cannot be guaranteed. Always conduct your own research or consult with a professional before making investment decisions. I do not take responsibility for any losses incurred.

Chambal Fertilizers - Potential Darvas Box BreakChambal Fertilizers is consolidating making a Darvas Box. A break of Darvas Box might result in a good positional trade. Although as per Darvas, the industry needs to be in a growth phase, which is not the case here, however this trade if it triggers looks attractive.
Consult your financial advisor before entering any financial position, material for reference purpose only.

Chambal Fertilisers & Chemicals Ltd: Combined Technical and FundTechnical Analysis Insights:
Head and Shoulders Breakout:
The stock has completed a bullish Head and Shoulders pattern, breaking out of a 162-day consolidation range. This indicates strong buying momentum and the potential for further upside.
A price target of ₹642.95 has been projected, derived from the pattern, with intermediate retracement zones identified between ₹556–₹521.
Key Support/Resistance Levels:
The stock has breached the Supply Zone and is now trading above it. Multiple levels of support have been identified at ₹555.75, ₹524.20, ₹486.25, and ₹432.55, which may act as strong areas for price stability.
Fundamental Analysis Insights:
1. Revenue and Profit Growth:
*19% revenue growth and 25% profit after tax increase in the latest nine-month period.
*16% EBITA growth year-over-year, reflecting improved operational efficiency.
2. Operational Efficiency:
Operating units ran at optimal capacity, with a year-over-year increase in production and sales volumes, showcasing effective resource utilization and increasing market demand.
3. Product Expansion:
The company introduced two new crop protection products, expanding its portfolio to 64 products across 13 states, enhancing its competitive positioning in the agricultural sector.
4. Sustainability Focus:
Chambal Fertilisers entered into a research agreement with the Energy and Resources Institute to develop sustainable agricultural solutions. This partnership positions the company favorably in an industry increasingly prioritizing sustainability.
Combined Outlook:
Short-Term (Technical):
The technical breakout and projected target of ₹642.95 align with strong momentum and buying interest. The ₹556–₹521 retracement zone offers a potential entry point for investors seeking to benefit from the upward trend.
Long-Term (Fundamental):
The company’s solid revenue and profit growth, along with its expanded product portfolio and focus on sustainability, provide a strong foundation for future growth. This complements the technical breakout, signaling long-term value creation.
Disclaimer:
The information provided is for educational and informational purposes only and should not be considered as financial or investment advice. Investing in the stock market involves risks, and past performance is not indicative of future results. Conduct your own thorough research before making any investment decisions. The analysis provided does not guarantee any specific outcome.

Breakout in CHAMBAL FERTILIZERSSymmetrical Triangle Breakout
RSI above 65 and rising
Trading above EMA50
Volume spurt
Testing ATH
7+ months of consolidation
Disc: for study, not a recommendation

Chambal fertiliser a Breakout or a trap ?Chambal Fertilisers and Chemicals Ltd. is an interesting chart with following
1. RSI on all time frames (DWM) above 60
2. Narrowing Bollinger Bands on weekly chart and price walking on upper band
3. Break out of 8 month long consolidation in range of 440-540 zone
4. Strong weekly Engulfing candle and on daily chart strong Anchor candle with huge volume
5. On monthly charts stock made breakout of 2 year long consolidation (247 to 440 zone) in June 2024 and since then stock was consolidating and last week made a huge engulfing candle covering all previous candles
6. Major supports at 495 to 500 zone being 20 day, 50 day and 200 day SMA
Will it sustain and make a new high or will it fizzle out
Lets See How it evolves from here further
Disclaimer: NOT A BUY / SELL RECOMMENDATION I am not an expert I just share interesting charts here for educational purpose and not to be taken as buy/sell recommendation. Please seek expert opinion before investing and trading as trading/ investing in market is subject to market risks. I do hold small position in the stock as on date and I may look to take some position with my own Risk Reward matrix.

Amazing breakout on WEEKLY Timeframe - CHAMBLFERTCheckout an amazing breakout happened in the stock in Weekly timeframe, macroscopically seen in Daily timeframe. Having a great favor that the stock might be bullish expecting a staggering returns of minimum 25% TGT. IMPORTANT BREAKOUT LEVELS ARE ALWAYS RESPECTED!
NOTE for learners: Place the breakout levels as per the chart shared and track it yourself to get amazed!!
#No complicated chart patterns
#No big big indicators
#No Excel sheet or number magics
TRADE IDEA: WAIT FOR THE STOCK TO BREAKOUT IN WEEKLY TIMEFRAME ABOVE THIS LEVEL.
Checkout an amazing breakout happened in the stock in Weekly timeframe.
Breakouts happening in longer timeframe is way more powerful than the breakouts seen in Daily timeframe. You can blindly invest once the weekly candle closes above the breakout line and stay invested forever. Also these stocks breakouts are lifelong predictions, it means technically these breakouts happen giving more returns in the longer runs. Hence, even when the scrip makes a loss of 10% / 20% / 30% / 50%, the stock will regain and turn around. Once they again enter the same breakout level, they will flyyyyyyyyyyyy like a ROCKET if held in the portfolio in the longer run.
Time makes money, GREEDY & EGO will not make money.
Also, magically these breakouts tend to prove that the companies turn around and fundamentally becoming strong. Also the magic happens when more diversification is done in various sectors under various scripts with equal money invested in each N500 scripts.
The real deal is when to purchase and where to purchase the stock. That is where Breakout study comes into play.
LET'S PUMP IN SOME MONEY AND REVOLUTIONIZE THE NATION'S ECONOMY!

CHAMBELFERT BREAKOUTChambelfert shows breakout
It has good volume
Other factors also shows some bullishness
It may go up
Add to your watchlist and watch the price movement
Profit 5-10% expected in a month

Buying oppurtunity on "Chambal Fertilisers & Chemicals Ltd"Technical anlyisis : A strong weekly close above the all time high, inidactes a buying oppurtunity.

Breakout in chambal fertilizer Good opportunity in chambal fertilizer for breakout can make good up move

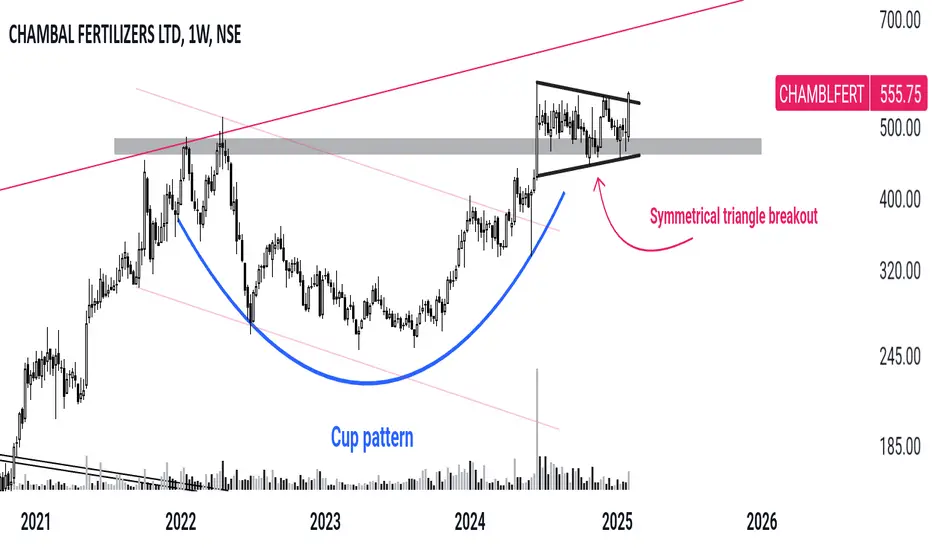
#CHAMBLFERTCup pattern breakout ✔️
RETEST ✅
Symmetrical triangle breakout ✔️
Volume ✔️
Pattern 👍
Price in ascending channel 👍
chambal firtilizersSwing Stock - #CHAMBLFERT
Pattern - Resistance
TF - 2 HR
Resistance Level - 512-514
Possible Target - 530/545+
happy trading!!!
The intrinsic value of one CHAMBLFERT stock under the Base Case scenario is 582.04 INR. Compared to the current market price of 494 INR, Chambal Fertilisers and Chemicals Ltd is Undervalued by 15%


Chambal Fertiliser a 6 month consolidation will it breakout ?Chambal Fertilisers and Chemicals Ltd. is another interesting chart to keep on radar with following
1. RSI on all time frames (DWM) is at or above 60
2. Narrowing Bollinger Bands on daily chart with price walking on upper band
3. ABCD pattern under formation on weekly chart with fib-extension targets of 639-694
4. 6 month long consolidation on daily chart within channel of 440-530 zone
5. Major Supports are as under:
20 SMA (weekly) 491
20 SMA (Daily) 478
50 EMA (Daily) 483
With cluster of supports in area of 478-492 lets see if it breaks out of its consolidation or continues its consolidation
Lets See How it Evolves.
Disclaimer: NOT A BUY / SELL RECOMMENDATION I am not an expert I just share interesting charts here for educational purpose and not to be taken as buy/sell recommendation. Please seek expert opinion before investing and trading as trading/ investing in market is subject to market risks. I do not hold any position in the stock as on date but I may look to take some position with my own Risk Reward matrix.

Chambal - IntradayChambal Fertilizers: Intraday
Support Breakdown
Looks weak below 454, quick 440 looks feasible

Chambal Fertilizers & Chemicals LimitedBuy above 550
All important points are marked.
𝐃𝐢𝐬𝐜𝐥𝐚𝐢𝐦𝐞𝐫: 𝐈𝐧𝐯𝐞𝐬𝐭𝐦𝐞𝐧𝐭 𝐢𝐧 𝐬𝐞𝐜𝐮𝐫𝐢𝐭𝐢𝐞𝐬 𝐦𝐚𝐫𝐤𝐞𝐭 𝐚𝐫𝐞 𝐬𝐮𝐛𝐣𝐞𝐜𝐭 𝐭𝐨 𝐦𝐚𝐫𝐤𝐞𝐭 𝐫𝐢𝐬𝐤𝐬, 𝐫𝐞𝐚𝐝 𝐚𝐥𝐥 𝐭𝐡𝐞 𝐫𝐞𝐥𝐚𝐭𝐞𝐝 𝐝𝐨𝐜𝐮𝐦𝐞𝐧𝐭𝐬 𝐜𝐚𝐫𝐞𝐟𝐮𝐥𝐥𝐲 𝐛𝐞𝐟𝐨𝐫𝐞 𝐢𝐧𝐯𝐞𝐬𝐭𝐢𝐧𝐠. 𝐒𝐭𝐨𝐜𝐤𝐬 𝐬𝐮𝐠𝐠𝐞𝐬𝐭𝐞𝐝 𝐢𝐧 𝐭𝐡𝐢𝐬 𝐠𝐫𝐨𝐮𝐩 𝐚𝐫𝐞 𝐟𝐨𝐫 𝐞𝐝𝐮𝐜𝐚𝐭𝐢𝐨𝐧 𝐩𝐮𝐫𝐩𝐨𝐬𝐞. 𝐖𝐞 𝐝𝐨𝐧𝐭 𝐦𝐚𝐤𝐞 𝐚𝐧𝐲 𝐩𝐫𝐨𝐟𝐢𝐭𝐬 𝐟𝐫𝐨𝐦 𝐭𝐡𝐢𝐬 𝐫𝐞𝐜𝐨𝐦𝐦𝐞𝐧𝐝𝐚𝐭𝐢𝐨𝐧𝐬 𝐞𝐯𝐞𝐫𝐲𝐭𝐡𝐢𝐧𝐠 𝐬𝐡𝐚𝐫𝐞𝐝 𝐡𝐞𝐫𝐞 𝐚𝐫𝐞 𝐜𝐨𝐦𝐩𝐥𝐞𝐭𝐞𝐥𝐲 𝐨𝐟 𝐟𝐫𝐞𝐞 𝐨𝐟 𝐜𝐨𝐬𝐭.

breakout in chambal fertilizersstock breakout after making vcp kind of structure for almost 3 months of consolidation
sector is positive watch for other fertilizer stocks like deepak fertilizers

CHAMBLFERT CHAMBLFERT has given breakout with decent volume. This time it may come out of long consolidation. Other stocks from fertilizer and chemical sector has also shown momentum.

Chambal Fertilizers : Triangle Breakout viewChambal Fertilizers:
Symmetric Triangle breakout possibility
Need to sustain 540 levels

chambal fertiliser analysis consolidation range-Chambal Fertilisers & Chemicals Ltd. (CHAMBLFERT) is a chemical sector stock currently trading within a range of ₹480 to ₹540 per share. The stock has been consolidating recently, suggesting a potential accumulation phase. If the price breaks through the upper resistance level of ₹540 with strong volume, it could signal a bullish uptrend.

Bullish Flag Pattern about to Break on WeeklyNSE:CHAMBLFERT The Bullish flag pattern Breakout will be confirmed after a sustained move above 543 and the stock may move toward the pattern target of 768 after the breakout keeping a stop loss of 473.
Check out my other stock ideas below until this trade gets activated, I would love your feedback.
Disclaimer: This analysis is intended solely for informational and educational purposes and should not be interpreted as financial advice. It is advisable to consult a qualified financial advisor or conduct thorough research before making investment decisions.

CHAMBLFERT - Ready for Channel Breakout* Chambal Fertilizers Ltd is a part of the agrochemical sector, primarily engaged in the production and distribution of fertilizers. It is a significant player in the Indian agricultural market, providing various types of fertilizers like Urea and other crop nutrients to support the farming community.
*The chart shows a consolidation pattern forming a rectangle or a channel, with the following key observations:
1. Consolidation Zone: The price has been moving sideways within a rectangular pattern, as marked by the points (1 to 6). This range has acted as both resistance and support multiple times.
2. Breakout Indication: The stock price has recently shown a breakout on the upside with momentum candles, indicating a bullish trend continuation. The rising volume supports the breakout.
*Entry: A good entry point would be on a retest of the breakout zone near ₹520–₹540.
*Target 1: Around ₹615
*Target 2: Around ₹675
*Extended Target: ₹750(if the momentum continues strongly)
*Stop-Loss Levels: ₹480
