triangle breakout donetriangle pattern breakout down let's see how dis stock perform after dis breakout.. will update levels tomorrow if i enter in dis stock
CHOLAFIN trade ideas

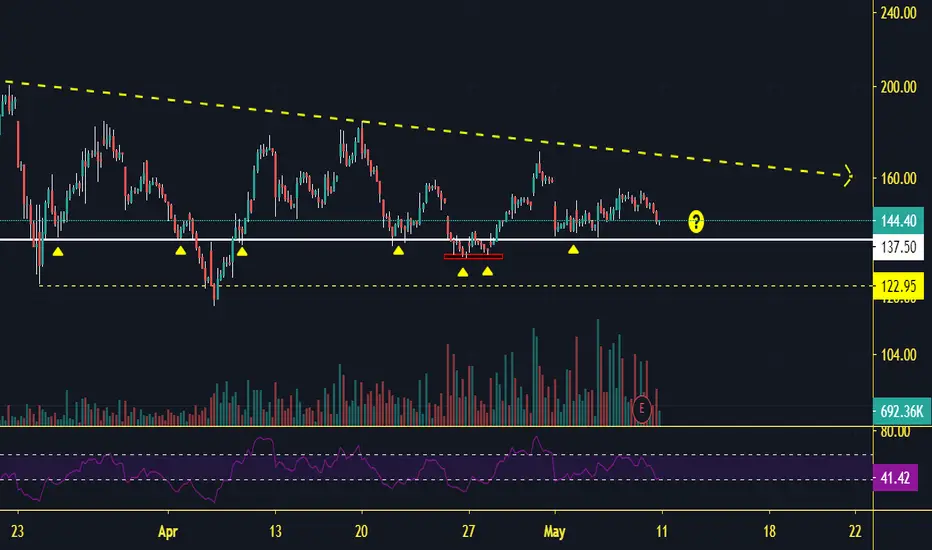
CHOLAFIN#POSITIONAL CHOLAFIN
1) The stock is showing massive volume expansion, the volume with which the stock fall is comparatively less than the buying volume.
2) one can accumulate this stock in range of 125-140

CHOLAFINTake trade based on your analysis
Buy/Short just above/below the marked line.
Typically for intraday start trailing your stop loss from 0.5% towards target
Stoploss is based on your capacity
I usually hedge towards the stoploss direction
if price opens between the target and entry line, I usually dont trade that scrip.
~

CHOLAMANDLAM INVNSE:CHOLAFIN
LOOKS WEAK BELOW 138
AFTER SEEING THE SHOULD I SAY SOME THING YOU YOUR SELF WILL UNDERSTAND WHAT IS GOING TO HAPPEN


hey i m new here .... suggest me if i mwrong...at 180 level there is resistance according to fibonacci so if it breaks there will be an upside movement.....
and according bearish flag , wait till breakout ..... after breakout, it will show a good downward movement .... most probably it will be a bearish movement.............only for education purpose


CholafinBullish candle formation will long on break of high of bullish candle with low as initial SL


Candlestick Patter Emerges here?Can this be called as a evening doji star bearish candlestick pattern ?


CHOLAFIN, Learn & Earn (S/R & Trend Line breakout)CHOLAFIN looks bullish as it has given breakout from both TL & Resistance zone. Can be long candidate above 184.5


CHOLA Finance Trading Setup (High Possibility)Looks like a very interesting pattern. Finding a Reverse Head and Shoulder Pattern at the bottom of a down trend is highly successful.

BUY FOR TARGET OF RS AROUND 180-190, Sttrict SL 150There is strong buying whenever any deep is coming you can clearly see in chart. so big money entered at lower level so upside are chance are huge possible.

Short Call for Intraday 13/04/2020 on CholaMandlam InvestmentAs we see on Chart of Chola Mandalam investment it is on their 200 EMA which it can resist from that level.

