Cipla Ltd.(CIPLA)By now, you should understand how important a date candle is in a time cycle, especially if it forms within multiple time cycles or if it's a date candle combined with two cycles. You can see how powerful it is by looking at the Nifty candle of November 11, 2025.
It feels like someone is supporting
Next report date
—
Report period
—
EPS estimate
—
Revenue estimate
—
67.35 INR
52.73 B INR
274.54 B INR
563.43 M
About Cipla Ltd
Sector
Industry
CEO
Umang Vohra
Website
Headquarters
Mumbai
Founded
1935
ISIN
INE059A01026
FIGI
BBG000CQ0HS0
Cipla Ltd. engages in the manufacture and distribution of healthcare products and bulk drugs. It operates through the following segments: Pharmaceuticals and New Ventures. The Pharmaceuticals segment develops, manufactures, sells and distributes generic or branded generic medicines as well as active pharmaceutical ingredients. The New Ventures segment includes the operations of the two wholly owned subsidiaries, Cipla Health Ltd., a consumer healthcare company and Cipla BioTec Pvt. Ltd, which is into the business of Biosimilars. The company was founded by Khwaja Abdul Hamied in 1935 and is headquartered in Mumbai, India.
Related stocks

CIPLA 1 Day Tiem Frame 📊 Current Snapshot (approx)
Last traded / Current Price (NSE / BSE): ~ ₹ 1,517
Today’s trading range (so far): Low ~ ₹ 1,505; High ~ ₹ 1,520.90
52-week range: Low ~ ₹ 1,335; High ~ ₹ 1,673.
🔹 Daily Pivot & Key Levels for CIPLA
Based on standard daily pivot-point analysis for today.
Level Type
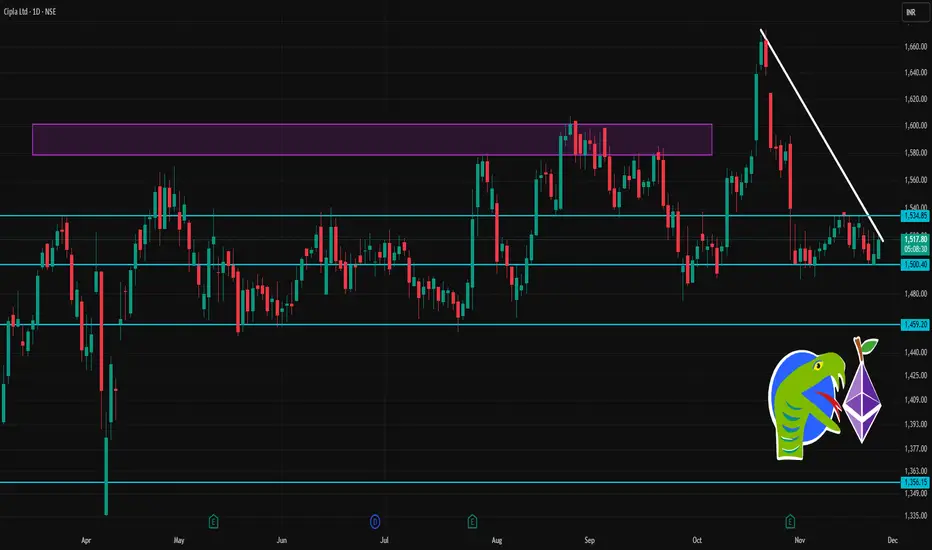
CIPLACIPLA looks strong, a breakout from this zone could trigger an upside move.
Price has already broken the previous resistance and retraced back to the 1500 zone, yet it didn’t break the previous swing low.
It’s consistently forming higher highs-higher lows, and steady volume is supporting each sma
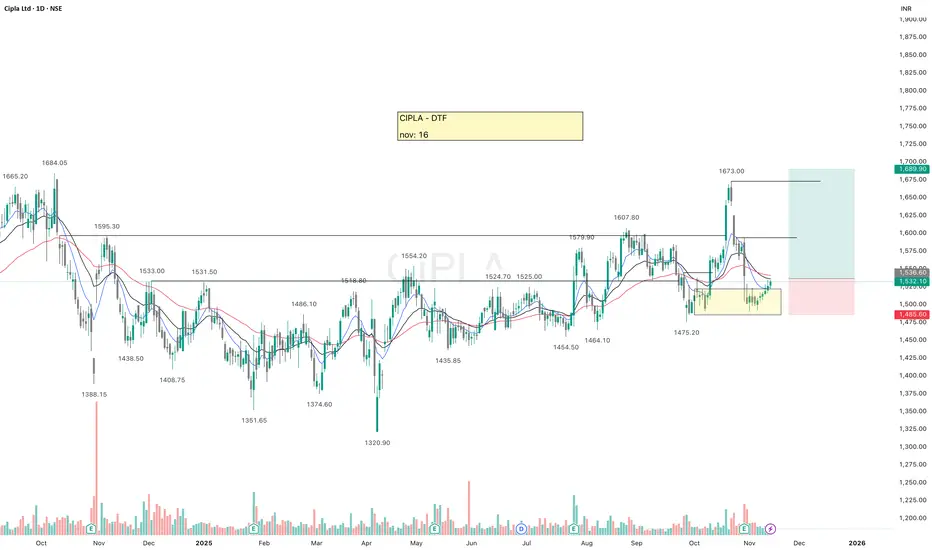
Potential Upside The Stock has potential upside for two reasons:
1. Stock is showing Uptrend with Higher lows and has taken support on trend line.
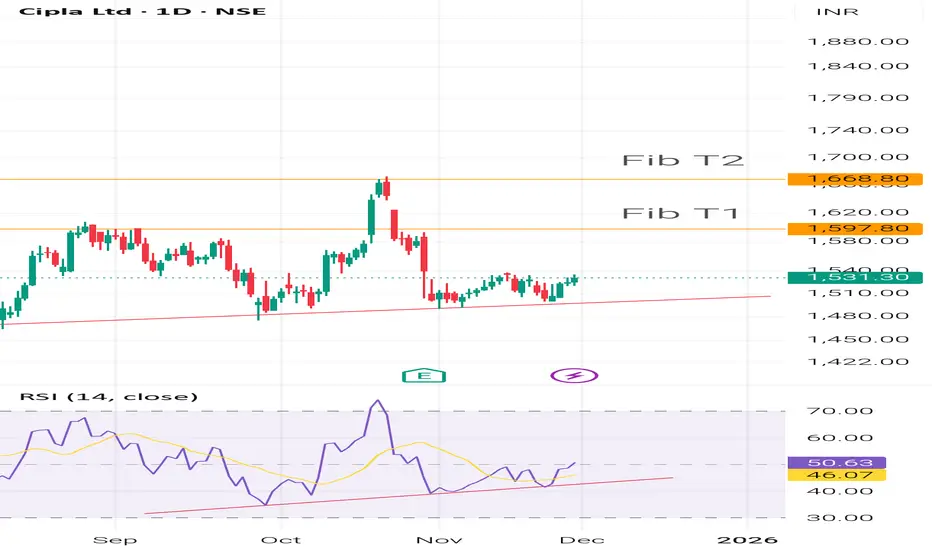
2. The Rsi of the stock is also supporting Uptrend.
The two targets can be set at the next Fibonacci Levels.
Retail Participation Surge via GIFT Nifty & Offshore Derivatives1. Understanding GIFT Nifty: India’s Gateway to Global Trading
The GIFT Nifty, previously known as the SGX Nifty, is a derivative contract based on the Nifty 50 Index, now traded on the India International Exchange (India INX) and the NSE International Exchange (NSE IX), both operating within the G

CIPLACIPLA - Long
🎯 Identify key demand & supply imbalances
📊 Execute trades with high-probability zones
📉 Emphasis on risk-to-reward optimization
🔍 Clean, chart-driven analysis only

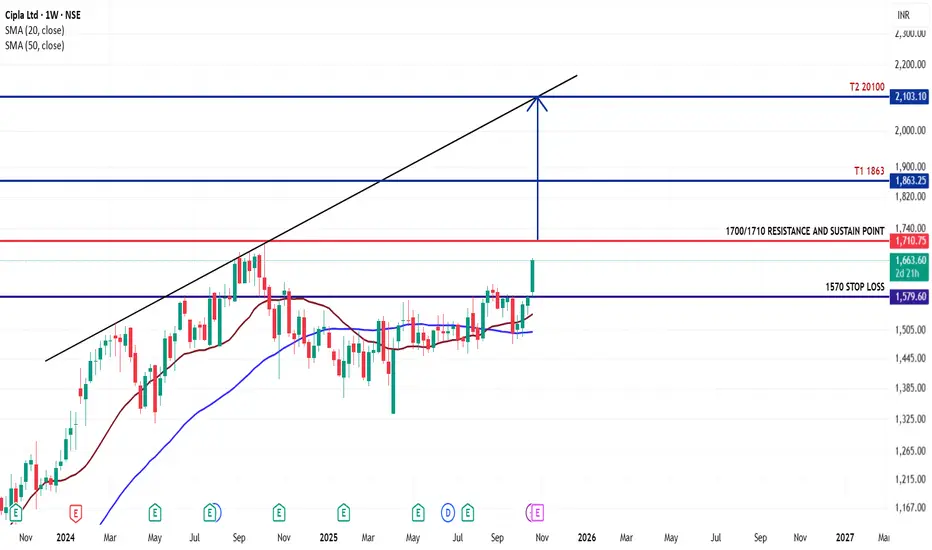
CIPLA TARGET 2000 STOP LOSS 1579Cipla weekly close is very good and above the strong resistance of 1579 and there is high possibility to sustain above 1700/1710 range. If monthly close above 1700 then the next target is 1863/2100.
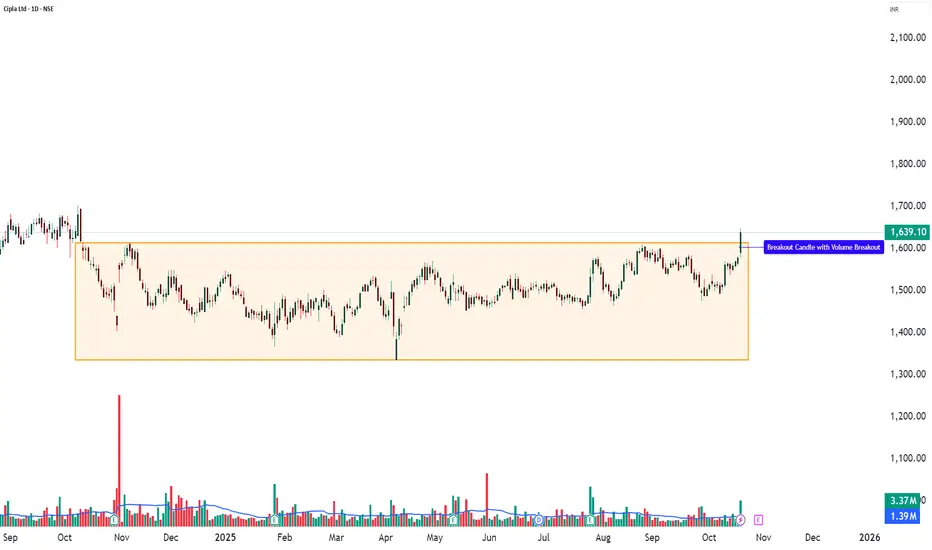
CIPLA – 10-Day Volume Breakout | Bullish Continuation Setup💹 Cipla Ltd (NSE: CIPLA)
Sector: Pharmaceuticals | CMP: ₹1,639.10 | View: Bullish Continuation Setup
🔹 Technical Analysis / Chart Pattern / Price Action / Volume Analysis:
Cipla Ltd shows strong bullish momentum with a clear breakout candle supported by a significant volume surge of 3,372,906 share
#Cipla - #ShortTerm #Inveatment IdeaCipla Ltd - Technical Analysis
Current Price: 1,639.10
Timeframe: Monthly Chart Analysis
This analysis utilizes:
- Monthly and Weekly timeframe analysis
- Fibonacci extension and retracement levels
- Support/resistance identification
- RSI momentum analysis
- Price action patterns
Technical Stru

Cipla is looking good to move upwardStock: CIPLA
Entry Price: ~ ₹1572-1575, Action: BUY
Target: 1650
Stop Loss: ₹1530

See all ideas
Summarizing what the indicators are suggesting.
Neutral
SellBuy
Strong sellStrong buy
Strong sellSellNeutralBuyStrong buy
Neutral
SellBuy
Strong sellStrong buy
Strong sellSellNeutralBuyStrong buy
Neutral
SellBuy
Strong sellStrong buy
Strong sellSellNeutralBuyStrong buy
An aggregate view of professional's ratings.
Neutral
SellBuy
Strong sellStrong buy
Strong sellSellNeutralBuyStrong buy
Neutral
SellBuy
Strong sellStrong buy
Strong sellSellNeutralBuyStrong buy
Neutral
SellBuy
Strong sellStrong buy
Strong sellSellNeutralBuyStrong buy
Displays a symbol's price movements over previous years to identify recurring trends.
Frequently Asked Questions
The current price of CIPLA is 1,531.30 INR — it has increased by 0.40% in the past 24 hours. Watch Cipla Ltd stock price performance more closely on the chart.
Depending on the exchange, the stock ticker may vary. For instance, on NSE exchange Cipla Ltd stocks are traded under the ticker CIPLA.
CIPLA stock has risen by 0.67% compared to the previous week, the month change is a −2.77% fall, over the last year Cipla Ltd has showed a 3.11% increase.
We've gathered analysts' opinions on Cipla Ltd future price: according to them, CIPLA price has a max estimate of 1,870.00 INR and a min estimate of 1,396.00 INR. Watch CIPLA chart and read a more detailed Cipla Ltd stock forecast: see what analysts think of Cipla Ltd and suggest that you do with its stocks.
CIPLA reached its all-time high on Oct 9, 2024 with the price of 1,702.05 INR, and its all-time low was 22.95 INR and was reached on Jan 1, 1999. View more price dynamics on CIPLA chart.
See other stocks reaching their highest and lowest prices.
See other stocks reaching their highest and lowest prices.
CIPLA stock is 1.00% volatile and has beta coefficient of 0.63. Track Cipla Ltd stock price on the chart and check out the list of the most volatile stocks — is Cipla Ltd there?
Today Cipla Ltd has the market capitalization of 1.24 T, it has increased by 0.87% over the last week.
Yes, you can track Cipla Ltd financials in yearly and quarterly reports right on TradingView.
Cipla Ltd is going to release the next earnings report on Jan 28, 2026. Keep track of upcoming events with our Earnings Calendar.
CIPLA earnings for the last quarter are 16.72 INR per share, whereas the estimation was 16.18 INR resulting in a 3.33% surprise. The estimated earnings for the next quarter are 14.73 INR per share. See more details about Cipla Ltd earnings.
Cipla Ltd revenue for the last quarter amounts to 75.89 B INR, despite the estimated figure of 73.91 B INR. In the next quarter, revenue is expected to reach 74.61 B INR.
CIPLA net income for the last quarter is 13.51 B INR, while the quarter before that showed 12.98 B INR of net income which accounts for 4.13% change. Track more Cipla Ltd financial stats to get the full picture.
Cipla Ltd dividend yield was 0.90% in 2024, and payout ratio reached 19.91%. The year before the numbers were 0.87% and 25.46% correspondingly. See high-dividend stocks and find more opportunities for your portfolio.
As of Nov 29, 2025, the company has 45.19 K employees. See our rating of the largest employees — is Cipla Ltd on this list?
EBITDA measures a company's operating performance, its growth signifies an improvement in the efficiency of a company. Cipla Ltd EBITDA is 71.99 B INR, and current EBITDA margin is 25.96%. See more stats in Cipla Ltd financial statements.
Like other stocks, CIPLA shares are traded on stock exchanges, e.g. Nasdaq, Nyse, Euronext, and the easiest way to buy them is through an online stock broker. To do this, you need to open an account and follow a broker's procedures, then start trading. You can trade Cipla Ltd stock right from TradingView charts — choose your broker and connect to your account.
Investing in stocks requires a comprehensive research: you should carefully study all the available data, e.g. company's financials, related news, and its technical analysis. So Cipla Ltd technincal analysis shows the buy rating today, and its 1 week rating is buy. Since market conditions are prone to changes, it's worth looking a bit further into the future — according to the 1 month rating Cipla Ltd stock shows the strong buy signal. See more of Cipla Ltd technicals for a more comprehensive analysis.
If you're still not sure, try looking for inspiration in our curated watchlists.
If you're still not sure, try looking for inspiration in our curated watchlists.