SMALLCAP Index at Make or Break Zone – Momentum Shift Brewing The Nifty Smallcap 100 index is currently trading at a critical confluence area, where a major horizontal support aligns with a long-term falling trendline resistance. After a prolonged corrective phase, price has shown a clear base formation near support, indicating selling pressure is gradually d
Nifty SmallCap 100 Index
No trades
Related indices

Reversal in Nifty SmallCap??Nifty SmallCap Index 100 has been trading in the range between 17400 and 17500.
This range acts a a strong support zone and we can expect a reversal soon.
The range could provide good opportunities for traders & investors to make investment decisions at this time.

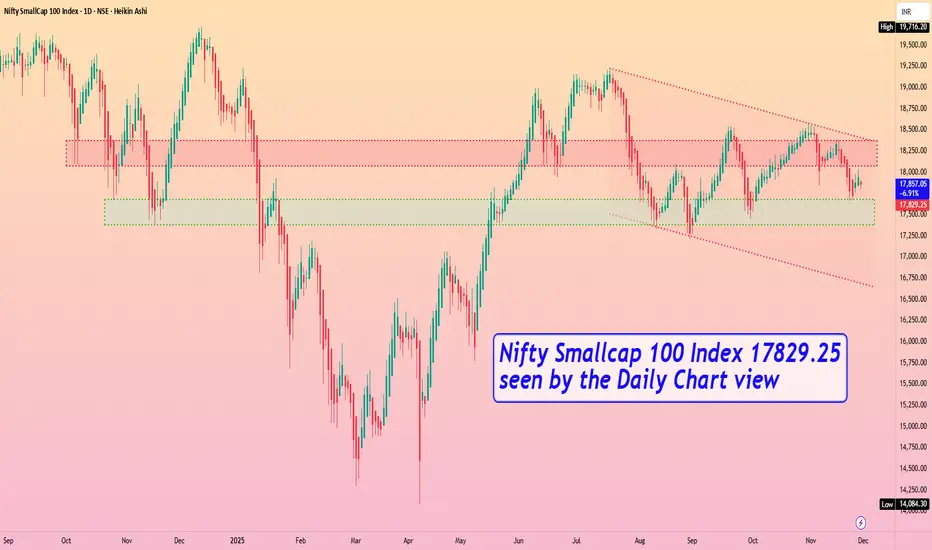
Nifty Smallcap 100 Index 17829.25 by Daily Chart viewNifty Smallcap 100 Index 17829.25 by Daily Chart view
- Support Zone 17375 to 17675 Index Band
- Resistance Zone to 18075 to 18375 Index Band
- Index formed Lower High Lower Lows since mid of July 2025
- Current status indicating Support Zone shoulder for probable upside
- Let us all hope for the be
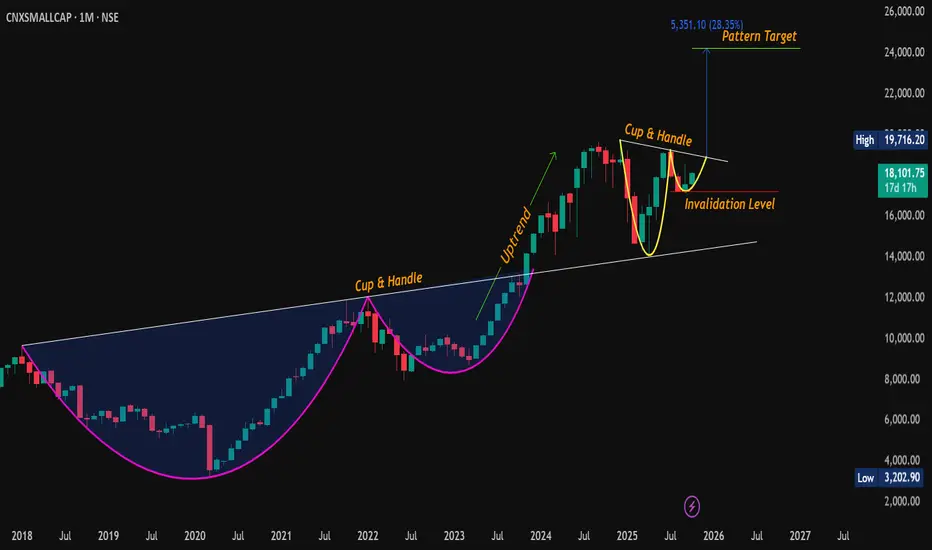
#CNXSMALLCAP | Monthly Cup & Handle Breakout Brewing!Classic Cup & Handle pattern is forming on the monthly chart of Nifty Small Cap Index , signaling potential for a strong bullish continuation if key resistance levels are cleared.
🔹 CMP: 18,102
🔹 Pattern: Cup & Handle (MTF)
🔹 Resistance Zones: 18505 - 18603 / 19075 - 19307 / 19716 (ATH)
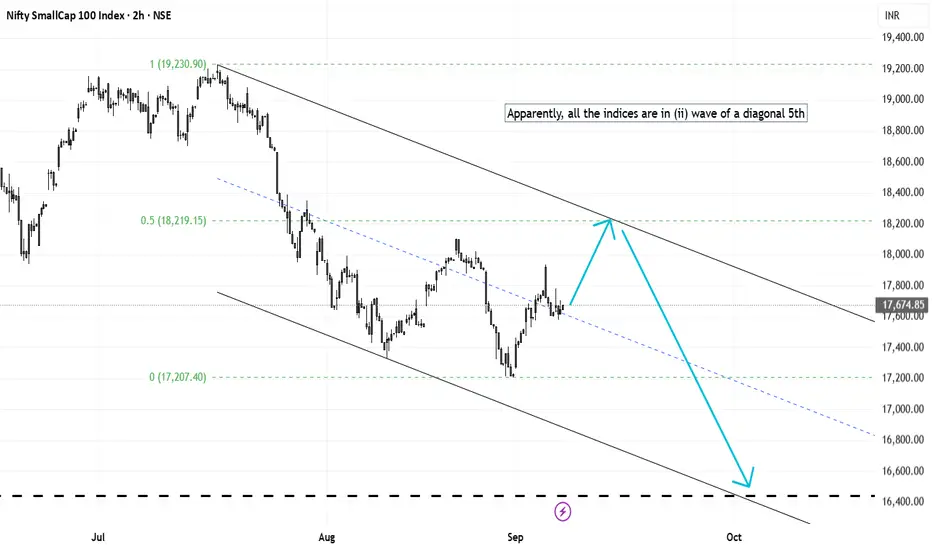
Elliott Wave Analysis of NIFTY Small Cap 100 CNXSMALLCAPThis is to be tracked on daily basis and the counts may change. But for now, for all the indices to be in (ii) wave retracement of a diagonal 5th is a good possibility.
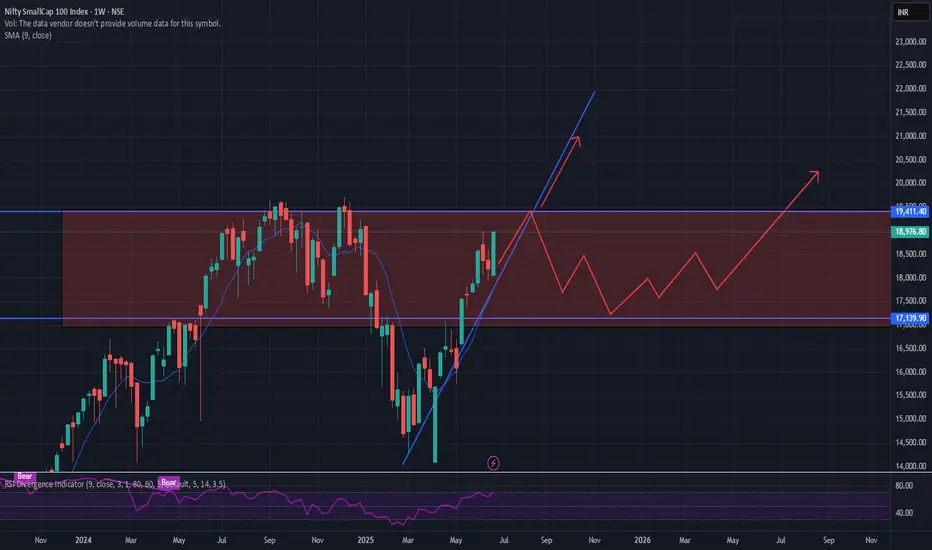
Bullish Consolidation and Anticipated BreakoutThe chart analysis indicates that the Nifty SmallCap 100 Index is currently in a consolidation phase within the red rectangular zone. The blue upward trend line and the arrow suggest a bullish sentiment, with potential for the stock to break out of the consolidation range and continue its upward tra
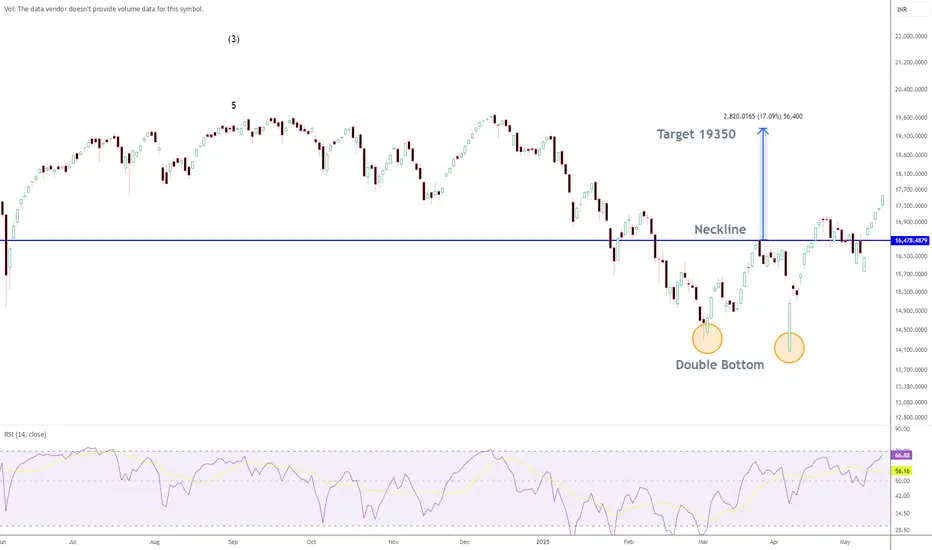
Nify Small Cap Index TargetA double bottom is seen in Nifty Small Cap Index and the Index has decisively broke above the neckline. The target for Index is close to 19350 based on double bottom projection
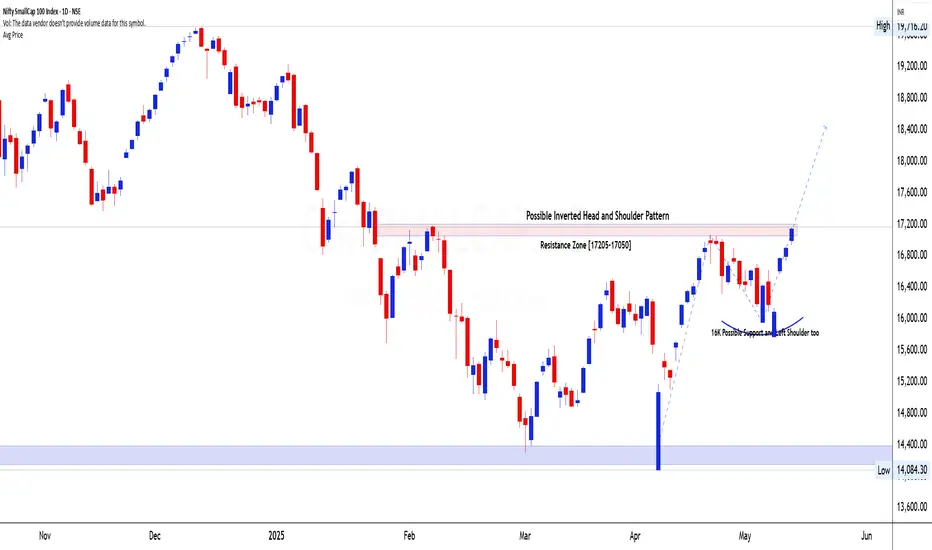
Nifty Smallcap- Inverted Head and Shoulder Pattern🚀 Breakout Watch Alert: Nifty SmallCap 100 Index (CNXSMALLCAP)
📌 Price: ₹17,147 📅 Date: 14-05-2025
① Pattern Name, Timeframe, Structure & Explanation
Pattern: Inverted Head & Shoulders
Timeframe: Daily Chart
Duration: \~4 Months (From Jan to May 2025)
The Nifty SmallCap 100 Index has formed a we
SMALL CAP INDEXHello & welcome to this analysis
The index gave a sharp bounce back like the rest of the market and is now near a cluster resistance - monthly, weekly & daily @ 16900.
It could consolidate in this zone before trying a breakout for 17500 else dip down to 16000 where it has good support.
Fresh buyi
See all ideas
Summarizing what the indicators are suggesting.
Oscillators
Neutral
SellBuy
Strong sellStrong buy
Strong sellSellNeutralBuyStrong buy
Oscillators
Neutral
SellBuy
Strong sellStrong buy
Strong sellSellNeutralBuyStrong buy
Summary
Neutral
SellBuy
Strong sellStrong buy
Strong sellSellNeutralBuyStrong buy
Summary
Neutral
SellBuy
Strong sellStrong buy
Strong sellSellNeutralBuyStrong buy
Summary
Neutral
SellBuy
Strong sellStrong buy
Strong sellSellNeutralBuyStrong buy
Moving Averages
Neutral
SellBuy
Strong sellStrong buy
Strong sellSellNeutralBuyStrong buy
Moving Averages
Neutral
SellBuy
Strong sellStrong buy
Strong sellSellNeutralBuyStrong buy
Displays a symbol's value movements over previous years to identify recurring trends.