View on Cummins Indiagapdown or downside target : 2759-2732 below which we may see more bearish levels:2631
if it takes supports and consolidate above 2739 it can touch 2990
no buy/sell recommendation. shared for learning purpose.
CUMMINSIND trade ideas

Cummins India Ltd: Evaluating Investment Potential Technical Analysis: Butterfly Pattern and Support Levels
Cummins India Ltd has recently formed a butterfly pattern in its stock chart, currently trading with a 30% decline from its recent highs. The stock is finding support around the ₹2900 level, which may present a strategic entry point for long-term investors.
Fundamental Performance Overview
Revenue Growth: For the fiscal year 2023-2024, Cummins India reported a 16% increase in revenue, amounting to approximately ₹9,000.2 crore. This growth is attributed to strong demand across various sectors, including power generation and industrial applications.
Net Profit: The company reported a net profit of ₹1,475 crore, reflecting a robust performance despite facing challenges in the market. This represents a slight decrease compared to previous periods but highlights resilience amid economic fluctuations.
Price-to-Earnings (P/E) Ratio: The current P/E ratio stands at approximately 48.32, which is higher than the sector average of 45.99, indicating that the stock may be perceived as overvalued based on earnings.
Debt Levels: Cummins India maintains a very low debt-to-equity ratio of 0.02, showcasing strong financial health and minimal reliance on debt financing.
Return on Equity (ROE): The company has reported an ROE of 23.85%, reflecting effective management in generating profits from shareholders' equity.
Dividend Yield: Cummins India offers a dividend yield of approximately 1.27%, providing some returns to investors amidst market volatility.
Market Capitalization: As of January 2025, Cummins India has a market capitalization of around ₹83,145 crore, reinforcing its position as a significant player in the engine manufacturing sector.

Cummins - short for 15 %on weekly charts ,
price facing rejection rejction at 3900 level for past 6 months
H&S pattern formation
price breached 18 week EMA and this week 18 week EMA is a confirmed resistance
MACD s are negative
Target and SL marked

CUMMINS - INTRADAY and BTST OppurtunityView : Bullish
Entry Zone- 3212 to 3186
Exit Zone - Based on Trader mindset. Exit 1 - 3266
Exit 2- 3334
Stoploss : Close below 3180
Trading Edge: Price action
Risk/Reward Ratio: 1:2 or more
Timeframe: Daily
* This is not a trading recommendation, for educational purposes only

“Cummins India at a Crucial Juncture: Breakout or Breakdown?”The stock has recently tested a key support zone near ₹3,200, coinciding with a long-term descending trendline and the 200-day moving average (yellow line). The price action suggests indecision, making this a crucial level to watch for both buyers and sellers.
Bullish Scenario
1. If the stock sustains above the ₹3,200 level and breaks out of the descending trendline, it could signal bullish momentum.
2. Key upside resistance levels to monitor:
• ₹3,356
• ₹3,800
• ₹4,132
3. A breakout above ₹4,132 could indicate further upward potential.
Bearish Scenario
1. A decisive breakdown below ₹3,200, backed by high volume, might lead to bearish continuation.
2. Potential downside levels to watch:
• ₹3,000
• ₹2,800
3. Failure to reclaim the 200-day moving average may strengthen bearish sentiment.
Conclusion
Traders should wait for a clear price action signal – either a breakout above the descending trendline or a breakdown below the support zone. Keep an eye on volume and broader market trends for confirmation.
You can adjust this to match your style before publishing!
Disclaimer:
This analysis is for educational and informational purposes only and should not be considered as financial advice. Please conduct your own research and consult with a financial advisor before making any investment decisions. Trading involves significant risk, and past performance is not indicative of future results.

Cummins Ind Date : 22.12.2024
Cummins Ind
Timeframe : Day chart
Remarks :
1 At close to neckline of descending triangle
2 Breached 200 ema near neckline
3 Strong rsi base is also "buy on dips"
4 June 4th, election day low + rsi base is strong pull back trade/swing
Remarks,
Ankur

bullish trend above ema crossovertrend shifting above trendline, move will start given examples in past move have a look how are have time to hold they can. its only for educational purpose how i see charts and its reversed from0.618 fibbo level

Cummins India Ltd: Eyeing a Major BreakoutCummins India Ltd (NSE: CUMMINS) is signaling strong bullish momentum on the weekly chart with a falling wedge and bullish flag combination .
Key Insights:
Patterns: Falling wedge + bullish flag – strong continuation signals.
Current Price: ₹3,671.00 (+1.98%).
Breakout Zone: ₹3,750 (watch for a sustained move).
Targets: ₹3,929 → ₹4,169 → ₹4,500 → ₹5,600+ (bullish flag projection).
Support Levels: ₹3,422 and ₹3,251.
A breakout above ₹3,750 with volume confirmation could push prices toward ₹5,600+, aligning with the bullish flag target.

Consolidation Breakout Potential with Strong EarningsAnalysis:
Cummins India has been in a consolidation phase over the past three months, building a solid base. Today, the company reported its quarterly results, showing a significant profit increase of approximately 36%, which indicates strong fundamentals and could trigger an upside breakout. This setup makes the stock appealing for a short swing trade to capture any breakout momentum fueled by positive earnings.
Technical Setup:
Pattern: Three-month consolidation base
Catalyst: Strong quarterly earnings with a 36% profit increase
Expected Move: Potential breakout from consolidation on positive sentiment
Trade Plan:
Entry: On breakout above consolidation resistance, preferably with volume
Target: Short-term swing based on previous resistance or measured move
Stop Loss: Below the consolidation support level
Note: Positive earnings could provide the push needed for a breakout, offering a short swing opportunity to capitalize on potential bullish momentum.
🔒 Disclaimer: This post is for educational purposes only. We hold no liability for any profit or loss incurred from trading or investing based on this information. Always conduct your own research or consult a financial advisor.

CUMMINS DOUBLE BOTTOM BREAKOUTCummins breaking double bottom pattern
with volume spike,bullish rsi
trading above 20ema
#target 3900-4150
sl 3400,depending on ur risk management
EDUCATIONAL IDEA

CUMMINSIND#CUMMINSIND is ready to fly,,
there is higher probability we can see good in move from
here in Intraday only...
I am expecting 50-80 points rally in it..
Please follow strict stop loss
better trade in next week future and options contracts

Potential Channel Breakout: Cummins India Near 3950Details:
Asset: Cummins India Limited (CUMMINSIND)
Breakout Level: Above 3950
Potential Target: Significant upside potential beyond 3950
Stop Loss: Below 3950 or as per risk tolerance
Timeframe: Medium-term
Rationale: Cummins India has been consolidating for months and is now nearing the critical breakout level of 3950. A successful breakout from this channel could lead to a substantial upward move, making it a stock to watch closely for potential big gains.
Market Analysis:
Technical Setup: The stock has been consolidating in a channel and is approaching the breakout level of 3950. A breakout above this resistance could trigger strong bullish momentum.
Consolidation Phase: The prolonged consolidation suggests that the stock is building strength, and a breakout could be a signal for an extended upward trend.
Price Target:
The breakout above 3950 could lead to a significant move higher, with further upside potential as the stock gathers momentum.
Risk Management:
A stop loss below 3950 is recommended to protect against downside risk in case of a failed breakout or market reversal.
Timeframe:
The expected breakout and potential move higher could unfold over the medium term, though the actual timing depends on market conditions and the strength of the breakout.
Risk-Reward Ratio: A favorable risk-reward setup, with limited downside risk near the breakout level and significant upside potential if the breakout occurs.
Keep a close eye on Cummins India for a possible breakout, and be prepared to act based on technical signals and market conditions.

CUMMINS - Weak?Going by the structure of the Cummins, I believe the price action is getting weaker.
If the price doesn't sustain the lower border of the triangle, expect the downward momentum to gain strength.

Cummins India Swing Idea (Long)Cummins India is looking for breakout due to following reason :
1) Swing Low are shifting upper side
2) Double Bottom pattern / W pattern
3) Ascending Triangle pattern formation
4)Trading above 20,50 & 200 EMA on daily chart
(Note: I am neither responsible for anyone's profit or loss nor I'm a sebi registered RA, this only for educational purpose. Please do your own due diligence before taking any trades.)

CUMMINSIND Support & Resistance #CUMMINSIND
TIME FRAME :-- DAY
Looking Good above.3900
Keep SL _______ 3800
Target _._ 4100
Support & Resistance Levels

CUMMINSIND NSEHello,
I would like to share some trading information regarding Cummins India. It appears to be forming a bullish pennant pattern on the weekly timeframe. While an early entry at current levels may carry some risk, traders may consider allocating 25-50% of their desired position size and gradually adding to it based on their risk tolerance.
Thank you.

Cummins stock is ready for breakout?Cummins stock is trading near the high resistance zone area. There is a very high probability that the stock would break the resistance zone. Buy 50% qty @ 3870 and add more qty around 3880 after the clear breakout. This shows a strength in the stock. Also, the long-term trend is positive. Target near 4175-4200 with SL 3725. This is for your educational purpose only.


CUMMINS INDIA - TRIANGLE PATTERN The stock has formed Triangle pattern on the
hourly chart.
One can enter above 3737.30 with a strict
Stoploss of 3693.50
Target 1 - 3790
Target 2 - 3834
Target 3 - 3868
#INTRADAY TRADE
#CUMMINS
What is your view please comment it down and also boost the idea this help to motivate us. All views shared on this channel are my personal opinion and is shared for educational purpose and should not be considered advise of any nature.

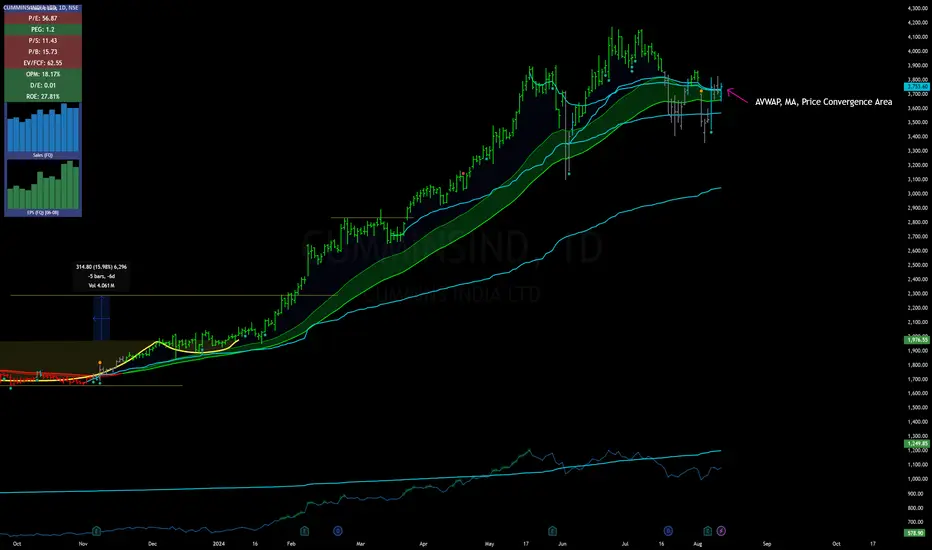
Great convergence area to take fresh positionsStock took support at the convergence area created by AVWAP, Moving Average and the price. Looks great buy at this moment.
Disclaimer: I'm invested for very long term. I do not recommend this stock.
CUMMINS INDIA - Swing Trade Analysis - 7th August #stocksCUMMINS INDIA (1D TF) - Swing Trade Analysis given on 7th August, 2024
Pattern: SYMMETRICAL TRIANGLE SETUP
- Strong Pullback candle from Support Trendline - Done ✓
- Weekly Volume buildup near Resistance Trendline - Done ✓
- Demand Zone Retest & Consolidation (for a small SL and a better RR) - In Progress
Please Note:
- This is an early entry to give for a better RR
- Resistance Trendline Breakout - In Progress
* Disclaimer

Cummins IND (Educational idea)Cummins tested its year trend line which is 3470 levels...
breaking the line may bleed more
Support levels as follows
S1 = 3290
S2 = 3090
S3 = 2790
Upside movemnt only valid if its breaks and suatain above 3750 levels

Short Term Trading Opportunity in Cummins India for > 15% upsideHi,
NSE:CUMMINSIND has given a Bullish Flag Breakout on Daily charts with very good volume.
MACD is also on the bullish side on Daily and Monthly time frames. RSI is also on the bullish side on daily, weekly and monthly time frames.
In the current market scenario, I am expecting that the bullish momentum will continue.
Complete price projection like entry, stop loss and targets mentioned on the charts for educational purpose.
Don't Forget to Follow me to get all the updates.
Please share your feedback or any queries on the study.
Disclaimer: Please consult your financial advisor before making any investment decision.
