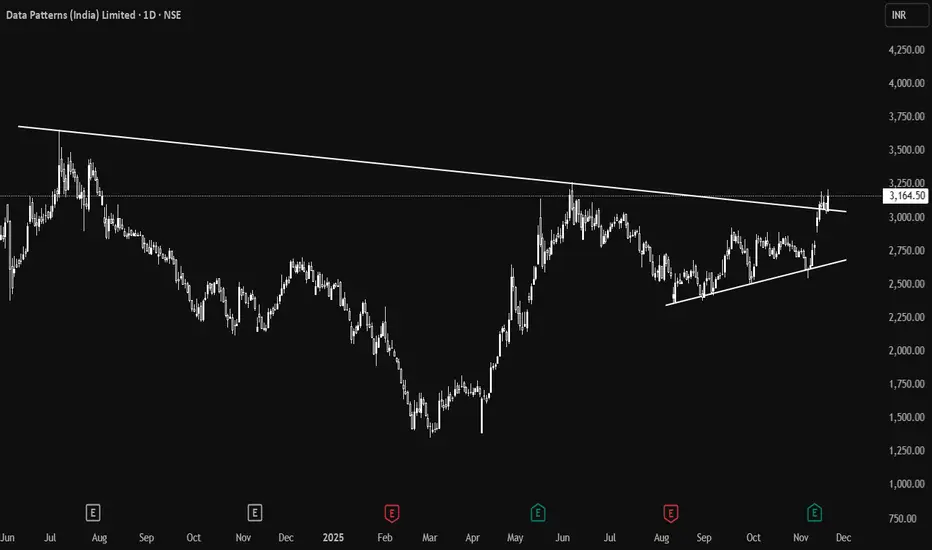
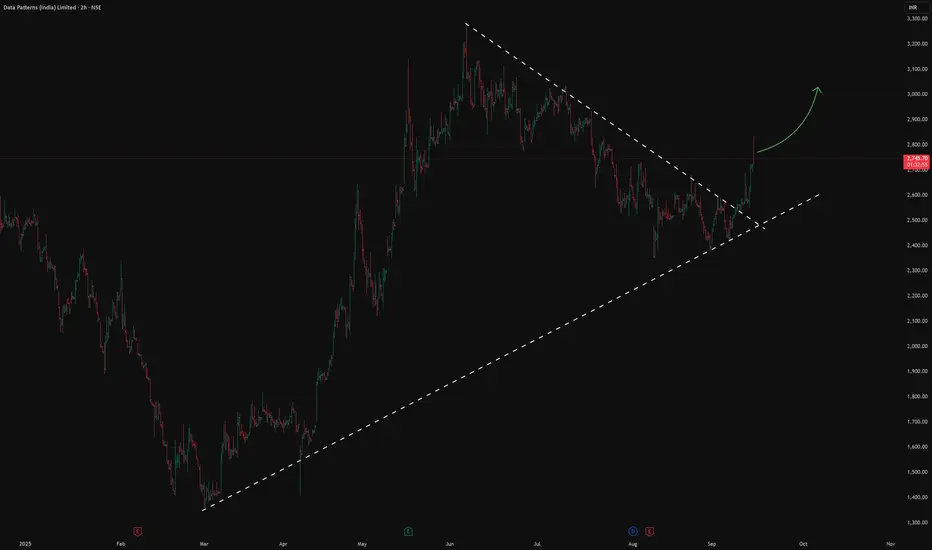
Data PatternsClean breakout with 3 rejections at the upper trendline on daily chart. Took an entry at 3100 post-confirmation with SL near 3000.
Next report date
—
Report period
—
EPS estimate
—
Revenue estimate
—
41.70 INR
2.22 B INR
7.08 B INR
24.62 M
About Data Patterns (India) Limited
Sector
Industry
CEO
Srinivasagopalan Rangarajan
Website
Headquarters
Chennai
Founded
1998
ISIN
INE0IX101010
FIGI
BBG0149BYX24
Data Patterns (India) Ltd. engages in the manufacture of electronic boards and systems. Its products include radar and radar processor, avionics and electronic warfare, automatic test equipment, and communication devices. The company was founded on November 11, 1998 and is headquartered in Chennai, India.
Related stocks
Data Patterns (India) Ltd. (DATAPATTNS)Time Cycle is a routine that allows you to map the movement of a stock by measuring the high and low levels of the stock on a day or period. However, it does not prove whether a reversal will occur in the next time cycle; it is only a probability. But it makes you profitable 80% of the time.
Regard

Data Patterns (D): Strongly Bullish, Fundamentally Driven BOThis is a high-conviction breakout event. The stock has decisively broken its 17-month angular resistance, driven by blockbuster quarterly earnings. All indicators are aligned, but the stock now faces its final horizontal resistance, which will determine the next major leg up.
🚀 1. The Fundamental
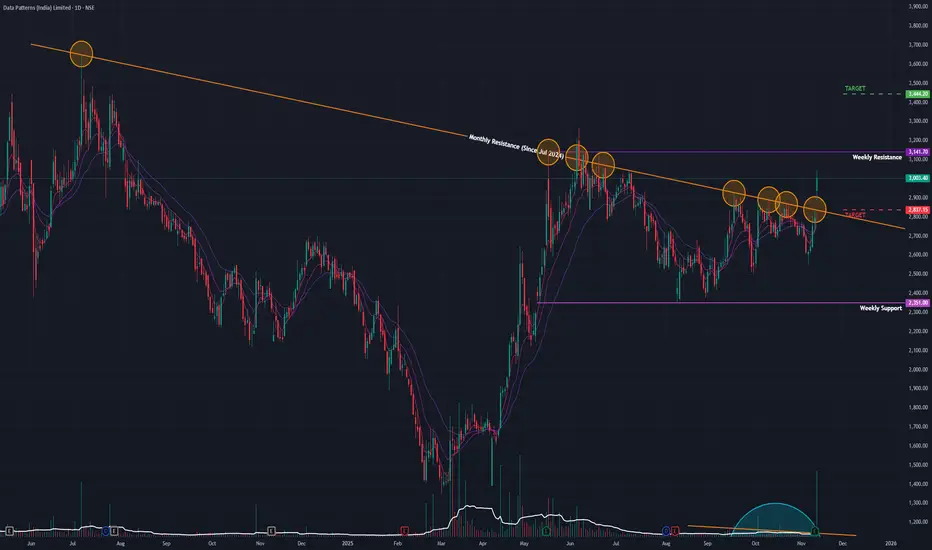
DATAPATTNS 1 Day Time Frame 📋 Key Levels
Accumulated-volume support: ≈ ₹2,576.90.
Fibonacci-based support levels: ~ ₹2,514.67 & ~ ₹2,545.65.
Short-term support (MarketScreener): ~ ₹2,541.40.
Resistance: ~ ₹2,806.80 (accumulated volume)
Short-term resistance (MarketScreener): ~ ₹2,842.
Moving averages:
20-day EMA ~ ₹
DATAPATTNS 1 Hour Time Frame 🔄 Moving Averages
Exponential Moving Averages (EMA):
5-period EMA: ₹2,803.11 — neutral.
15-period EMA: ₹2,774.23 — mildly bullish.
50-period EMA: ₹2,715.07 — mildly bullish.
100-period EMA: ₹2,654.61 — mildly bullish.
Simple Moving Averages (SMA):
5-period SMA: ₹2,809.74 — mildly bullish

DATAPATTNS 1 Month Time Frame 📈 Current Stock Price
Price: ₹2,806.80
Day Range: ₹2,725.00 – ₹2,890.00
52-Week Range: ₹1,351.15 – ₹3,268.80
Market Cap: ₹15,714 crore
P/E Ratio (TTM): 73.2
Dividend Yield: 0.28%
ROE: 15.2%
ROCE: 21.0%
Debt-to-Equity: 0.00%
🔍 Technical Indicators (1-Month Time Frame)
RSI (14): 5
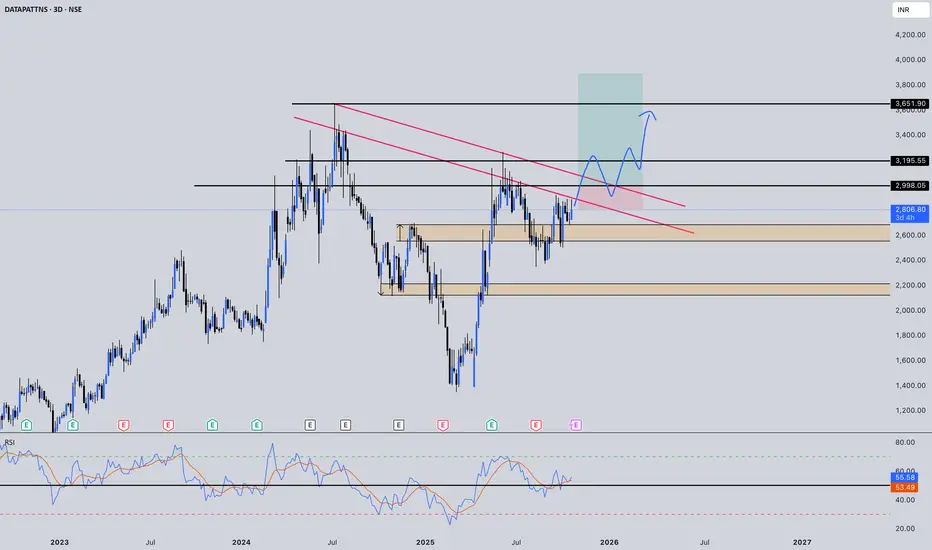
DATAPATTNS | 3D AI Chart Analysis w/ Powerful Insights🔍 Technical Snapshot:
🔺 Critical Resistance: ₹2,900-2,998 (triple test rejection zone)
🔺 Major Target: ₹3,195 (old supply area)
🔺 Moon Zone: ₹3,651 (ATH - cyan box target)
🔻 Support: ₹2,725 (today's low - must hold)
📈 RSI: 53.49 (neutral - room to 70 before overbought)
📉 Pattern: 6-month base + des
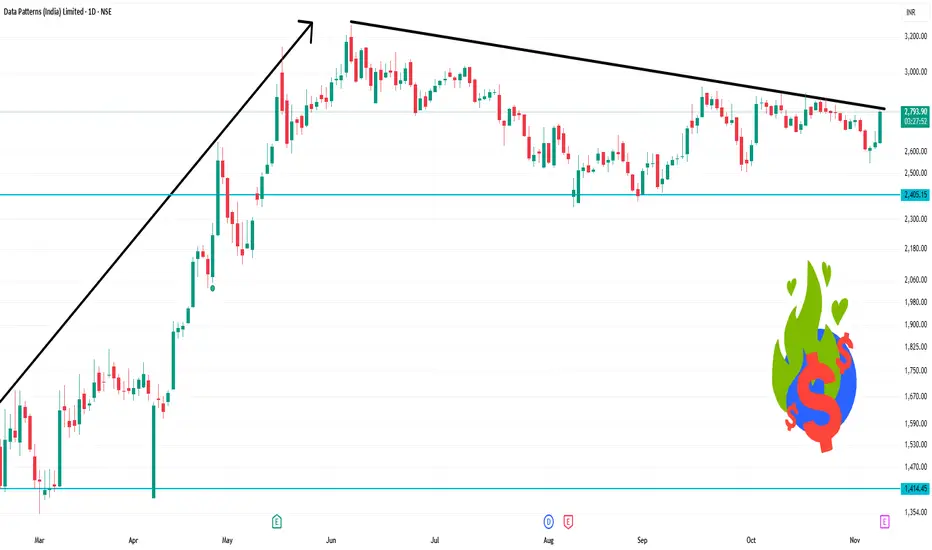
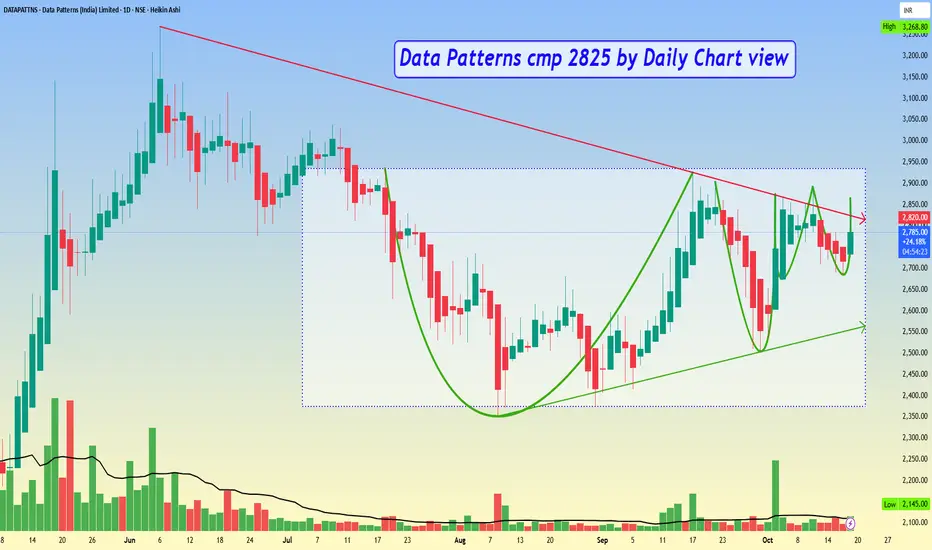
Data Patterns cmp 2825 by Daily Chart viewData Patterns cmp 2825 by Daily Chart view
* Support Zone 2585 to 2685 Price Band
* Resistance Zone 2935 to 3065 Price Band
* Stock has made a near tight and contracting VCP pattern
* Falling Resistance Trendline Breakout in the making process
* Darvas Box pattern with price trending between 2375
DATAPATTNS IN (Data Patterns) Long#Invest #India #Datapattns
Data Patterns is involved in defence projects such as Light Combat Aircraft (LCA), BrahMos missile programme, and supplies to ISRO and DRDO
Government of India is aggressively promoting indigenous defence manufacturing through the Atmanirbhar Bharat policy
India's defen
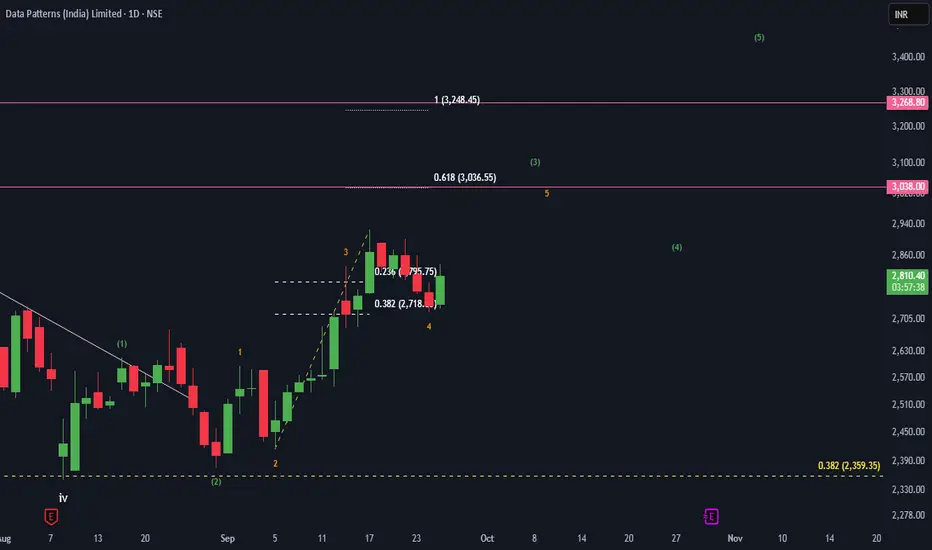
Impulse wave 5 underwayStock completed wave 4 of higher degree on 8th August and has resumed on its upward journey in the form of wave 5.This wave 5 is under its wave 3,of which lower degree wave 4 is done as wave 5 has started so structurally we are in 5 of 3 of 5.
under current scenario One can go long at cmp of 2813
See all ideas
Summarizing what the indicators are suggesting.
Neutral
SellBuy
Strong sellStrong buy
Strong sellSellNeutralBuyStrong buy
Neutral
SellBuy
Strong sellStrong buy
Strong sellSellNeutralBuyStrong buy
Neutral
SellBuy
Strong sellStrong buy
Strong sellSellNeutralBuyStrong buy
An aggregate view of professional's ratings.
Neutral
SellBuy
Strong sellStrong buy
Strong sellSellNeutralBuyStrong buy
Neutral
SellBuy
Strong sellStrong buy
Strong sellSellNeutralBuyStrong buy
Neutral
SellBuy
Strong sellStrong buy
Strong sellSellNeutralBuyStrong buy
Displays a symbol's price movements over previous years to identify recurring trends.
MODEFENCE
Motilal Oswal Nifty India Defence ETF Units Exchange Traded FundWeight
2.79%
Market value
2.74 M
USD
GROWWDEFNC
Groww Nifty India Defence ETF Units Exchange Traded FundWeight
2.79%
Market value
741.58 K
USD
MOSMALL250
Motilal Oswal Nifty Smallcap 250 ETF Units Exchange Traded FundWeight
0.39%
Market value
56.52 K
USD
Explore more ETFs
Frequently Asked Questions
The current price of DATAPATTNS is 2,898.80 INR — it has decreased by −0.08% in the past 24 hours. Watch Data Patterns (India) Limited stock price performance more closely on the chart.
Depending on the exchange, the stock ticker may vary. For instance, on NSE exchange Data Patterns (India) Limited stocks are traded under the ticker DATAPATTNS.
DATAPATTNS stock has fallen by −1.65% compared to the previous week, the month change is a 9.54% rise, over the last year Data Patterns (India) Limited has showed a 16.00% increase.
We've gathered analysts' opinions on Data Patterns (India) Limited future price: according to them, DATAPATTNS price has a max estimate of 3,710.00 INR and a min estimate of 2,950.00 INR. Watch DATAPATTNS chart and read a more detailed Data Patterns (India) Limited stock forecast: see what analysts think of Data Patterns (India) Limited and suggest that you do with its stocks.
DATAPATTNS reached its all-time high on Jul 5, 2024 with the price of 3,655.00 INR, and its all-time low was 575.00 INR and was reached on Feb 24, 2022. View more price dynamics on DATAPATTNS chart.
See other stocks reaching their highest and lowest prices.
See other stocks reaching their highest and lowest prices.
DATAPATTNS stock is 2.64% volatile and has beta coefficient of 2.53. Track Data Patterns (India) Limited stock price on the chart and check out the list of the most volatile stocks — is Data Patterns (India) Limited there?
Today Data Patterns (India) Limited has the market capitalization of 166.47 B, it has increased by 1.06% over the last week.
Yes, you can track Data Patterns (India) Limited financials in yearly and quarterly reports right on TradingView.
Data Patterns (India) Limited is going to release the next earnings report on Feb 10, 2026. Keep track of upcoming events with our Earnings Calendar.
DATAPATTNS earnings for the last quarter are 8.80 INR per share, whereas the estimation was 6.70 INR resulting in a 31.34% surprise. The estimated earnings for the next quarter are 7.50 INR per share. See more details about Data Patterns (India) Limited earnings.
Data Patterns (India) Limited revenue for the last quarter amounts to 3.08 B INR, despite the estimated figure of 1.32 B INR. In the next quarter, revenue is expected to reach 1.32 B INR.
DATAPATTNS net income for the last quarter is 491.90 M INR, while the quarter before that showed 255.00 M INR of net income which accounts for 92.90% change. Track more Data Patterns (India) Limited financial stats to get the full picture.
Yes, DATAPATTNS dividends are paid annually. The last dividend per share was 7.90 INR. As of today, Dividend Yield (TTM)% is 0.27%. Tracking Data Patterns (India) Limited dividends might help you take more informed decisions.
Data Patterns (India) Limited dividend yield was 0.47% in 2024, and payout ratio reached 19.94%. The year before the numbers were 0.27% and 20.03% correspondingly. See high-dividend stocks and find more opportunities for your portfolio.
As of Dec 2, 2025, the company has 1.39 K employees. See our rating of the largest employees — is Data Patterns (India) Limited on this list?
EBITDA measures a company's operating performance, its growth signifies an improvement in the efficiency of a company. Data Patterns (India) Limited EBITDA is 3.04 B INR, and current EBITDA margin is 39.74%. See more stats in Data Patterns (India) Limited financial statements.
Like other stocks, DATAPATTNS shares are traded on stock exchanges, e.g. Nasdaq, Nyse, Euronext, and the easiest way to buy them is through an online stock broker. To do this, you need to open an account and follow a broker's procedures, then start trading. You can trade Data Patterns (India) Limited stock right from TradingView charts — choose your broker and connect to your account.
Investing in stocks requires a comprehensive research: you should carefully study all the available data, e.g. company's financials, related news, and its technical analysis. So Data Patterns (India) Limited technincal analysis shows the neutral today, and its 1 week rating is buy. Since market conditions are prone to changes, it's worth looking a bit further into the future — according to the 1 month rating Data Patterns (India) Limited stock shows the strong buy signal. See more of Data Patterns (India) Limited technicals for a more comprehensive analysis.
If you're still not sure, try looking for inspiration in our curated watchlists.
If you're still not sure, try looking for inspiration in our curated watchlists.