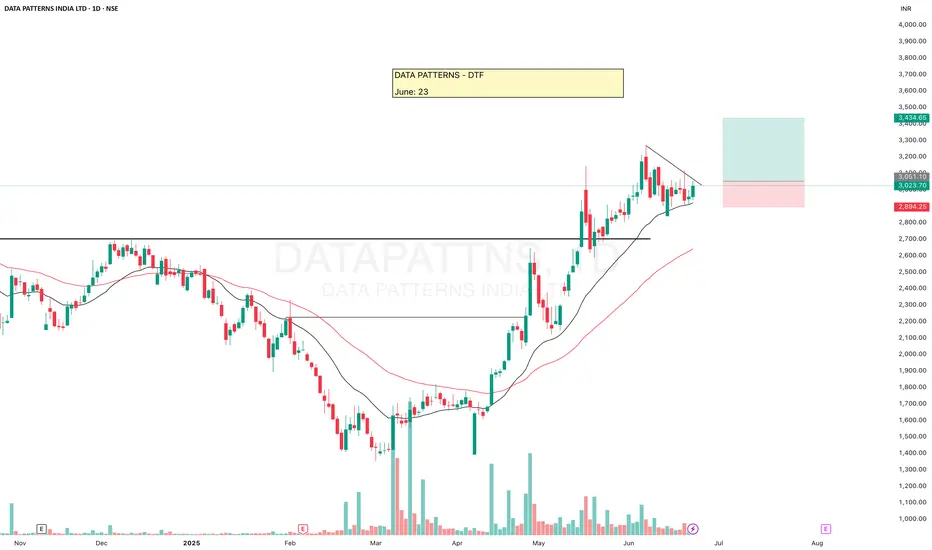
Data PatternsClean breakout with 3 rejections at the upper trendline on daily chart. Took an entry at 3100 post-confirmation with SL near 3000.
Trade ideas
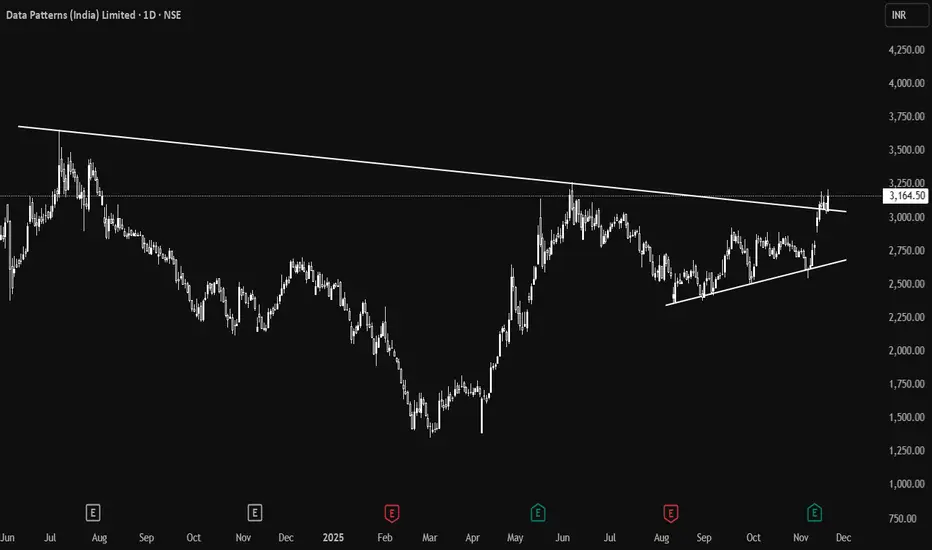
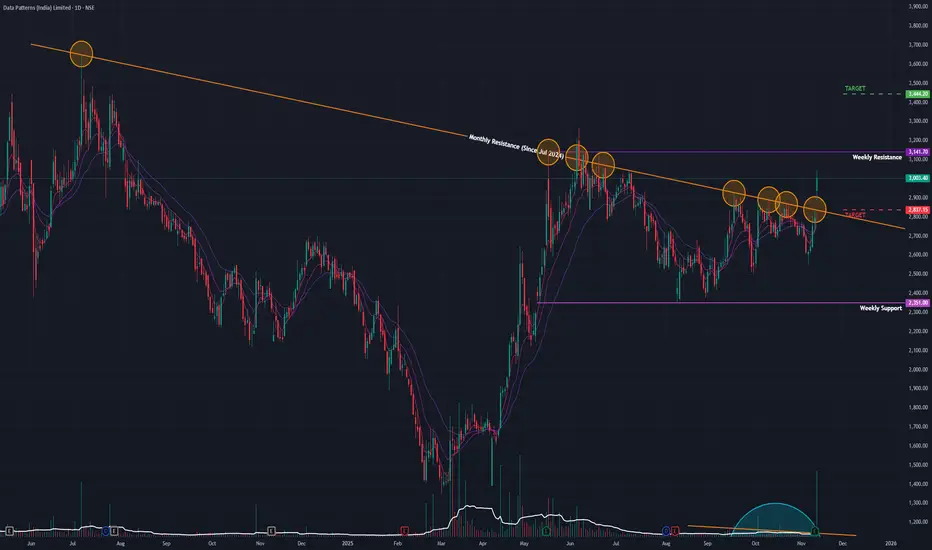
Data Patterns (D): Strongly Bullish, Fundamentally Driven BOThis is a high-conviction breakout event. The stock has decisively broken its 17-month angular resistance, driven by blockbuster quarterly earnings. All indicators are aligned, but the stock now faces its final horizontal resistance, which will determine the next major leg up.
🚀 1. The Fundamental Catalyst (The "Why")
Today's move is not speculative. It is a direct response to record-breaking Q2 2026 earnings :
- Revenue: Surged 238% year-over-year to ₹307.46 crore.
- Net Profit: Grew 62.5% year-over-year to ₹49.19 crore.
- Market Reaction: The gap-up open and +7.56% surge on 6.29 Million in volume confirms massive institutional interest.
📈 2. The Long-Term Context (The Setup)
- The 2024-2025 Correction: After its ATH in July 2024 , the stock entered a long-term downtrend.
- The Reversal: This trend found its bottom in March 2025 , and the stock began its recovery.
- The Angular Resistance: This recovery was capped by the angular resistance trendline from the July 2024 ATH.
- Drying Volume: Volume was drying up during the consolidation since May 2025—a classic sign of accumulation.
🎯 3. The Dual Resistance Battle
- Part 1 (CLEARED): Today, the stock gapped up and closed decisively above the 17-month angular resistance trendline. This is a significant bullish victory.
- Part 2 (THE NEXT HURDLE): The stock now faces a major horizontal resistance at ₹3,141 . This level is the last line of defense for the bears.
📊 4. Confluence of Bullish Indicators
This breakout is supported by a rare "trifecta" of bullish signals across all timeframes:
- EMAs: Short-term Exponential Moving Averages are in a "PCO" (Price Crossover) state on the Daily, Weekly, and Monthly charts .
- RSI: The Relative Strength Index is rising on the Daily, Weekly, and Monthly charts .
This alignment of all three timeframes gives the breakout very high technical validity.
🧠 5. Future Scenarios & Key Levels to Watch
🐂 The Bullish Case (Confirmation)
- Trigger: A decisive, high-volume close above the horizontal resistance at ₹3,141 .
- Target: This would confirm the start of a new bull run, and the target of ₹3,445 is the next logical objective.
🐻 The Pullback Case (Healthy Re-test)
- Trigger: If the stock is rejected at ₹3,141 or needs to pause after its big run.
- Support: The price would likely fall to re-test the angular trendline it just broke, at the identified level of ₹2,817 . A "bounce" off this level would be a textbook, healthy confirmation of the new support.
Data Patterns (India) Ltd. (DATAPATTNS)Time Cycle is a routine that allows you to map the movement of a stock by measuring the high and low levels of the stock on a day or period. However, it does not prove whether a reversal will occur in the next time cycle; it is only a probability. But it makes you profitable 80% of the time.
Regardless of the outcome, the candle formed on the day of the time cycle carries significant significance. The market respects this candle, whether it goes up or down, which is very important. Time Cycle often stops short near the candle. You will notice on the chart that it often looks like a support or resistance area.
Time Cycle candles also tell you about continuation or reversal, but you have to forgive the high and low of the candle formed in the time cycle.
You do not have to make any decisions yourself. This is its specialty.

DATAPATTNS 1 Day Time Frame 📋 Key Levels
Accumulated-volume support: ≈ ₹2,576.90.
Fibonacci-based support levels: ~ ₹2,514.67 & ~ ₹2,545.65.
Short-term support (MarketScreener): ~ ₹2,541.40.
Resistance: ~ ₹2,806.80 (accumulated volume)
Short-term resistance (MarketScreener): ~ ₹2,842.
Moving averages:
20-day EMA ~ ₹2,750.69.
50-day EMA ~ ₹2,720.79.
DATAPATTNS 1 Hour Time Frame 🔄 Moving Averages
Exponential Moving Averages (EMA):
5-period EMA: ₹2,803.11 — neutral.
15-period EMA: ₹2,774.23 — mildly bullish.
50-period EMA: ₹2,715.07 — mildly bullish.
100-period EMA: ₹2,654.61 — mildly bullish.
Simple Moving Averages (SMA):
5-period SMA: ₹2,809.74 — mildly bullish.
20-period SMA: ₹2,749.70 — mildly bullish.
50-period SMA: ₹2,663.32 — mildly bullish.
200-period SMA: ₹2,394.97 — mildly bullish.
These moving averages indicate a generally bullish short-term trend.
📉 Support and Resistance Levels
Support Levels:
₹2,800: Recent intraday low.
₹2,750: Previous support zone.
Resistance Levels:
₹2,860: Recent intraday high.
₹2,900: Psychological resistance level.

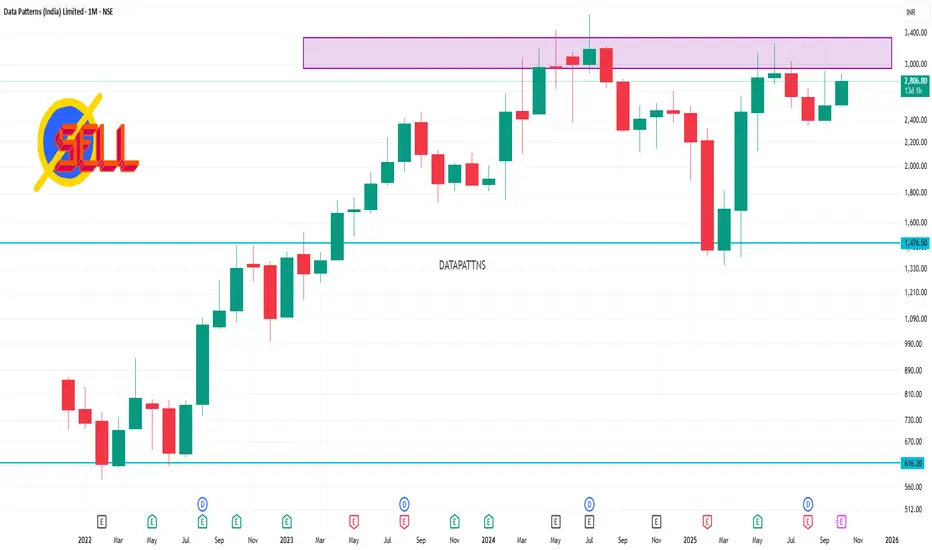
DATAPATTNS 1 Month Time Frame 📈 Current Stock Price
Price: ₹2,806.80
Day Range: ₹2,725.00 – ₹2,890.00
52-Week Range: ₹1,351.15 – ₹3,268.80
Market Cap: ₹15,714 crore
P/E Ratio (TTM): 73.2
Dividend Yield: 0.28%
ROE: 15.2%
ROCE: 21.0%
Debt-to-Equity: 0.00%
🔍 Technical Indicators (1-Month Time Frame)
RSI (14): 59.67 – Indicates neutral momentum.
MACD: 18.4 – Suggests bullish momentum.
Stochastic Oscillator: 64.93 – Indicates bullish trend.
CCI (14): 71.77 – Suggests bullish momentum.
ADX (14): 37.85 – Indicates strong trend strength.
Pivot Points (Classic):
R1: ₹2,837.36
R2: ₹2,848.03
R3: ₹2,857.16
S1: ₹2,808.43
S2: ₹2,797.76
S3: ₹2,797.76
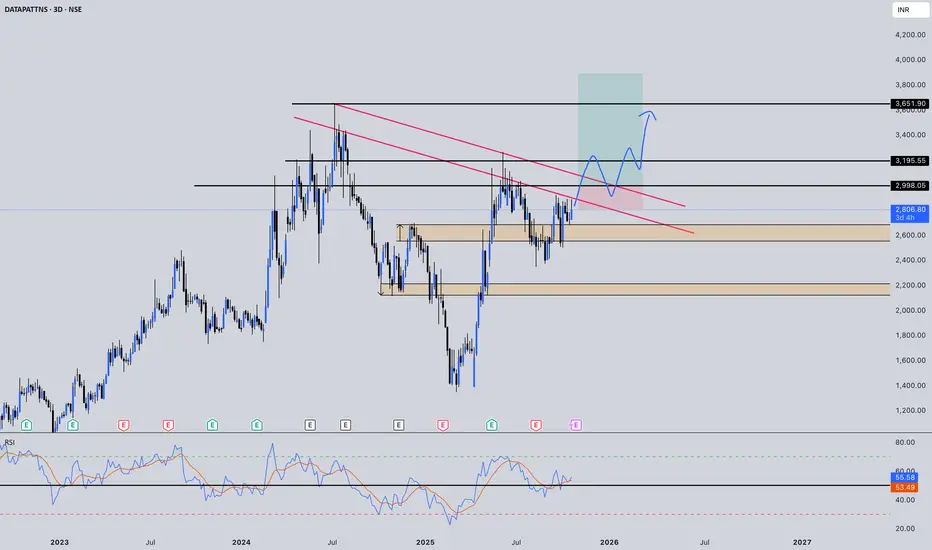
DATAPATTNS | 3D AI Chart Analysis w/ Powerful Insights🔍 Technical Snapshot:
🔺 Critical Resistance: ₹2,900-2,998 (triple test rejection zone)
🔺 Major Target: ₹3,195 (old supply area)
🔺 Moon Zone: ₹3,651 (ATH - cyan box target)
🔻 Support: ₹2,725 (today's low - must hold)
📈 RSI: 53.49 (neutral - room to 70 before overbought)
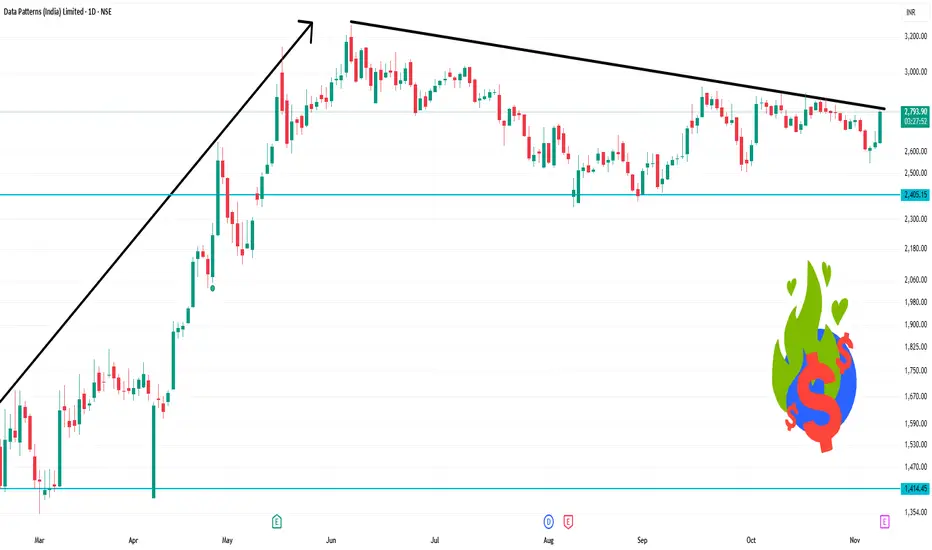
📉 Pattern: 6-month base + descending trendline break attempt
🧠 AI-Powered Insights:
⚡ COMPARATIVE INTELLIGENCE (vs 130 NSE stocks):
➡️ Momentum Rank: #9/42 in the Defense & Aerospace sector
➡️ Pattern Match: Similar to HAL (5 months ago – rallied +38%)
➡️ Sector Divergence: Defense index +6%, DATAPATTNS +3% → Slight lag
➡️ Institutional Flow: Increasing DII holdings last 2 quarters (+1.3%)
➡️ Verdict: Quiet accumulation underway — breakout confirmation awaited
📈 STATISTICAL EDGE (Pattern Backtested):
Descending channel breakouts historically (Defence midcaps):
✅ 71% break above resistance within 4–6 weeks
✅ Avg move post-breakout: +36%
❌ Failure rate: 29% (avg loss –12%)
RSI crossing 50 after 3-month consolidation:
✅ 75% cases continued higher for next 2–3 weeks
💡 Probability Score: 72/100 (High-quality setup)
👣 INSTITUTIONAL FOOTPRINTS:
📊 Volume Analysis:
• Noticeable pickup near ₹2,600–2,700 = accumulation pocket
• Volume declined near ₹2,850 = testing phase, not yet distribution
📈 Microstructure Alert:
• 68% time spent above ₹2,750 = acceptance zone building
• Sellers absorbed near ₹2,900 = weak supply pressure
🧩 AI Verdict: Institutional accumulation continues beneath resistance.
⚠️ Translation: Smart money likely preparing for breakout retest entries.
🔄 SECTOR ROTATION CONTEXT:
Money ENTERING: Defense (+₹640 Cr), Banking (+₹2,100 Cr)
Money LEAVING: FMCG (–₹420 Cr), IT (–₹780 Cr)
➡️ Defense sector holding momentum advantage; DATAPATTNS positioned well for spillover rally.
📊 Macro Verdict: Sector rotation favors Defence over defensives — bullish context intact.
🔮 HISTORICAL TWIN PATTERNS:
1️⃣ HAL (Apr 2024): Broke trendline + retest → +38%
2️⃣ MTARTECH (Nov 2024): Failed retest → –14%
3️⃣ SOLARINDS (Feb 2025): Range compression → +42% breakout
📊 Success Rate: 2/3 (≈67%)
⚠️ Bias: Slightly bullish when RSI >55 at breakout point (as now)
📊 Success Pattern Analysis:
- Sector support = 78% breakout success
- Sector opposition = 42% breakout success
💥 VISUAL HEALTH SCORE:
Technical Strength: ████████░░ 72/100 (Pattern clear)
Volume Conviction: ███████░░░ 68/100 ✅ (High)
Sector Momentum: ████████░░░ 75/100
Risk/Reward Ratio: ████████░░ 75/100
Pattern Success Rate: ██████░░░░ 58/100 (Historical twins)
Market Environment: ████░░░░░░ 42/100 (Sector headwinds)
🎯 OVERALL SCORE: 72/100 (Above Average Setup)
💡 Defense sector continues outperforming — DATAPATTNS among better-structured midcaps.
What I'm Watching:
1️⃣ Breakout Zone: ₹2,950–3,000 → critical for confirmation
2️⃣ Structure: Higher lows forming — trend reversal stage
3️⃣ RSI: Sustaining >55 = strength confirmation
4️⃣ Trend: 3D MA ribbon curling upward = early transition
5️⃣ Projection: Retest breakout → ₹3,200 → ₹3,650 (target zone)
🎯 RRR: 1:2.8 from CMP – favorable setup
⚠️ Disclaimer: This is NOT a buy/sell recommendation. This post is meant for learning purposes only. Views are personal. Please, do your due diligence before investing. (#DYOR) ⚠️
🔥 Comment "SCAN" for the top 3 high-probability plays! ✅ 🚀
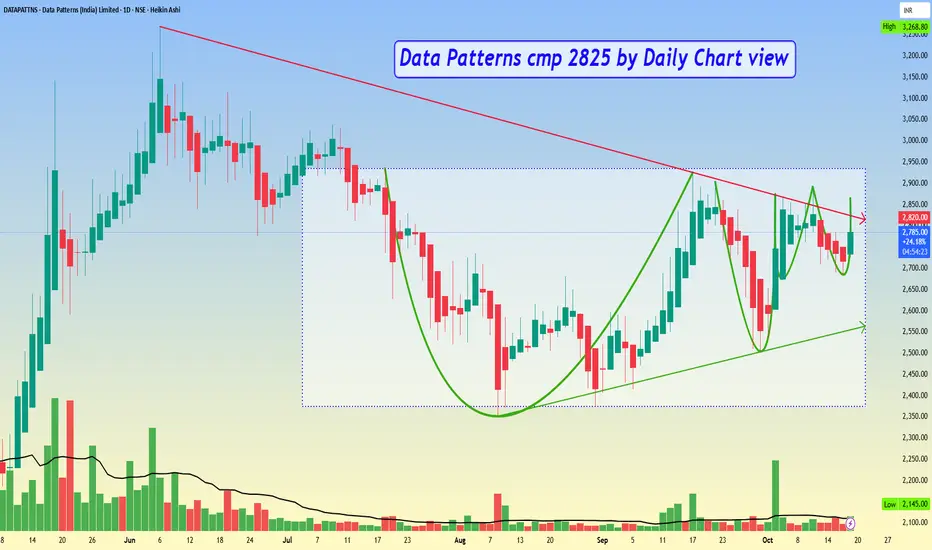
Data Patterns cmp 2825 by Daily Chart viewData Patterns cmp 2825 by Daily Chart view
* Support Zone 2585 to 2685 Price Band
* Resistance Zone 2935 to 3065 Price Band
* Stock has made a near tight and contracting VCP pattern
* Falling Resistance Trendline Breakout in the making process
* Darvas Box pattern with price trending between 2375 to 2935
* Bullish Rounding Bottom formed by the Resistance Zone neckline
* Volumes spiking intermittently by good numbers over past few weeks
DATAPATTNS IN (Data Patterns) Long#Invest #India #Datapattns
Data Patterns is involved in defence projects such as Light Combat Aircraft (LCA), BrahMos missile programme, and supplies to ISRO and DRDO
Government of India is aggressively promoting indigenous defence manufacturing through the Atmanirbhar Bharat policy
India's defence budget is increasing, with a focus on domestically produced equipment
The company has shown robust financial performance with a net profit of Rs 221.81 crore for 2025 and revenue growth
EPS (TTM) is Rs 38.32 crore and ROE is 15.66%
The company's revenue is expected to reach Rs 1.36 billion in the next quarter, with long-term price targets of Rs 38,930 by 2040
The company is virtually debt-free
Expansion into global export markets and development of new product segments (e.g., satellite technology, electronic warfare)
Expected to continue revenue and profit growth. Entering the positive FCF area.
EPS will show growth in the future, which will also support growth
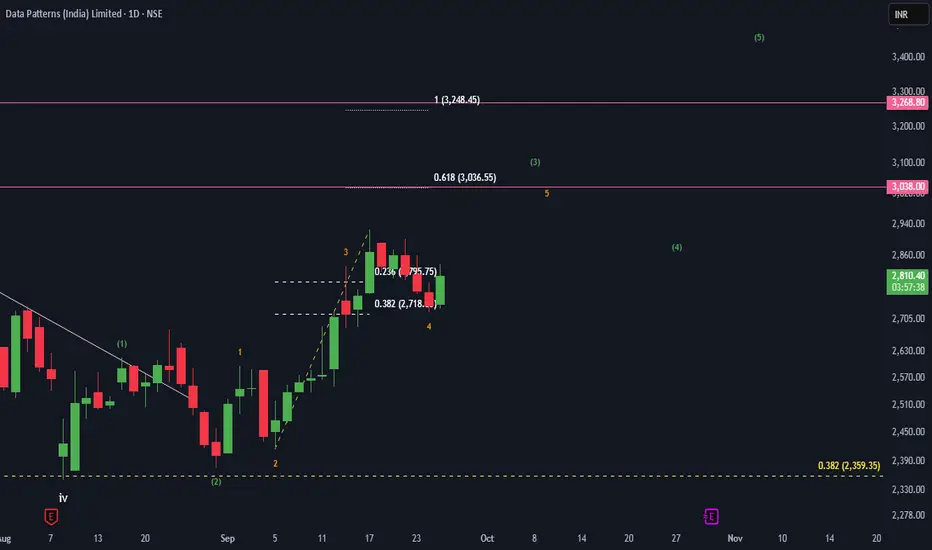
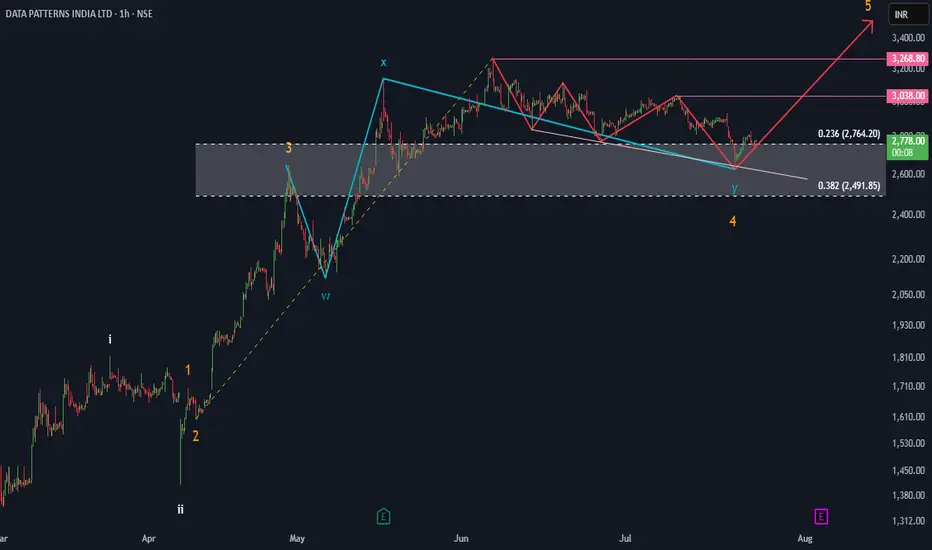
Impulse wave 5 underwayStock completed wave 4 of higher degree on 8th August and has resumed on its upward journey in the form of wave 5.This wave 5 is under its wave 3,of which lower degree wave 4 is done as wave 5 has started so structurally we are in 5 of 3 of 5.
under current scenario One can go long at cmp of 2813 with a stop-loss of 2700 with a target of 3036,giving us a risk reward of 1:2.This target is of wave 5 of wave 3 of wave 5.Higher degree wave 5 would take prices beyond last high of 3268.
Disclaimer:This are just my view on the stock, no position should solely be taken on its basis.Posting this just for my future reference.
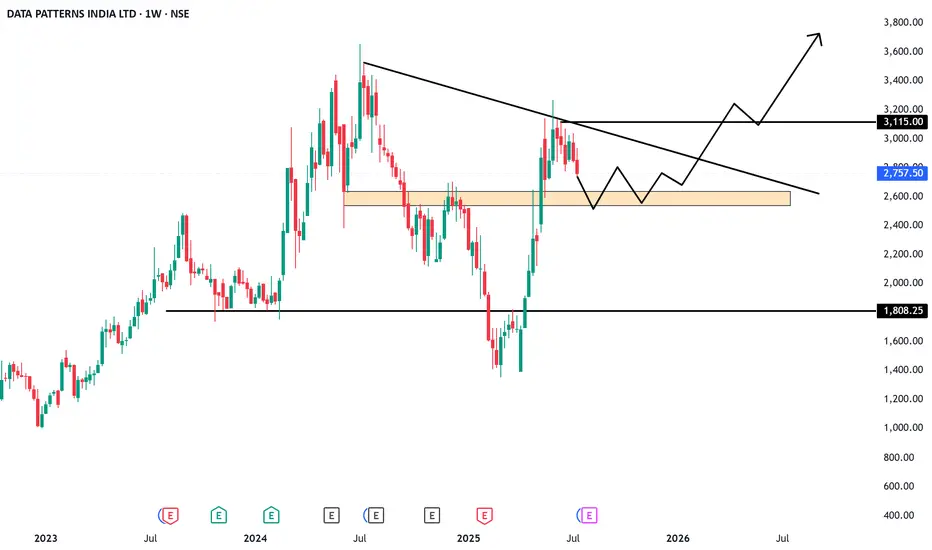
DTA PATTERNS - ANALYSIS **Data Patterns (India) Ltd** shows robust fundamentals and a bullish technical setup, albeit trading far above its fair value. Analysts expect continued growth, driven by strong defense and aerospace demand, but caution on premium valuation. Here’s a detailed summary with ROCE, ROE, CAGR, fair value, resistance/support, and target, plus competitive analysis.
***
## Fundamental Analysis
- **ROCE:** ~22.5% (TTM), indicating exceptional capital efficiency.
- **ROE:** ~19.2% (TTM), similar to top defense sector peers.
- **CAGR (3Y):** Estimated 54–58% stock price CAGR; revenue CAGR ~36%
- **Fair Value:** Median model puts fair value at ₹280 (EV/EBITDA), but more bullish models suggest up to ₹1,975 (Price/Sales).
- **Valuation Multiples:** P/E 66.82x (TTM), P/B 9.42, highlighting a premium to sector and market.
***
## Technical Analysis
- **Current Price:** ₹2,560.80 (as of Sep 2025).
- **Support Zones:** Near ₹2,350–2,400, also at ₹2,020 (major base).
- **Resistance Levels:** Fibonacci pivots at ₹2,735, ₹2,840, ₹3,010, ₹3,285 (major upside targets).
- **Momentum:** 20-day and 200-day moving average crossover signals recent bullish momentum, with ~13.5% average gains in prior cycles.
- **Target (Next 6 Months):** Analyst consensus targets ₹3,136–₹3,700, with the most conservative at ₹2,500.
***
## Competitive & Brokerage View
- **Peers:** Bharat Electronics (ROCE ~20%, lower valuation), Hindustan Aeronautics, Bharat Dynamics.
- Data Patterns ranks highest in margin, order pipeline, and growth of indigenous defense electronics.
- Brokerages have a “Strong Buy” bias with only valuation caution; strategic government contracts and indigenization drive growth.
***
## Summary Table
| Metric | Value/Level | Remarks/Peers Comparison |
|----------------|-----------------------------|-------------------------------------------------------|
| **ROCE** | ~22.5% | Highest among defense electronics peers |
| **ROE** | ~19.2% | Near sector best |
| **CAGR (3Y)** | 54–58% (stock), 36% (sales) | Rapid revenue and price growth |
| **Fair Value** | ₹280 (EV/EBITDA median) | Price/EBITDA models sharply below market price |
| **Current Price** | ₹2,560.80 | As of Sep 2025 |
| **Support** | ₹2,350–2,400, ₹2,020 | Key volume bases |
| **Resistance** | ₹2,735, ₹2,840, ₹3,010 | Fibonacci and prior highs |
| **6M Target** | ₹3,136–₹3,700 | Analyst consensus |
| **Peers** | BEL, HAL, BDL | Slight edge in margins/order visibility |
***
Data Patterns (India) Ltd is trading at a **significant valuation premium** compared to its defense sector peers, with higher price-to-earnings and price-to-book multiples, suggesting elevated growth expectations from investors versus most competitors.
## Valuation Comparison Table
| Company | P/E Ratio | P/B Ratio | Market Cap (₹ Cr) | Valuation Premium to Fair Value |
|-------------------------------|-------------|-------------|-------------------|-------------------------------|
| Data Patterns (India) Ltd | **66.82x** | 9.42x | 14,334.3 | 807% above fair value |
| Hindustan Aeronautics Ltd | 36.03x | Not shown | 297,839.0 | Moderate |
| Bharat Electronics Ltd | 49.76x | Not shown | 272,033.0 | Moderate |
| Bharat Dynamics Ltd | 93.06x | Not shown | 52,187.5 | High (outlier) |
| Zen Technologies Ltd | 47.45x | Not shown | 12,974.3 | Moderate |
| Astra Microwave Products Ltd | 62.07x | Not shown | 9,531.5 | Moderate |
| Paras Defence & Space Tech | 84.24x | Not shown | 5,195.1 | High |
| Rossell India Ltd | 17.75x | Not shown | 246.2 | Low |
- **Industry Median P/E:** 62.07x
- **Industry P/E Range:** 17.75x (lowest) to 93.06x (highest).
## Highlights
- Data Patterns’ **P/E of 66.82x** is above the industry average (60.15x) and close to the median, but its fair value premium (+807%) is among the highest in the sector—suggesting investors are factoring in strong order flows, rapid earnings growth, and superior margins.
- Price-to-book ratio of **9.42x** further confirms valuation stretching compared to most established defense peers.
- Only Bharat Dynamics and Paras Defence show similar or greater valuation multiples, usually reflecting cyclical earnings or momentum phases rather than long-term sustainability.
- Other large peers—such as Hindustan Aeronautics and Bharat Electronics—have lower P/E ratios despite bigger size and similar growth rates, indicating more reasonable market expectations.
## Takeaway
- **Data Patterns’ current valuation is at a substantial premium** to both its intrinsic value and most sector peers, justified only if its high growth sustains and market conditions remain favorable.
## Investment Outlook
- **Strengths:** High ROCE/ROE, strong sector tailwinds, margin leadership, and robust order book.
- **Risks:** Valuation premium (trading 807% above median fair value), short-term volatility possible if sector sentiment reverses.
- **Conclusion:** Data Patterns is favored for long-term growth but caution is advised for fresh entry at current levels; consider adding only on market dips and sector pullbacks.
[

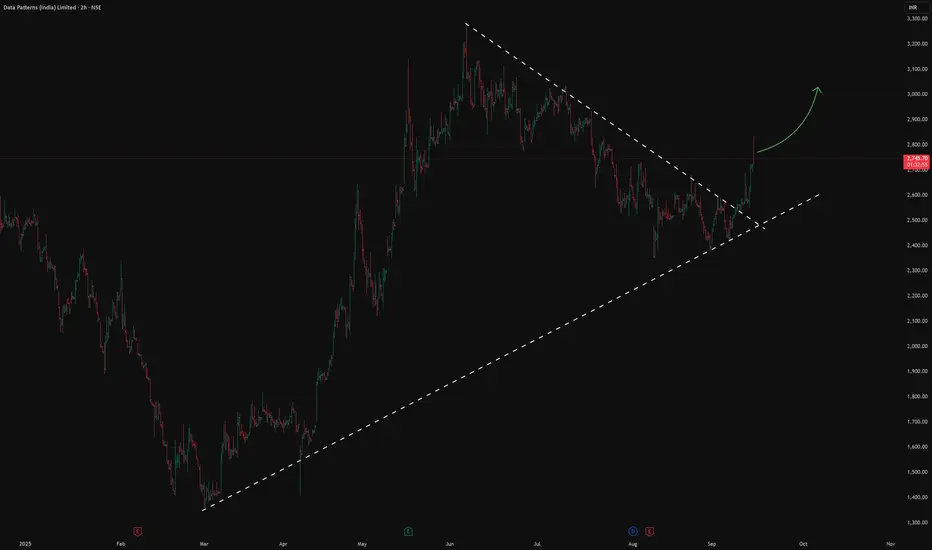
Impulse underway.Stock seems to be moving in an impulsive manner.We can see fractal nature of the price over here as a larger degree impulse's wave 3 has been sub divided in another 5 wave,of which it seems like we are done with 4 waves,and 5th of 3rd has jut commenced.going ahead we can see decent up move in the stock price from current market price of 2778.
once can go long at 2778 with a stop-loss of 2626 on the downside and a target of 3038-3200 giving us a risk reward of atleast 1:2.
Disclaimer :This are just my views on the stock and elliot wave analysis presented is just for my future reference.No position should solely be taken on the basis of this analysis.
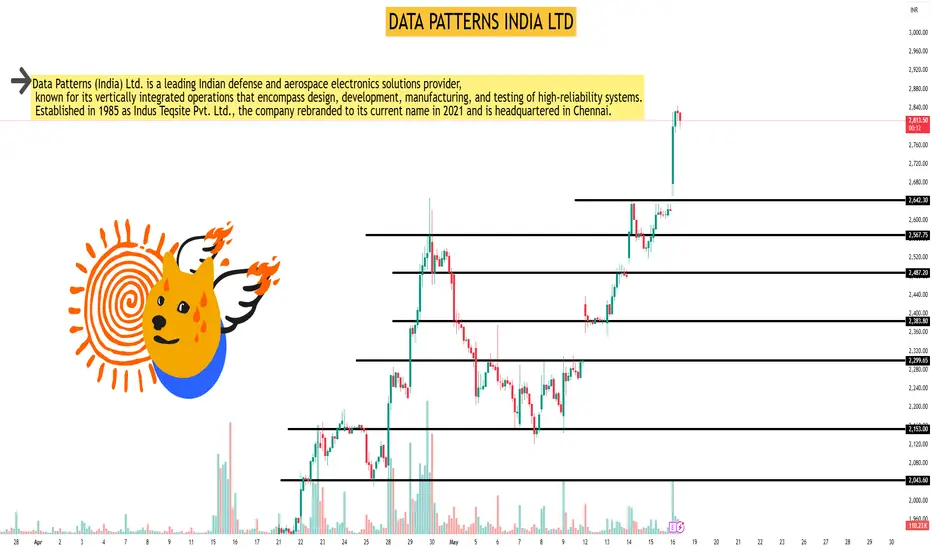
Data Patterns: Brain behind India’s missile, radar & ISRO tech.NSE:DATAPATTNS
🏢 Company Overview:
Data Patterns is a vertically integrated defense and aerospace electronics solutions provider. It designs, develops, manufactures, and tests advanced electronic systems used in:
Radar, Electronic Warfare
Avionics, Missile Systems
Satcom, Communication & Surveillance
It’s one of the few Indian defense electronics companies with end-to-end capabilities—from design to delivery.
📈 Fundamental Analysis:
✅ Key Financials (FY24-25 Estimates):
Market Cap ₹13,000+ Cr
Revenue (FY24) ₹480–500 Cr
EBITDA Margin ~38%
PAT Margin ~28–30%
ROE / ROCE 25%+ / 30%+
Debt to Equity 0 (Debt-free)
P/E Ratio ~70x (Premium)
🧩 Strengths:
Strong order book visibility with over ₹900 Cr+ backlog.
In-house R&D and full control over hardware + software.
Supplied systems to ISRO, DRDO, BEL, HAL — proven credibility.
High margin & asset-light business model.
⚠️ Risks:
Heavy dependency on government contracts (lumpy revenue).
High valuations — pricing in future growth.
Competition from global defense OEMs and local PSU giants.
📊 Technical Analysis (As of July 2025):
🧾 Price Action Summary:
CMP: ₹2,880 (Example)
52-Week Range: ₹1,650 – ₹2,980
Trend: Strong uptrend since Jan 2025
Support Zone: ₹2,550 – ₹2,650
Resistance: ₹3,000 (psychological and technical resistance)
🔍 Indicators:
200 EMA: ₹2,200 (Stock trading well above long-term average)
MACD: Positive with histogram expanding
RSI: 71 – Overbought, watch for pullbacks
Volume: Spikes near breakout levels – confirms strength
📉 Short-Term View:
Likely to consolidate near ₹2,800–₹3,000
Fresh breakout above ₹3,000 may lead to ₹3,400–₹3,600 zone
🚀 Future Growth Prospects:
🛰️ 1. Defense Capex Boom:
Indian Government’s “Atmanirbhar Bharat” push & higher defense budget directly benefits defense tech firms like Data Patterns.
🧠 2. R&D & IP-Led Growth:
Owns IP of most products – high operating leverage and export potential.
🌍 3. Export Market Entry:
Partnering with foreign OEMs; growing traction in South-East Asia, Middle East.
🛠️ 4. Order Book Strength:
High-margin orders across radar, avionics, and missile sub-systems.
Client base includes DRDO, BrahMos, BEL, ISRO, HAL – strong pipeline ahead.
📝 Conclusion:
Parameter Verdict
Fundamentals 🔵 Very Strong (Debt-free, high ROCE)
Technicals 🟢 Bullish (Watch ₹3,000 zone)
Valuation 🟡 Expensive but justified by moat
Long-Term View ✅ Positive – IP-driven defense electronics play
Short-Term View 🔄 Wait for breakout or buy on dips near ₹2,600
=====================================================
=====================================================
⚠️ Disclaimer:
This analysis is for educational and informational purposes only.
We are not SEBI-registered analysts or advisors.
This is our personal view based on available data and market trends.
Please consult your SEBI-registered investment advisor before making any investment or trading decisions.
You are solely responsible for any financial decisions you make based on this content.
========================
Trade Secrets By Pratik
========================
DATAPATTNS
DATA PATTERNS has been making HH-HL formation. Recently broke an old resistance, moved up, re-tested and started moving up again.
Keep following it, there is probability of an upside move.
✅ If you like my analysis, please follow me as a token of appreciation :)
in.tradingview.com/u/SatpalS/
📌 For learning and educational purposes only, not a recommendation. Please consult your financial advisor before investing.
Defence weak or fueling up for more heightdefence sector is bullish and in momentum even after major stock pullback in this sector datapttns is strong so look into this for a swing need eod close above 2894
DATA PATTERNS INDIA LTD BREAKOUT STOCK🚨 Breakout Watch: Data Pattern 🚨
Bullish above ₹2980 (Closing Basis)
📍 CMP: ₹2865 | 🎯 Short-Term Target: ₹3500–₹4000
❌ Pattern Negated Below: ₹2450
Price trades firmly above the 50D / 100D / 200D MAs, confirming long-term strength.
RSI remains in the bullish zone across all timeframes (Daily: 69.7 | Weekly: 66.96 | Monthly: 60.04).
ADX at 35.14 with a wide DMI spread of 64.37% signals a strong bullish trend.
Stock is above the Ichimoku Cloud with a solid bullish crossover (Tenkan > Kijun).
Bollinger Bands and Donchian Channel show high-range potential with nearly 48% width each.
🔥 Watch for breakout above ₹2980 — upside momentum looks strong!
📉 Invalid below ₹2450
(For Educational Purpose Only)
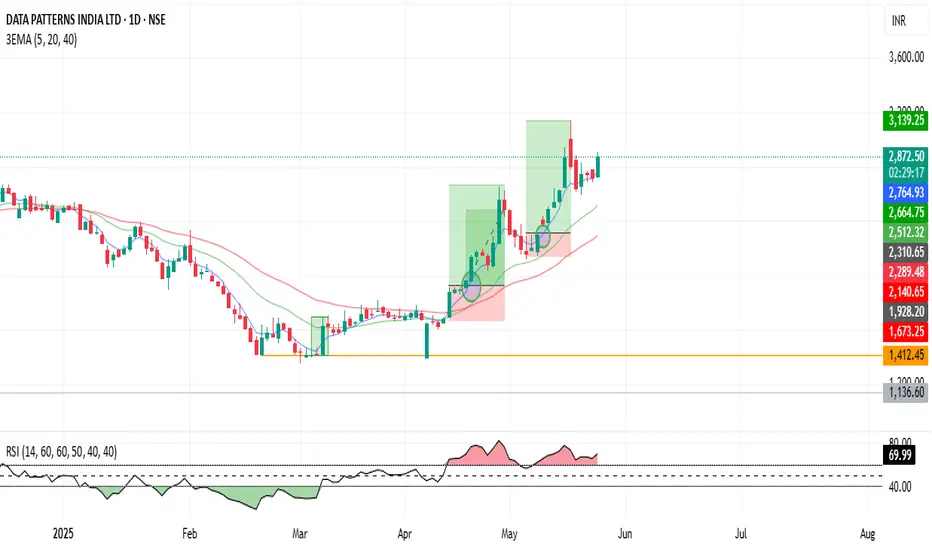
DATAPATTNS (How to Play 20-40 Crossover)When a 20-day Exponential Moving Average (EMA) crosses above a 40-day EMA, it is generally considered a bullish signal, suggesting a potential uptrend in the asset's price. This "Golden Cross" can indicate that short-term momentum is outperforming long-term trends, potentially leading to further price increases.
But after that when candle cross above 5 EMA just take your buy position. Hold for next 5 days or wait for next one big candle with in 5-6 days & then after one red candle which completely without touch 5EMA. that day exit our swing position.
(The 5 EMA trading strategy involves using the 5-day Exponential Moving Average (EMA) to identify potential entry and exit points for trades. It's a popular strategy)
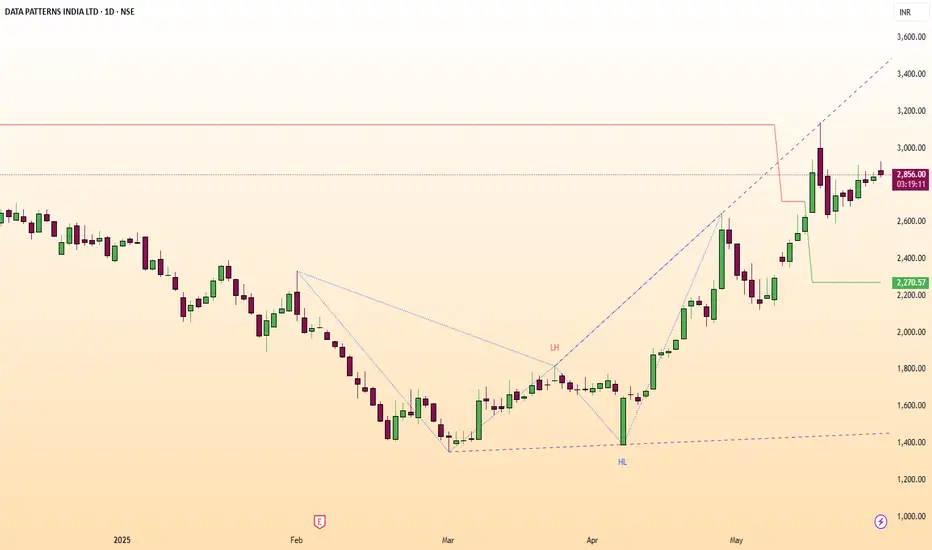
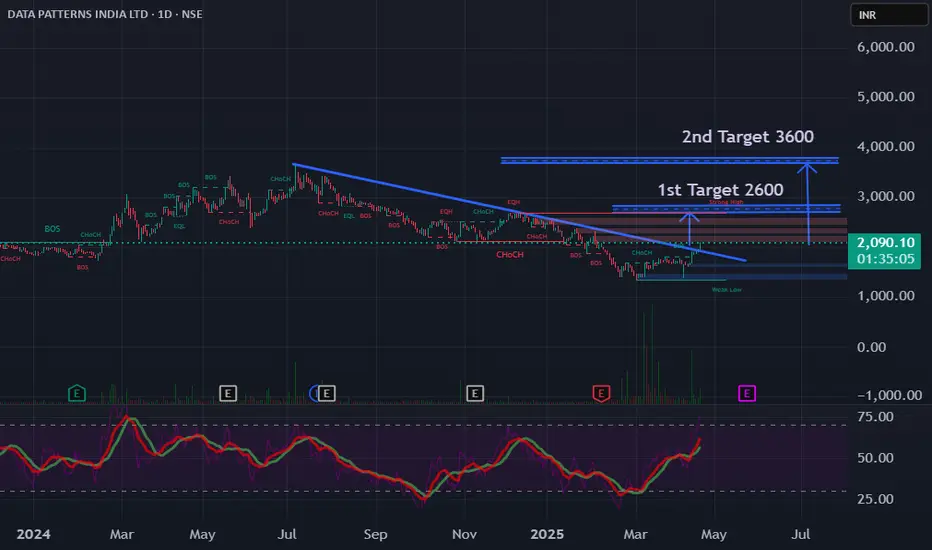
Trend Breakout - DatapattnsDATAPATTNS
Data Patterns (India) Limited is one of the fastest-growing companies in the Defence and Aerospace Electronics sector in India.
Valid Points
Trend line Breakout and Trade good volume
Stock trade above RSI 50.
Time Frame
1st Target 2600 - ( 3 to 6 month )
2nd Target 3600 - ( 6 to 1 Year )
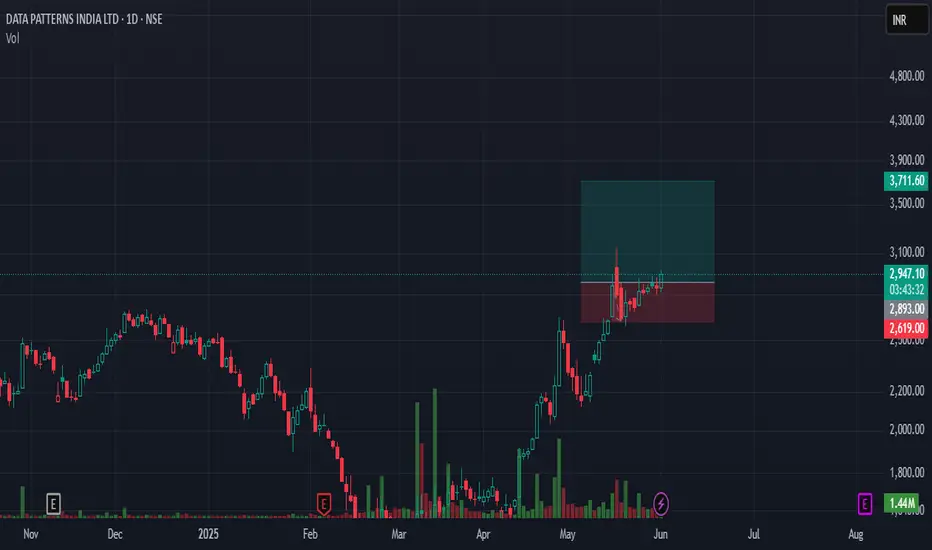
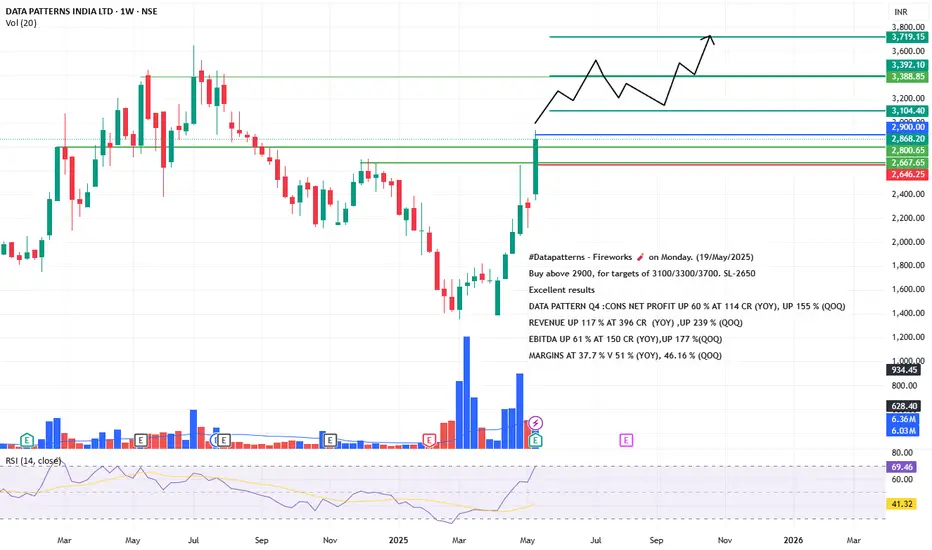
DataPatterns - Ready to Fly. Excellent Results. Buy abv 2900#Datapatterns - Fireworks 🧨 on Monday. (19/May/2025)
Buy above 2900, for targets of 3100/3300/3700. SL-2650. Invalid below 2900.
Disclaimer : Educational content. Please do your own research.
Results Highlights (FY 2024-25)
Operating Revenue: ₹708.4 Cr (up 36% YoY)
Total Income: ₹754.7 Cr (up 33% YoY)
EBITDA: ₹275 Cr (up 24% YoY)
Profit Before Tax (PBT): ₹295.3 Cr (up 22% YoY)
Profit After Tax (PAT): ₹221.8 Cr (up 22% YoY)
PAT Margin: 31% (vs. 35% last year; slight margin compression)
Final Dividend: ₹7.90/share (390% of face value)
Quarterly Performance (Q4 FY25 vs Q4 FY24)
Total Revenue: ₹406.8 Cr (up 109%)
Revenue from Operations: ₹396.2 Cr (up 117%)
EBITDA: ₹149.5 Cr (up 61%)
PAT: ₹114.1 Cr (up 61%)
Order Book
Order Book as on March 31, 2025: ₹729.8 Cr
Orders Secured in FY25: ₹355 Cr
Orders in Q1 FY26 (so far): ₹40.2 Cr
Negotiated but not yet received: ₹91.7 Cr
Potential Order Book (incl. negotiated): ₹860.5 Cr
Order Book (April 2024): ₹1,083 Cr (decline due to high execution)
Management Commentary
Strong revenue growth and consistent profitability.
Q4 results in line with guidance, reflecting operational excellence.
Optimistic about robust order inflows and confident in sustaining growth.
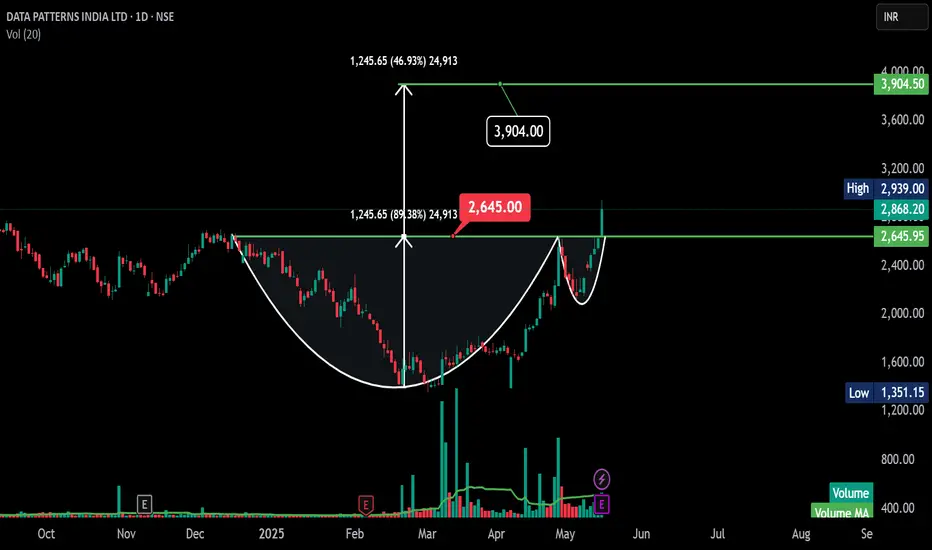
DATAPATTNS - Daily - Breakout -CnHDATA PATTERNS INDIA LTD daily chart.
The most prominent feature here is a well-defined **cup and handle** pattern, which is typically a bullish continuation signal.
Here's a simple breakdown:
* **Cup:** A rounded bottom formation that occurred roughly between early November 2024 and late April 2025. This suggests a period of price consolidation before a potential upward move.
* **Handle:** After reaching a high around ₹2,845.50, the price has pulled back and is consolidating in a smaller, slightly downward-sloping pattern (the handle) between late April and mid-May 2025.
* **Breakout Level:** The horizontal line around ₹2,845.50 acts as the neckline or resistance. A sustained break above this level would confirm the cup and handle pattern.
* **Target:** Potential target around ₹3,904.50. This target is often estimated by measuring the depth of the cup and adding it to the breakout level.
**In simple terms:**
The stock price formed a rounded bottom (the cup), then went up and is now in a smaller pullback (the handle). If it breaks above the ₹2,868 level, it could potentially move towards the ₹3,904 area.
**Things to watch out for:**
* **Breakout Confirmation:** We need to see a clear break above ₹2,868.20 with strong buying volume to confirm the pattern.
* **Handle Formation:** The handle should ideally be a relatively shallow and short-lived consolidation.
* **Volume on Breakout:** Increased volume during the breakout would add more confidence to the bullish scenario.
Overall, the chart for DATA PATTERNS INDIA LTD suggests a bullish outlook based on the cup and handle pattern, with a potential target around ₹3,904.50 upon a successful breakout above ₹2,868.20.
DATA PATTERNS INDIA LTDAs of May 16, 2025, Data Patterns (India) Ltd. (NSE: DATAPATTNS) exhibits a mildly bullish trend on the 45-minute timeframe, based on key technical indicators.
📊 45-Minute Technical Snapshot
Current Price: ₹2,821.20
20 SMA: ₹1,569.44
50 SMA: ₹1,546.58
Signal: Mild Bullish
Latest Price / MA Crossover: 7 ticks back
Crossover Type: Bullish
Analysis: Mild 20MA up, Mild 50 MA Uptrend, Mild Buy
📈 Additional Technical Indicators
Relative Strength Index (RSI): 72.31
Rate of Change (ROC): 56.07
Average Directional Index (ADX): 25.6
📉 Candlestick Patterns
Bullish Marubozu: Indicates strong buying pressure.
Long White Candle: Suggests bullish momentum.
📌 Summary
The 45-minute technical analysis of Data Patterns (India) Ltd. indicates a mildly bullish trend, supported by moving average crossovers and positive momentum indicators. However, the RSI suggests the stock is approaching overbought territory, warranting cautious optimism.
Data Patterns (India) Ltd : DATAPATTNS"Technicals and sentiment align—bullish outlook ahead."
Stock is about to give a fresh breakout after a consolidation zone...

Data Patterns - Trendline BO with High Vol. - Chart of the MonthNSE:DATAPATTNS showed good price action this month, breaking the trendline with high volumes, showcasing strength in this market. Defence Industry Stocks are showing relative strength and looking to continue that further, qualifying for my Chart of the Month.
About:
NSE:DATAPATTNS is one of the fastest-growing companies in the Defence and Aerospace Electronics sector in India. It is among the few vertically integrated defence
and aerospace electronics solutions providers catering to the indigenously developed defence products industry. It is focused on in-house development and manufacturing facilities led by innovation and design, and development efforts. It has been in business for over 35 years. It has supplied products catering to all the platforms, viz., space, air, land and sea, including products for LCA-Tejas.
Trade Setup:
Buy on Dips near Trendline Support or the base for Positional Traders and on breakout of the candle high for Swing Traders.
Target:
Around ATH Zones, ideally, if sustained,d can go further up.
Stop Loss:
Entry Candle Low For Swing Traders and Base Marked for Positional Traders.
📌Thank you for exploring my idea! I hope you found it valuable.
🙏FLLOW for more
👍BOOST if useful
✍️COMMENT below with your views.
Meanwhile, check out my other stock ideas on the right side until this trade is activated. I would love your feedback.
Disclaimer: "I am not SEBI REGISTERED RESEARCH ANALYST AND INVESTMENT ADVISER."
This analysis is intended solely for informational and educational purposes and should not be interpreted as financial advice. It is advisable to consult a qualified financial advisor or conduct thorough research before making investment decisions.
