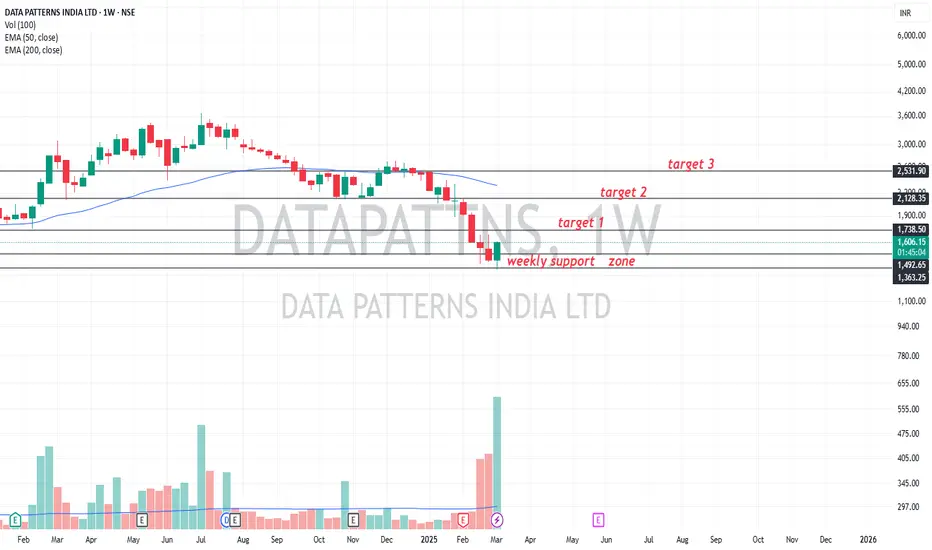
data patterns it is taking support at the weekly support zone ...sl can be placed according to ones risk appetite as its on the support zone...targets are mentioned in the chart ....
Trade ideas
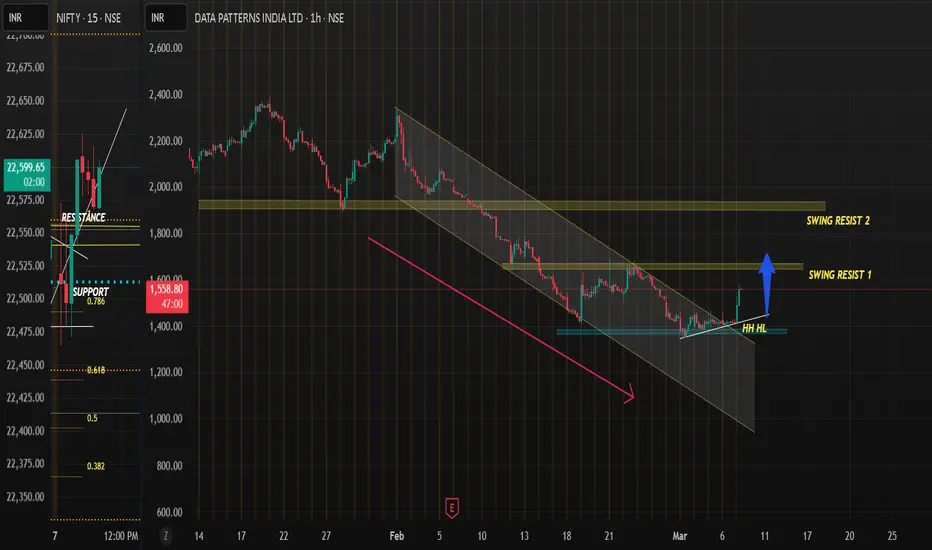
SWING OBSERVATION - DATA PATTERNS
Script showing good intraday momentum bounced from support area creating HH HL around 1420 , broke out of downward channel may test swing resistance 1 around 1670 levels & further 2nd swing Resist.
DATAPATTNS#DATAPATTNS broken out of the base on 4th December with a good volume and retested into the base. It is popping out of the base once again with above average volume. Stop Loss 2380 Closing basis

Data Patterns - showing interesting patterns Weekly Chart:
Stock bounce from 2111 (previous resistance (dec'23) turned support)
Last week close above weekly 20 and 50 EMA suggesting near term bullish bias
Daily Chart:
recently Created double bottom at demand zone
Stock crossed 20,50 and 200 EMA
price trying to retest 200 EMA and Horizontal support
MACD, RSI and ADX all supporting bullish sentiments
Hourly Chart:
Created series of Higher-Highs and Higher-Low Price action
Trade Execution
Buy 2600-2500 range
Stop Loss below 2100 weekly closing basis
Target previous swing high 3410 OR trail with 20 EMA daily OR Super Trend 10,3 daily

Data Patterns: Triple Bottom Breakout Title: "Data Patterns: Triple Bottom Breakout with Institutional Support"
Stock: Data Patterns
Analysis:
Data Patterns has recently given a Triple Bottom Breakout, signaling a potential trend reversal after a period of consolidation. Institutional support remains strong, despite a correction following slightly weaker previous quarter financials.
Key Highlights:
Mutual Fund Holdings: Increased from 6.14% to 6.48% in the Sep 2024 quarter.
FII Holdings: Remain robust, showcasing consistent confidence in the stock.
Correction Complete: The stock corrected earlier due to weaker financial results but now appears to be resuming its upward trajectory.
Technical Setup:
Pattern: Triple bottom breakout on the daily chart.
Support: Established around the breakout level, providing a strong base.
Momentum: Watch for increased volume to confirm the breakout.
Trade Plan:
Entry: Post-breakout confirmation above current levels.
Target: Short-term target at ₹1520; mid-term target at ₹1600.
Stop Loss: Below ₹1400 to manage risk.
Disclaimer:
This analysis is for educational and informational purposes only and should not be considered as financial advice. Please conduct your own research or consult a financial advisor before making any investment decisions.

Look at Data Patterns stock Data Patterns Stock may gain momentum if it breakouts trendline.
Then our entry will be 2350 and our stop loss will be 2140 and target will be 3040.
RSI is around 50, Stochastic is positive cross over and MACD is also positive cross over.

Multi-year support trendline; good RSIExcellent set up of the trade
-- multi year trendline support
-- at recent resistance support line
-- great RSI
T1: 515
T2: 1000
Just an idea.

Data Patterns Clear BUY!Stock Analysis Overview
Technical Support: Strong support identified near the 2,250 level based on current data patterns.
Fundamental Strength: The company remains fundamentally robust, showcasing solid financial health and growth prospects.
Price Correction: The stock has retraced approximately 40% from its recent peak, presenting a potential entry point.
Investment Classification: Positioned as a defensive growth stock, offering both stability and growth potential.

DATAPATTNS TARGET 3500Cmp :- 2279.75 ₹
BUY :- 2200 ₹
Target :- 3500+++
Stop loss :- 2065
Data Patterns is a vertically integrated Defence and Aerospace electronics solutions provider catering to the indigenously developed defence products industry. Data Patterns' key strength is founded on over two decade history of developing high reliability products in this domain with the broad capability to develop and manufacture any high reliability product. Data Patterns has developed several electronic systems for it's customers with the support of it's captive manufacturing facility and attention to detail. Data Patterns achieves it's philosophy of manufacturing products with the reliability of life span expected in it's market domain.

Data patterns Based on price moving and Ema
positions Up move possibility is higher
This is only for educational purposes.

DATAPATTNS#DATAPATTNS, after the recent pull back, stock took the support from the demand zone and bounced swiftly with good volume.

ATH breakoutGood volume buildup in daily as well as in weekly timeframe.
All-time high breakout with good volume buildup and highest volume buildup in the last one year.
But the candle has made long wick, wait for conformation or retest at 3400~3200 zone.
The share price moving in a parallel channel trend after the FII stakes has increased.
Fundamental are good.
FII & DII stakes are increased significantly.
NOTE: I do my analysis, do yours before trade.

what a break out after 3444 with in some time gone up to 3655last top 3443.90 after breaking previous top 3443.9 with in some time (in minutes ) gone up to 3655

Data patterns Based on price moving and Ema
positions Up move possibility is higher
This is only for educational purposes.

DATA PATTNS GOOD FOR SWING TRADEStock Analysis: DATA PATTERNS INDIA LTD
Date: June 26, 2024
Observation:
DATA PATTERNS INDIA LTD is approaching a key resistance level around 3,045-3,050 INR, as indicated by the black horizontal trendline.
The stock is currently forming a consolidation pattern just below this resistance.
A breakout above this resistance could indicate a bullish trend continuation.
Technical Indicators:
Price Action: The stock closed at 2,983.85 INR, showing a slight positive movement of +0.41% for the day.
Volume: Moderate volume suggests cautious buying interest as the price nears resistance.
Moving Average: The blue line represents the 50-day moving average, providing support and confirming the upward trend.
Potential Scenarios:
Bullish Breakout: If the stock breaks above the resistance level with strong volume, it could indicate a bullish trend continuation.
Rejection at Resistance: If the stock fails to break through the resistance, it may pull back to support levels around 2,800-2,850 INR.
Trading Plan:
Entry: Consider entering a long position above 3,050 INR with confirmation of increased volume.
Stop-Loss: Set a stop-loss below the recent low at 2,920 INR to manage risk.
Target: Initial target can be set at 3,200 INR, with further upside potential if the breakout is strong.
Hashtags:
#StockMarket #TradingView #TechnicalAnalysis #DataPatternsIndia #SwingTrading #BreakoutTrading

Data Patterns, a defence and aerospace proxy ready to move?-In a very long base, last time it breakout long base gave 80% move in just 20 days. (always read history of stock how it move, how to form base, how it react to moving averages, how volumes come etc etc)
-from strong sector (sector is always imp as strong sector's stocks move faster)
-Good shakeout and Fake-out also there means kicking weak players by hunting their SLs (stoplosses)
-Inside Bar on latest candle
-Volatility contraction

DATAPATTERN // 02-06-24 // at Support Area This share trading at support area, may give 12% profit. Take position as per your risk reward ratio and that is not recommended only for educational purposes.

Rising Wedge patternGood volume build up in daily time frame.
Rising wedge pattern breakout with good volume. wait for conformation either retest on trendline or breakout of high of current candle with good volume and should sustain above it.
NOTE: i do my analysis, do yours before trade.

DATA PATTERN 📈 📈 Could move upward to 📈
8200 -- 8300 Within ( 25th Nov 2024 -- 7th April 2025 )
Disclaimer:
Its a personal view not a financial advise and I assume no responsibility and liability whatever outcome arises.

Clock up 📈 2500 within 10th Aug -- 11th Oct
Disclaimer :
It's a personal view not a financial advise and I assume no responsibility and liability whatever outcome arises.

Breakout Soon in Data Patterns Bullish Wedge Breakout setup
RSI near 65 and rising
Trading above EMA50
Volume accumulation
Result on 18th May, can influence the direction
Keep in your watchlist !

Data Patterns Ltd: Analysis & Trading InsightsAnalysis:
Data Patterns Ltd. boasts a market capitalization of 15,747 crore with a high PE ratio of 94.90 and a beta of 1.09. Its 52-week high/low is 3,208.95/1,512.00.
The stock is currently exhibiting a descending channel pattern, finding support at the 200 EMA while facing resistance from the 20/50/100 EMAs. Friday's trading session, on 10/05/2024, closed with a doji pattern, indicating indecisiveness among buyers and sellers.
Despite its strong fundamentals, including a high PE ratio, PB ratio, and EPS, investors should conduct thorough research before considering trading or investing in Data Patterns Ltd.
Disclaimer:
The following analysis is for informational purposes only and should not be considered as investment advice. Investors should conduct their own research or consult with a financial advisor before making any investment decisions. Investing in stocks carries inherent risks.

Data Patterns (India) Ltd - Long Setup, Move is ON...#DATAPATTNS trading above Resistance of 3048
Next Resistance is at 4066
Support is at 2136
Here are previous charts:
Chart is self explanatory. Levels of breakout, possible up-moves (where stock may find resistances) and support (close below which, setup will be invalidated) are clearly defined.
Disclaimer: This is for demonstration and educational purpose only. This is not buying or selling recommendations. I am not SEBI registered. Please consult your financial advisor before taking any trade.
