DBREALTY BREAKOUT STOCK📌 Stock Name: DBREALTY
(For Educational Purpose Only)
🔼 Breakout Above: 195 on Closing Basis
🚀 Ready for Upside : 240
🔽 Weak Below: 160
💰 Price: 190
📦 Volume
🔻 -63.63% vs previous session (Low Volume)
⚡ Volatility (ATR%)
📉 Current ATR%: 4.16%
📊 20-Day Avg ATR%: 5.14%
📈 Moving Averages
✅ Price > 50, 100, 200 DMA
🌟 Golden Crossover: 50D > 200D → Bullish
💪 RSI
🔹 Daily RSI: 60.41 → Bullish
🔹 Weekly RSI: 57.66 → Bullish
🔹 Monthly RSI: 55.67 → Bullish
📊 ADX / DMI
🟢 ADX: 31.64 (▲ 2.77%) → Strong Trend
📏 DMI Diff: 59.89%
✅ Daily / Weekly / Monthly: Bullish
📉 Donchian Channel
✅ Price > Middle Band
➖ Bands Flat
📏 Width: 23.24%
☁️ Ichimoku Cloud
✅ Price > Cloud
🔺 Tenkan > Kijun → Bullish Setup
🌫️ Future Cloud Width: 14.42%
📊 Bollinger Bands
✅ Price > Middle Band
📈 Bands Rising → Bullish Setup
📏 Width: 21%
DBREALTY trade ideas
BUY TODAY SELL TOMORROW for 5%DON’T HAVE TIME TO MANAGE YOUR TRADES?
- Take BTST trades at 3:25 pm every day
- Try to exit by taking 4-7% profit of each trade
- SL can also be maintained as closing below the low of the breakout candle
Now, why do I prefer BTST over swing trades? The primary reason is that I have observed that 90% of the stocks give most of the movement in just 1-2 days and the rest of the time they either consolidate or fall
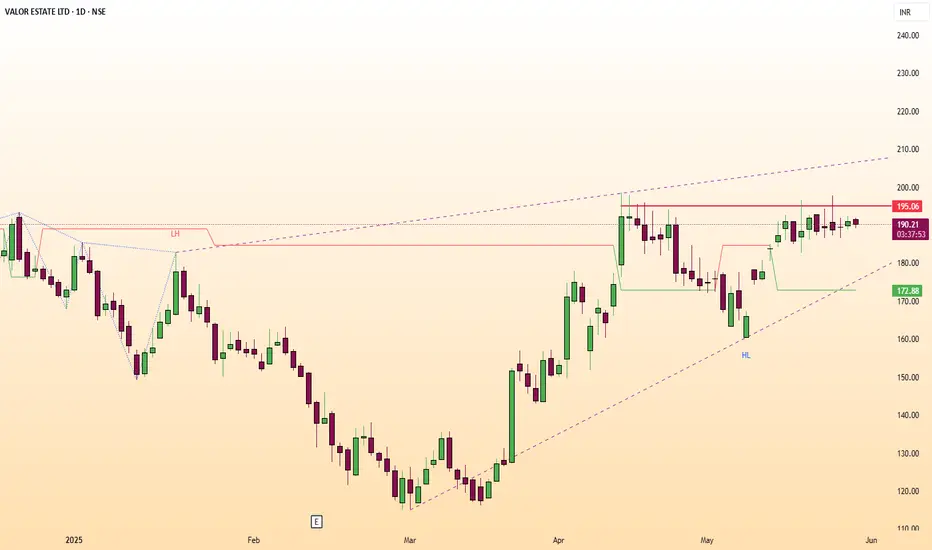
Trendline Breakout in DBREALTY
BUY TODAY SELL TOMORROW for 5%

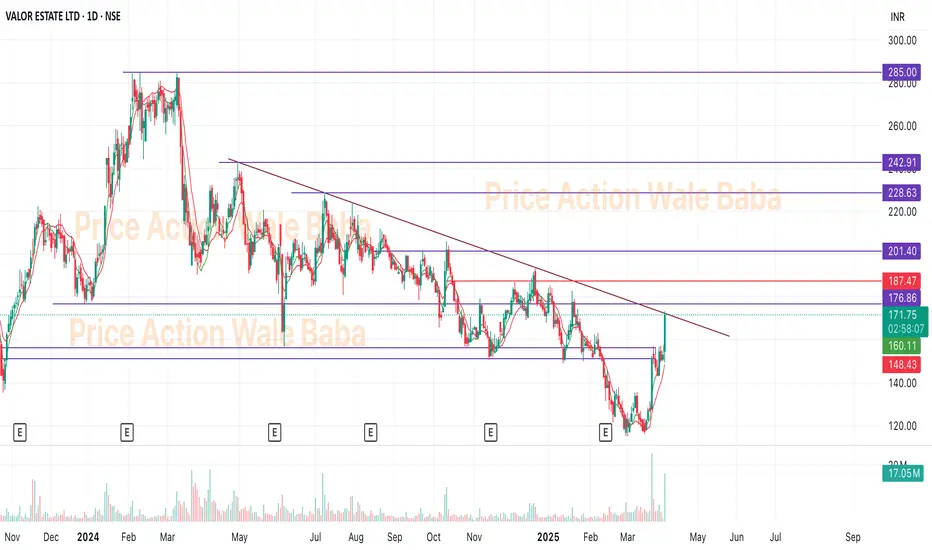
DB Realty - Valor Estate cmp 192.25 by Weekly Chart viewDB Realty - Valor Estate cmp 192.25 by Weekly Chart view
* Support Zone 177 to 187 Price Band
* Resistance Zone 222 to 232 Price Band
* Falling Resistance Trendline broken and price momentum sustained
* Volumes are seen spiking over the past few weeks well above avg trade quantity
* Thou falling yet Bullish Double Rounding Bottoms made with neckline at Support zone

DBReality - Near BreakoutDB Reality near breakout.
After long consolidation, it's ready to give big up move.
It was trading in the channel and consolidation going to end soon.
Hold for the next 1-2 year for the target of 300.
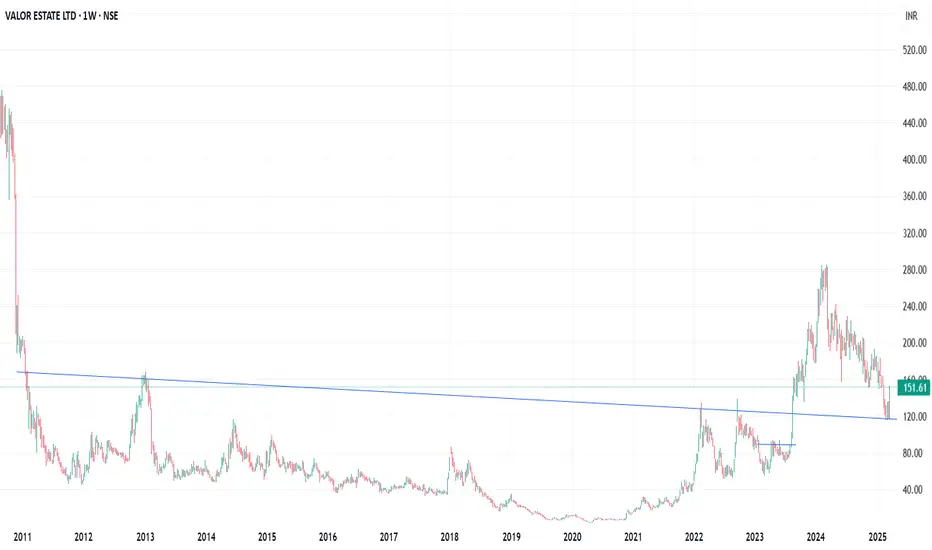
DBREALTY - Weekly AnalysisIn the Weekly Chart of DBREALTY,
we can see that; it has given a very strong Bounce back from strongest support Trendline.
wait for a Halt or retrace candle and then enter with SL and Targets.
DB REALITY(VALOR ESTATE)Hi friends,
The stocks looks promising and it is in a good buying zone from
Range 195-210
SL- 155 WCB (Weekly Closing Basis)
Targets given on charts
The stock is good for mid-term to long-term holding with sl and trail.
I hope you all like my views. 🌸
Drop a comment if you guys like it.

Valor Estate Ltd.#### 1. **Price Chart Analysis (Upper Section)**
- **Uptrend Channel**: The price is moving within a clearly defined upward channel, indicating a long-term uptrend.
- **Support and Resistance**:
- **Channel Support**: The price has touched the channel support multiple times, confirming its validity.
- **Horizontal Resistance**: There is a horizontal resistance line which was recently broken, suggesting a bullish breakout.
- **Chart Patterns**:
- **Falling Wedge**: A falling wedge pattern is identified near the resistance breakout, which is typically a bullish pattern. The breakout from this pattern adds further confirmation to the uptrend.
#### 2. **Volume Analysis (Below Price Chart)**
- **Volume Spike**: There is a noticeable increase in volume coinciding with the breakout, indicating strong buying interest.
- **Volume Profile**: The volume profile highlights significant trading activity at the current price levels, providing a strong support base.
#### 3. **RSI Analysis (Lower Section)**
- **RSI Trendlines with Breakouts**: The RSI is at 54.85, which is in the neutral zone.
- **Historical Breakouts**: The chart shows several RSI breakout points. The recent RSI trendline shows a potential bullish divergence as it moves upwards, indicating increasing momentum.
- **Volume Highlight**: Volume is also highlighted in the RSI section, showing correlation between volume spikes and price movement.
### Interpretation:
- **Bullish Indicators**:
- **Channel Uptrend**: The price consistently follows an upward channel.
- **Resistance Breakout**: The breakout above the horizontal resistance and falling wedge pattern indicates a potential continuation of the bullish trend.
- **Volume Support**: Strong volume during the breakout suggests institutional buying.
- **RSI Neutral**: While the RSI is neutral, it is moving upward, indicating potential bullish momentum.
### Potential Actions:
- **Long Position**:
- **Entry Point**: Considering the breakout and uptrend channel, entering around the current price levels could be a good opportunity.
- **Stop Loss**: Placing a stop loss slightly below the channel support or the recent breakout point to manage risk.
- **Monitoring RSI**: Watch the RSI for any signs of reaching overbought levels or bearish divergence.
### Conclusion:
The chart presents a strong bullish case with multiple confirming indicators such as the uptrend channel, breakout from resistance and falling wedge, and strong volume support. Careful monitoring and strategic entry points with appropriate risk management could capitalize on this bullish trend.

DB REALTY: New Trend incoming!DB REALTY is showing buyers interest at the support and currently looking attractive at CMP of 203. Enter after studying this with your setup. Targets are marked.
NOTE: I'm not a SEBI REG. Study charts before investing.

DB Realty or Valor EstateAmazing Charts
Sector in Focus
Fundamental going to get awesome in next 3-6 months..
Too many Projects lined up for next 3-6 months..
Volume is too good.. Candles are super..
Personally bought at 220 and will keep pyramiding it above now..

DBREALTY LongtermI am sharing Monthly Chart of this stock where we see a long consolidation and break out and retest of zone ready to fly, just a View Not a Reco...

DBRealty-A chance to have quick multibagger returns!DBRealty had given a multiyear monthly breakout and had given around 50% move already.
However, stock is now retesting the breakout and might come down in range of 150-180.
Safe traders can wait for a reversal pattern like morning star or bullish harami in this zone.
Such a monthly breakout had happened in Purvankara which doubled in 3 months
As realty sector is vastly outperforming, one can expect similar move from this stock as well.
which has also posted decent Q4 results.(Not trustworthy though)
Not a recommendation.

LongThis stock is HNI category stocks
2-3x potential in this stock
Breakout retest now bullish
Once more time I add
Only for education purpose

Trend reversal in DB realty Head and shoulder neckline breakdown with ema 200 break, new short can be initiate at pullback near neckline for a target for 138 and 118
Disclaimer : Analysis for education purpose only

DB Reality - let's go- taking support at important level
- real estate in uptrend hence sectoral tailwinds
- high volumes

DBREALTY - CMP 228.25. Looking Good for Swing TradeThis is to share the technical analysis with you all!
* Technical pattern: Rounding bottom in 30mins TF
* Broken horizontal resistance with powerful Bullish Candle
* Best range to enter 222-220
* Looking good for upside movement up to 15-18%


DB REALTYDB Realty Limited
Dont know fundamentals here..
Stock is in nice uptrend..
Trading plan mentioned

#DBREALTY on the verge of breakout 🚀🔥#DBREALTY on the verge of breakout 🚀 🔥
-CMP 282
-Narrow Monthly CPR
-Volume rising
-verge of supply zone breakout

DBREALTY near Ascending Triangle BODBREALTY near Ascending Triangle BO. Once the pattern breakout occured, there is a high potential to deliver 26% return in mid term. Very good volume buildup is also seen.
CMP 282
Support 260


DBREALTY bullish; above 223. ? - Monday 15 Jan.The above information does not constitute investment/trading recommendation and it is purely for educational purpose. Please check the Strategy below...
SWING Trading Strategy:
Position is created, only upon stock closing above the entry price on day closing basis and is held on for 5-10 trading sessions for larger gains (5-10%)
INTRADAY Trading Strategy:
1) Impulse upmove stage: The strong upmove (nearly upto 2% from breakoutprice) happens within five to 15 minutes. "High Risk Traders" buy in hope of another 2% upmove intraday.
"High Risk Traders" patiently wait through the Pullback-Consolidation stage to realize profits. High risk/High reward set up as breakouts may fakeout (reversal)also
2) Pullback-Consolidation stage: After the above "Impulse upmove stage"; the price may then pull back and move sideways (between "Open" price and "High" of the above "Impulse upmove stage").
Safe traders with minimum risk profile wait for a breakout from the consolidation to enter at this stage to relize high profits in the final intraday final "Breakout continuation" stage
3) Breakout continuation: Stocks often in the third stage breaks up above the "High" of the first "Impulse upmove stage" and continue to go higher again.
Both Safe Traders/High Risk Traders book profits at this stage
This do not constitute, financial, investment, trading, or other types of advice or recommendation.

DBREALTYDB realty ltd going in channel pattern. Daily breakout happened, Volume also good in this move. 218 is support for next rally to 267.

DB Realty Ltd - Fruitful days are Ahead #DBREALTY
CMP ₹.206.6
Date : 28/11/23
1) A turn around company with loss to profit
making.Weak but improving fundamentals .
Highest recovery of stock value from 52 week low.
2) Recently promoters sold nearly 3% stake
with them to clear the entire debt.
3) Hopefully a smooth ride can be
enjoyed for the coming days
Disclaimer : Post only for educational purpose. Not a buying / selling recommendation. This is only my personal view. I am not a SEBI registered analyst . Do your own analysis and act accordingly .
