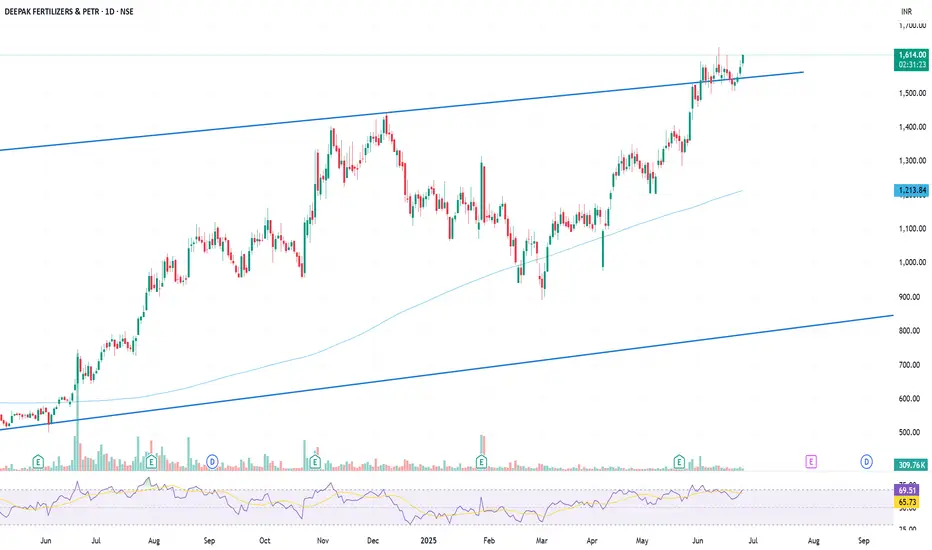
Deepak Fertilizers on fireDeepak Fertilizers should give the trendline breakout after recovering from low levels. Yesterdays runup has been validated today so waiting for trendline breakout confirmation
DEEPAKFERT trade ideas
Deepak fertilizer is ready to blast....🔍 Thesis on Deepak Fertilisers (DEEPAKFERT): Technical + Fundamental Snapshot
Technical outlook: The stock is showing bullish momentum—recent breakouts above key levels (e.g. around ₹1,450) have been met with confirmation. Indicators like moving averages and MACD lean positive, with many charts/screeners rating it a “Strong Buy” or “Buy.”
Support / Resistance context: Current price is below its 52-week high (₹888), indicating a favourable range captured with decent upside. The pullbacks have found support at prior breakout zones, which could now act as support.
Fundamentals: The company has been growing sales and profits robustly — revenue & net profit CAGR over recent years are in healthy double digits. Return on Equity (ROE) ~15-17%, debt to equity moderate (~0.6-0.7) giving some leverage but manageable.
Valuation & Risks: P/E ratio of ~18-20× is not cheap but not outrageously high relative to growth and sector peers. There are some risks: Operating margins have seen pressure; the chemicals segment has had weak demand at times. Also, while debt is manageable, interest coverage and cost pressures (input, energy etc.) remain variables.
Conclusion (balanced): Overall, Deepak Fertilisers appears to have a positive long-term fundamental base plus a bullish technical setup. Short-term, there is room for upside if the price can sustain above the breakout levels; downside risks exist if market sentiment turns or input costs rise sharply / demand softens.
Deepak Fertilisers & Petrochemicals Corp LtdDate 18.09.2025
Deepak Fertilisers & Petrochemicals Corp
Timeframe : Day Chart
Leadership
- Only manufacturer of Prilled and Medical-grade Ammonium Nitrate in India
- Leading manufacturer and marketer of IPA in India
- Only manufacturer of NP prill 24:24:0 fertilizer in India
- Market leader in Bentonite Sulphur, specialty and water-soluble fertilizers in India
Business Verticals
(1) Industrial Chemicals (IC)
(2) Technical Ammonium Nitrate (TAN)
(3) Crop Nutrition (CNB)
Revenue Breakup
Finished Goods - 94%
Traded Goods - 4%
Realty Business - 2%
Segmental Revenue
IC - 18%
TAN - 39%
CNB - 43%
Market Share
IC - 60% in CNA and 28% in DNA
TAN - 44%
CNB - #1 player in specialty & water-soluble
fertilizers in India
Expansion Projects
(1) Nitric Acid Brownfield in Dahej
(2) TAN Project in Gopalpur
Valuations
(1) Market Cap ₹ 18,152 Cr
(2) Stock P/E 18.5
(3) ROCE 16 %
(4) ROE 16 %
(5) OPM 18%
(6) PEG 1.66
(7) Sales Growth 23% (y-o-y)
(8) Profit Growth 82% (y-o-y)
(9) Promoter 45%
Regards,
Ankur

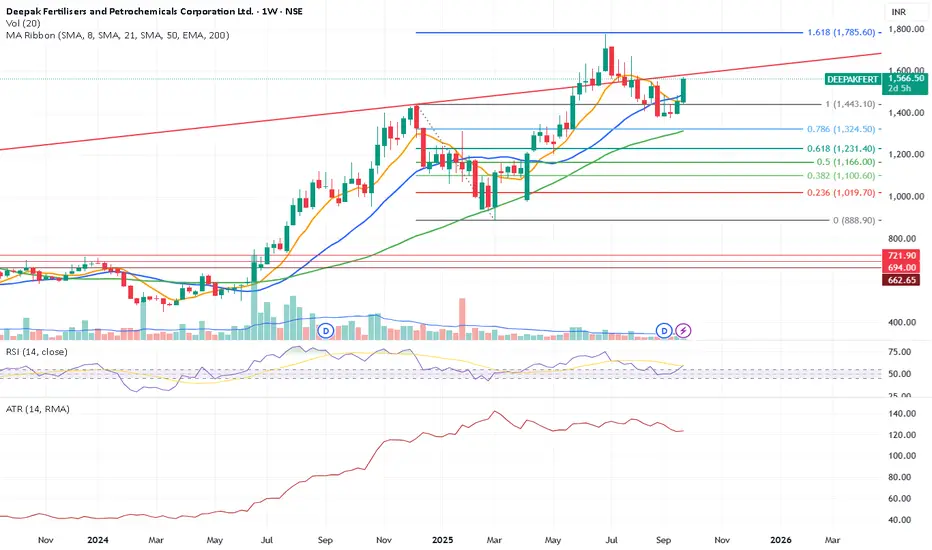
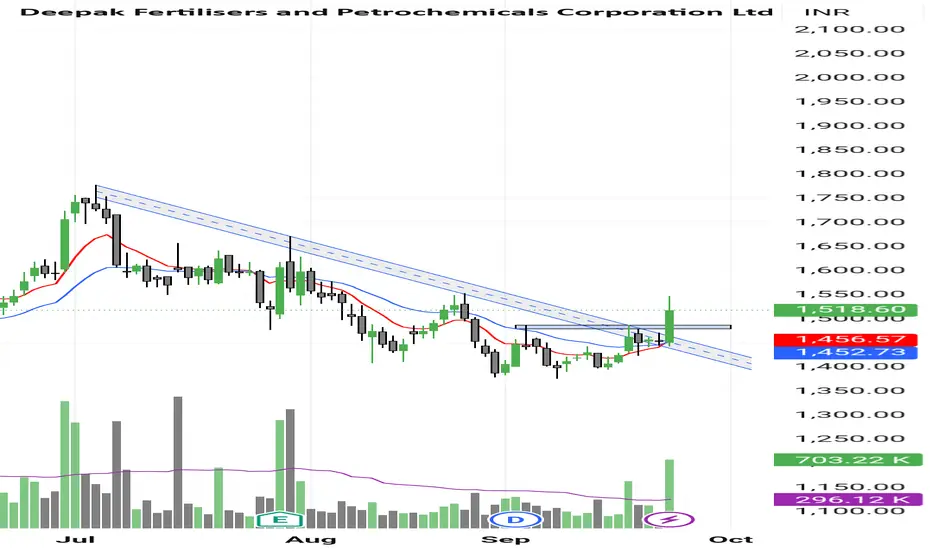
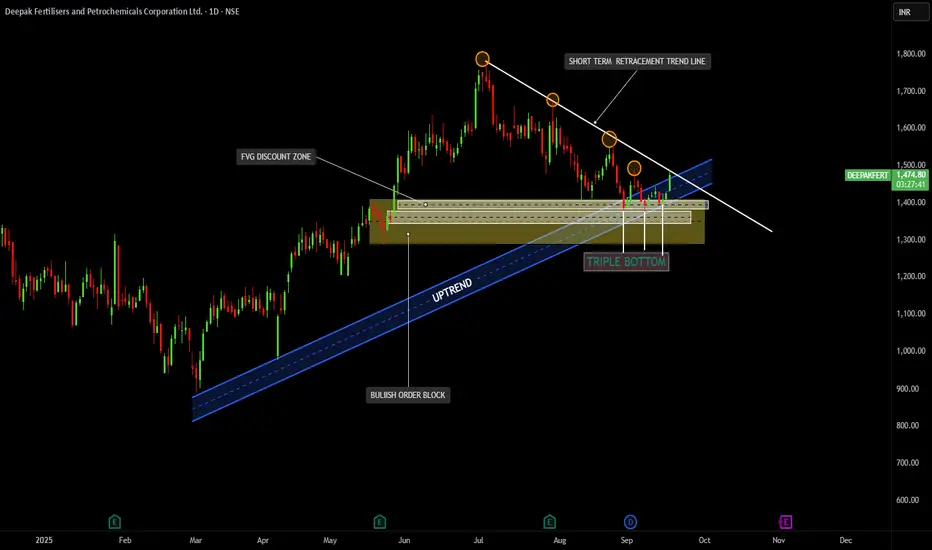
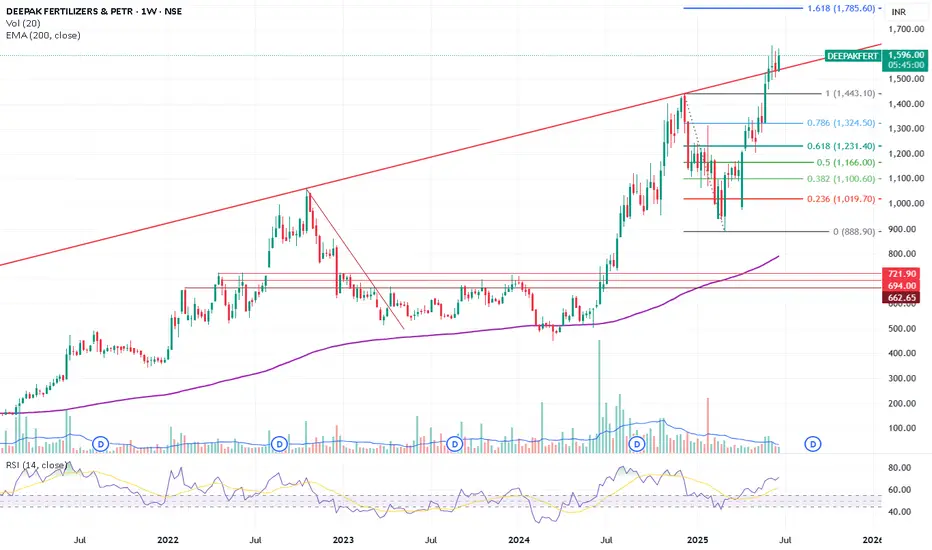
DEEPAK FERTILIZERTrend Structure:
The stock has been in a primary uptrend (marked with the blue ascending channel).
Recently, it went into a short-term retracement with a downward sloping trendline (white).
Support & Demand Zones:
Strong Bullish Order Block and FVG Discount Zone around the ₹1350 – ₹1400 level, where buyers are stepping in.
Price formed a Triple Bottom at this support, indicating strong demand and rejection of lower prices.
Pattern & Candlestick Structure:
Triple Bottom is a reversal pattern confirming that sellers are unable to push below ₹1350.
Current candles show bullish momentum, reclaiming above the retracement trendline.
Breakout:
Price has broken the short-term retracement trendline on the upside, signaling a potential end to the correction.
Fresh momentum is visible with today’s +3.70% rise, closing near ₹1478.
Volume:
Breakout accompanied with decent volume (296K), strengthening the bullish signal.
🔹 Technical Outlook:
Bullish Bias: The combination of triple bottom support, order block demand zone, and trendline breakout suggests bullish continuation.
Immediate Resistance Levels: ₹1520 – ₹1560 (near-term supply zone).
Major Resistance: ₹1650 – ₹1700 (previous swing highs).
Support Levels: ₹1400 (strong demand zone), followed by ₹1320 if broken.
🔹 Trading View:
Aggressive Traders: Can look for long entries near ₹1450–₹1470 with a stop loss below ₹1400.
Conservative Traders: Wait for a daily close above ₹1520 to confirm strength before entering.
Targets: First target ₹1560, second target ₹1650–₹1700
Watchable Level for Deepak Fertilizers Deepak Fertilizers, the ₹2050 level is a key watchable zone. A decisive move above this level could indicate potential upside momentum, while failure to break it might lead to consolidation or a pullback. Traders should monitor price action closely around this point for further cues.
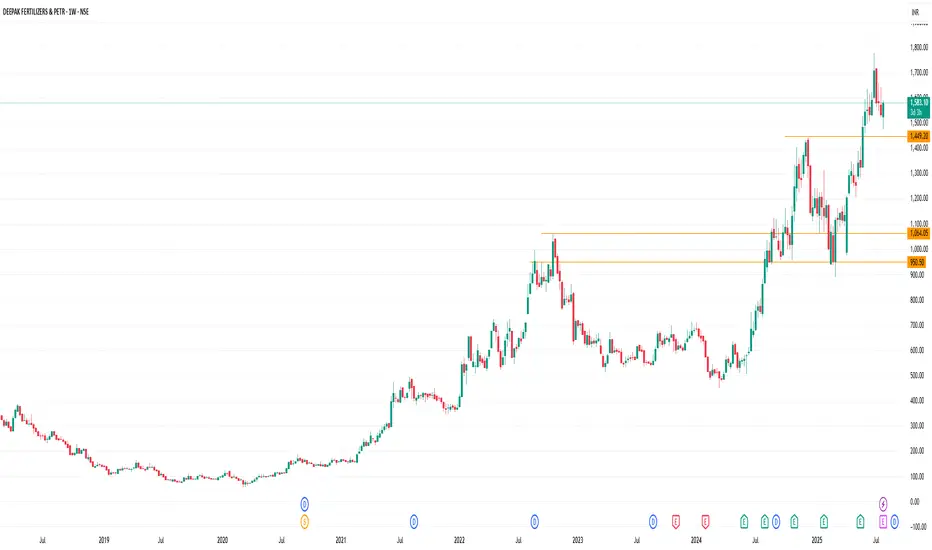
Deepak Fertilizers - Cup and Handle ContinuationAs you all can see there is a beautiful cup followed by a handle on the Weekly timeframe.
After the pattern broke out, the stock managed the market sell off pretty well by retesting its previous supply zone (now demand zone) and maintained the sideways trend without spoiling the pattern.
This sudden surge implies that the stock is ready to continue its uptrend.
Talking about fundamentals:
- High Management Efficiency with a high ROCE of 17.10%
- The company has a high Debt to EBITDA ratio of 1.88 times
- Healthy long term growth as Operating profit has grown by an annual rate 40.09%
- Positive results in Dec 24
- OPERATING PROFIT TO INTEREST(Q) Highest at 4.94 times
- NET SALES(HY) At Rs 5,325.74 cr has Grown at 24.53 %
- DEBT-EQUITY RATIO(HY) Lowest at 0.67 times
- With ROCE of 14.4, it has a Fair valuation with a 1.9 Enterprise value to Capital Employed
- The stock is trading at a discount compared to its average historical valuations
- Over the past year, while the stock has generated a return of 106.57%, its profits have risen by 0.5%
- High Institutional Holdings at 20.38%. Their stake has increased by 0.7% over the previous quarter.

Has Deepak Fertilizers maxed out.Deepak Fertilizers looks to have maxed out unless there is big news. Trading at high PE compared to the earnings.
Deepak Fertilizers : From commodity to steady state businessThe last commodity cycle played well for Deepak fertilizer with rise in prices of TAN, but post russian war the dumping took away the margin. But the fertilizer segment has popped up at a correct time of reckoning with croptek business scaling new highs.
The setup of chart is another thing i like and with volume missing goes under radar for most. Interesting 2 quarters it could be for the company.
Deepak Fer: Resistance breakout- All time HighDeepakFert :
Resistance breakout in progress and currently need to sustain 1400 levels for all time new highs

DEEPAKFERT | Cup and Handle Breakout |Retest | DailyHere's the **technical analysis** for **Deepak Fertilisers (DEEPAKFERT)**
---
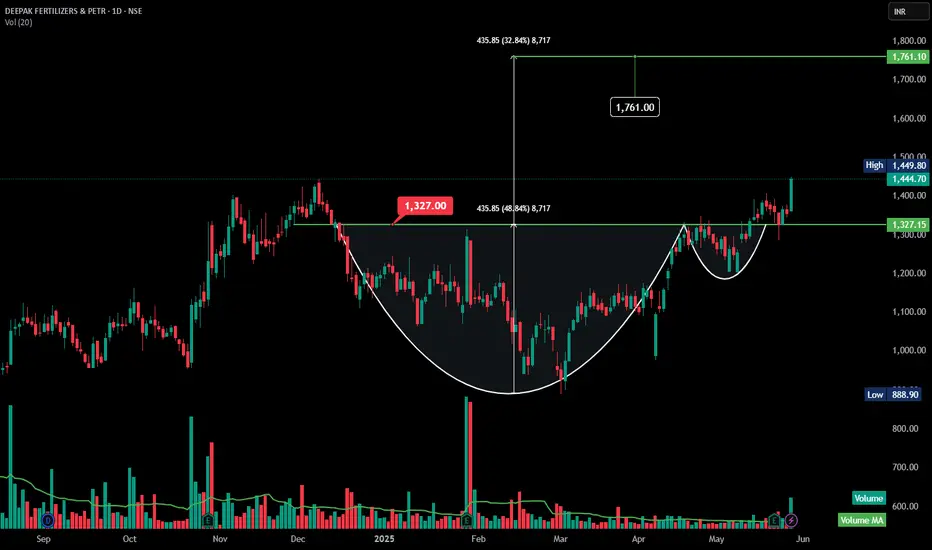
### 📝 **Technical Analysis – Deepak Fertilisers (Daily Timeframe)**
**Date:** May 28, 2025
**Pattern Identified:** ✅ *Cup and Handle Breakout*
---
### 1. **Chart Pattern Overview**
* A textbook **Cup and Handle** formation is complete.
* Price has **broken out** above the neckline resistance of **₹1327**, with strong bullish momentum.
* This breakout signals the potential beginning of a **fresh uptrend**.
---
### 2. **Volume Confirmation**
* **Breakout candle is supported by high volume**, indicating genuine buying interest.
* Volume has surpassed the 20-day moving average — a critical confirmation for pattern reliability.
---
### 3. **Price Action Summary**
* Price action shows a prolonged base, forming the cup.
* The handle showed minor consolidation before the breakout.
* Breakout level: ₹1327
* Current price: ₹1444.70
* Immediate resistance broken cleanly with a wide bullish candle.
---
### 4. **Target Calculation**
* **Cup depth**: ₹435.85
* **Target Price** = ₹1327 + ₹435.85 = **₹1761.00**
➤ This gives a **potential upside** of **\~22%** from current levels.
---
### 5. **Support & Risk Management**
* **Key Support Zone**: ₹1327 (former resistance turned support)
* **Aggressive SL**: ₹1370
* **Conservative SL**: ₹1325 (breakout base)
---
### 6. **Trend & Sentiment**
* With this breakout, sentiment has flipped **strongly bullish**.
* Follow-through price action and continued volume spikes will further validate the move.
---
### ✅ **Conclusion**
* **Pattern**: Cup and Handle
* **Breakout Level**: ₹1327
* **CMP**: ₹1444.70
* **Target**: ₹1761
* **Stop-loss**: ₹1370–1325
* **Bias**: Bullish
* **Strategy**: Buy on dip / Hold for target with trailing SL
---
Would you like a **voiceover script** for this chart as well, or shall I combine this with the previous stocks for a full video/audio narration?
ATH Breakout In Deepak FertilizerDeepak fertilizer closed @ 1444.70 and made new ATH.Also we can see confirmation of Bullish saucer pattern breakout on daily chart.Stock is in excellent momentum on Daily/weekly and monthy chart.Also Breakout of Achored Volume profile on yearly basis.So most probably the breakout will sustain with continuation of bullish momentum.As per fibbonacci extention we can expect immidiate target of 1500/1670/1880 and final target of 2000 in coming weeks or in next 3 months.We can keep SL of 1327 approximately 8% with Final Target of 2000 with R:R of 1:5.As monsoon is already started,Fertilizer stock are ready to perform.

DEEPAK FERTILIZER @1370 LOOKING GOOD FOR 10-20% MOVE1. Results on 22nd may and expecting good Q4 results
2. Stock moving near ATH with good amount of volumes
3. Good price action observed
4. Keep under radar for 10-20% upmove after results

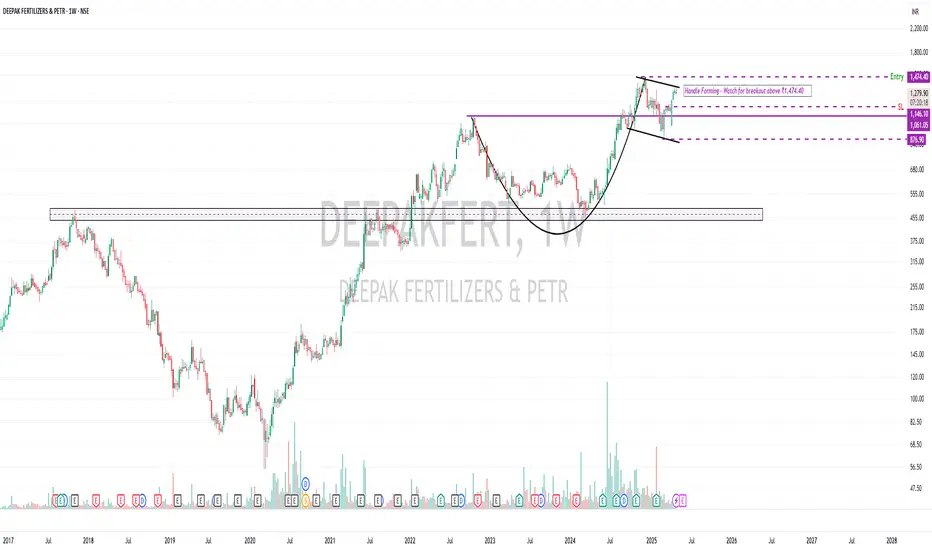
DEEPAKFERT – Classic Cup & Handle Setting Up on the Weekly Chart📈 DEEPAKFERT – Classic Cup & Handle Setting Up on the Weekly Chart
A potential Cup and Handle pattern is forming on the weekly timeframe.
The stock is currently consolidating in the handle zone. A breakout above ₹1,474.5 with a clean candle and strong volume could trigger a positional move.
🔍 Technical Overview
✅ Structure: Weekly Cup & Handle formation in progress
✅ Currently consolidating within the handle
✅ Trading above key DMAs
✅ Volume is still dry – wait for a volume spike to confirm the breakout
✅ Sector showing strength – tailwind in favour
🎯 Levels to Watch
📌 Entry Above ₹1,474.50 (Breakout Confirmation)
🛡️ Stop Loss ₹1,146.10 (22.3%)
🎯 Positional Target To be updated post-breakout (1:2 R:R base)
⚖️ Strategy & Risk Management
SL is deep due to volatile broader market — shakeouts are common
Risk management & position sizing is crucial here
Consider gradual accumulation rather than full entry at once
Trade as per your style — high reward setups also come with structure-based risks
🧠 Final Note:
This is a positional setup, not a short-term sprint.
Let the pattern mature and watch for a decisive breakout with strong volume confirmation.
📉 Disclaimer:
This is not a buy/sell recommendation. For educational purposes only. Do your own research and manage your capital wisely.
Amazing breakout on WEEKLY Timeframe - DEEPAKFERTCheckout an amazing breakout happened in the stock in Weekly timeframe, macroscopically seen in Daily timeframe. Having a great favor that the stock might be bullish expecting a staggering returns of minimum 25% TGT. IMPORTANT BREAKOUT LEVELS ARE ALWAYS RESPECTED!
NOTE for learners: Place the breakout levels as per the chart shared and track it yourself to get amazed!!
#No complicated chart patterns
#No big big indicators
#No Excel sheet or number magics
TRADE IDEA: WAIT FOR THE STOCK TO BREAKOUT IN WEEKLY TIMEFRAME ABOVE THIS LEVEL.
Checkout an amazing breakout happened in the stock in Weekly timeframe.
Breakouts happening in longer timeframe is way more powerful than the breakouts seen in Daily timeframe. You can blindly invest once the weekly candle closes above the breakout line and stay invested forever. Also these stocks breakouts are lifelong predictions, it means technically these breakouts happen giving more returns in the longer runs. Hence, even when the scrip makes a loss of 10% / 20% / 30% / 50%, the stock will regain and turn around. Once they again enter the same breakout level, they will flyyyyyyyyyyyy like a ROCKET if held in the portfolio in the longer run.
Time makes money, GREEDY & EGO will not make money.
Also, magically these breakouts tend to prove that the companies turn around and fundamentally becoming strong. Also the magic happens when more diversification is done in various sectors under various scripts with equal money invested in each N500 scripts.
The real deal is when to purchase and where to purchase the stock. That is where Breakout study comes into play.
LET'S PUMP IN SOME MONEY AND REVOLUTIONIZE THE NATION'S ECONOMY!

A good consolidation and breakout #DeepakfertiliserNSE:DEEPAKFERT
A good consolidation and breakout....
A logical thing is all fertilizer sector is bullish reason is monsoon is expected in normal time and this will boost the corps and a good rise in fertilizer sectors.

Deepak Fert. making a move to the bullish sideStock: Deepak Fert.
Bonus: Govt enabling sector by proving subsidy
sector: Cyclic
Weekly time frame in a strong demand zone showing good strength on charts
Daily time frame retest of demand level can help push price higher
Keep MAX SL as 10%
TP about 20-25%
Looks like a logical trade idea.

Deepak Fertilizers & Petrochemicals Corp Ltd (BREAKOUT STOCK)Incorporated in 1979, Deepak Fertilisers and Petrochemicals Corporation Ltd is in the business of fertlisers, agri services, bulk chemicals, mining chemicals and real estate.
Only manufacturer of Prilled and Medical-grade Ammonium Nitrate in India. Leading manufacturer and marketer of IPA in India.
SOMETHING IS COOKING BIG IN FERTILIZERS COMPANY.
Trend: The overall trend seems to be bearish in the short term after the recent decline, but the long-term trend remains upward based on the yearly context.Based on the chart's current momentum and the possibility of further upside, a BUYING or bullish strategy might be considered.
Disclaimer: This is my personal view, sharing on for educational Purposes. Consider it as a Paper Trade.

DEEPAKFERT Showing Strength From Base With Good Q3NSE:DEEPAKFERT showed strength today bouncing from a good base on the back of good Q3 Results, with RSI and MACD Showing Strength.
Q3 consolidated net profit jumped more than four times Y/Y, while revenue from operations climbed 39% Y/Y. Management says revenue from its crop protection business rose 55% due to good monsoon. Its profit margin also expanded to 10% from 3% a year ago. REVENUE FROM OPERATIONS 25.79 BILLION RUPEES, NET PROFIT 2.51 BILLION RUPEES.
Trade Setup:
It can be a Good 1:2 RISK-REWARD Trade with the recent being base being crucial.
Target(Take Profit):
52wh Levels for Swing Trader and 1522 for Positional Trader.
Stop-Loss:
Entry Candle Low For Swing Trader and a Recent Base of 1071 for Positional Trader.
📌Thank you for exploring my idea! I hope you found it valuable.
🙏FLLOW for more
👍BOOST if useful
✍️COMMENT Below your views.
Meanwhile, check out my other stock ideas below until this trade is activated. I would love your feedback.
Disclaimer: This analysis is intended solely for informational and educational purposes and should not be interpreted as financial advice. It is advisable to consult a qualified financial advisor or conduct thorough research before making investment decisions.

Falling Trendline and Neckline Breakout seen in fertiliser stockHello everyone i have brought a stock which has given breakout of falling trendline pattern and later on it has given breakout of neckline with huge volume spike.
Stock name is Deepak Fertilisers and Petrochemicals Corporation Ltd. It is Incorporated in 1979, this is in the business of fertilizers, agri services, bulk chemicals, mining chemicals and real estate.
Technically stock is looking very positive on chart, it has given breakout of triangle pattern with volume.
Price is above 200-DEMA.
Stock is giving bullish crossover on macd indicator.
After falling trendline breakout, stock has given breakout of it's neckline in today's session.
Everything suggesting a uptrend in coming few days to month.
So if anybody wants to accumulate at this levels can do and add more if you get some lower levels on chart around 650.
Market Cap
₹ 9,381 Cr.
Current Price
₹ 743
High / Low
₹ 759 / 450
Stock P/E
21.2
Book Value
₹ 428
Dividend Yield
1.13 %
ROCE
11.6 %
ROE
8.45 %
Face Value
₹ 10.0
Industry PE
41.1
Debt
₹ 4,149 Cr.
EPS
₹ 35.0
Promoter holding
45.6 %
Intrinsic Value
₹ 1,014
Pledged percentage
0.00 %
EVEBITDA
9.34
Change in Prom Hold
0.17 %
Profit Var 5Yrs
50.4 %
Sales growth 5Years
5.17 %
Return over 5years
45.5 %
Debt to equity
0.77
Net profit
₹ 457 Cr.
ROE 5Yr
15.6 %
Profit growth
-62.7 %
Earnings yield
8.39 %
Disclaimer:- Please always do your own analysis or consult with your financial advisor before taking any kind of trades.
Dear traders, If you like my work then do not forget to hit like and follow me, and guy's let me know what do you think about this idea in comment box, i would be love to reply all of you guy's.
Thankyou.

Deepak Fertilizer - short term bullish biasStock trading above all important moving averages on Monthly, Weekly and Daily Timeframe
Small Cup and Handle formation
All time high breakout
Stock showing strength compared to Nifty based on Comparative RS indicator
RSI, MCAD and ADX all bullish on all Timeframe
Buy @ CMP 1424 Stop Loss Swing low 1342
Trail profit based on 20 SMA OR Supertrend 10,3


Deepak Fertilizer getting ready for a run upNSE:DEEPAKFERT
Started tracking it since it last broke 52-week high on Nov 6. It gave a good closing but because of the overall market correction couldn't get the follow up move.
Next attempt to break was made on Nov 12th. However, the traders past stuck on the high took it as exiting opportunity at breakeven.
Since then it has been going on like that. So as a result all weak hands are out.
Now as the range tightening and liquidity contracting, the setup is almost set to make it further move either side.
As you guys know I approach every trade as 'Risk-First'. Rather than hoping how much profit I can make, I first see how much I can lose in a setup.
So my risk is here just ~0.9% which is suitable for my trading style.
Expecting a blast in a day or two as market gets out of its indecisive mood.
Keep observing. Keep improving.
Bcz, in trading:
#Learning is the ultimate Earning 🎯📚

Stage AnalysisStage Analysis with expected triggers in a stock which is part of a reviving sector and strong stock in weak market conditions. i am a beginner and still learning.
