Falling Wedge BO Done, Still StrongNSE:DEEPAKFERT Falling Wedge BO Done, Still Strong, Swing Traders Can Book.
DEEPAKFERT trade ideas

Falling Wedge Breakout With Good VolumesNSE:DEEPAKFERT today broke a Major Falling Wedge Pattern from a Crucial Previous Support Zone with a Good Amount of Volumes.
Trade Plan:
Entry: If it closes above Swing High or Retest the Support.
Stop Loss: Entry Candle Low.
No Trade: if goes Below 942 (Support Levels)
🙋♀️🙋♂️If you have any questions about this stock, feel free to reach out to me.
📍📌Thank you for exploring my idea! I hope you found it valuable.
🙏FLLOW for more
👍BOOST if useful
✍️COMMENT Below your views.
Meanwhile, Check out my other stock ideas below until this trade gets activated. I would love your feedback.
Disclaimer: This analysis is intended solely for informational and educational purposes and should not be interpreted as financial advice. It is advisable to consult a qualified financial advisor or conduct thorough research before making investment decisions.

DEEPAKFERT "DIWALI PICK 2024simple ORB strategy....i will BUY near EOD or if the price trade BELOW the blue line..after entry will wait for target or (SL) Will be black line close candle in D' chart i will come out .....CHECK THE TARGETS IN THE CHART
its just my view educaltional purpose only

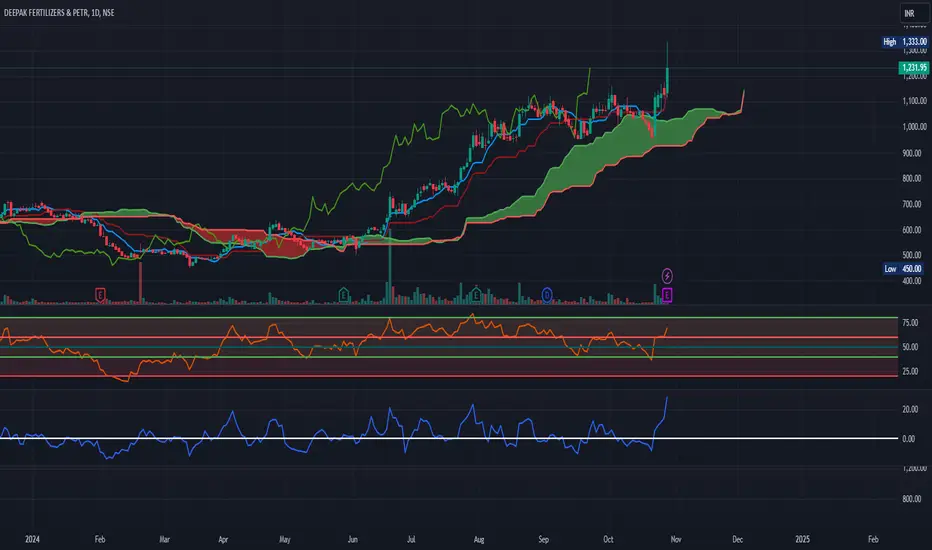
DEEPAKFERT - Ichimoku Breakout📈 Stock Name - Deepak Fertilizers And Petrochemicals Corporation Limited
🌐 Ichimoku Cloud Setup:
1️⃣ Today's close is above the Conversion Line.
2️⃣ Future Kumo is Turning Bullish.
3️⃣ Chikou span is slanting upwards.
All these parameters are shouting BULLISH at the Current Market Price and even more bullishness anticipated AFTER crossing 1232.
🚨Disclaimer: This is not a Buy or Sell recommendation. It's for educational purposes and a guiding light to learn trading in the market.
#CloudTrading
#IchimokuCloud
#IchimokuFollowers
#Ichimokuexpert
Excited about this analysis? Share your thoughts in the comments below!
👍 Like, Share, and Subscribe for daily market insights! 🚀
#StockAnalysis #MarketWatch #TradingEducation #ichimoku #midcap #smallcap #largecap #DEEPAKFERT
Turning Bullish:Deepak Fertilizers has given a strong breakout with good volume on the weekly chart.
The stock has bullish momentum above short, medium, and long-term moving averages.
Support levels are 1067, 1003, 960, 903
It has strong resistance at 1178 levels.
It needs good volume support and price momentum for the current level to be broken.
Long term target: 1295

VIEW ON DEEPAKFERTGood chart structure
After market's fall in previous week stock has handled itself
Target 1210/1260
Stop loss 1165
I am just representing my views
For educational purpose only.

Deepak Fertilizers cmp 1118.75 by Weekly Chart views*Deepak Fertilizers cmp 1118.75 by Weekly Chart views*
- Support Zone 940 to 955 Price Band
- Resistance Zone at 1115 to 1135 Price Band
- Volumes are needed for fresh upside for a New Lifetime High
- Weekly basis Support at 1005 > 885 > 780 with Resistance only at ATH 1163.85
- *Close to 2 year's long Bullish Rounding Bottom followed by a Price Breakout well above earlier Resistance Zone now acting as the Support Zone*

deepak fertilisers breake out .entry activateddeepak fertilizers for a short swing ...3hr candle closed decisively above 1125 .next first target 1250 second target 1300.we can trial the SL once achieve the first target.now is at 1147 entry is activated with a strict stoploss of 1060. volume is respectable even todays lower nifty level.its a consolidation breake out

DEEPAKFERT MONTHLY | LONG TERM INVESTMENTHi Traders,
This is DEEPAKFERT Chart.
This is Best Time to Invest for Long Term
with Small SL which is less than 100 Rs.
Note - This is only for education Purpose

#DEEPAKFERT Ready for Another Bull Run !🚀 Stock Alert: #DEEPAKFERT Ready for Another Bull Run! 🚀
📈 Momentum Building: In the recent session, we've seen a huge volume build-up, and #DEEPAKFERT is making a strong rebound after taking support at the 50-day moving average. The momentum suggests it's set for another bullish run, making it a strong candidate for a swing trade. With the recent massive bull run in chemical stocks, this one is worth watching! 🔥
💡 Keep #DEEPAKFERT on your radar for potential breakout opportunities! 👀
Target: 1190-1200
Stop Loss: 980
Trade Risk Free Exit (20-30%): 1115
📢 Disclaimer: This post is for educational purposes only. Always do your own research before making any investment decisions. 💼
#StockMarket #Trading #InvestSmart

DEEPAKFERTILIZERS ROUNDING BOTTOM BREAKOUTDeepakfertilizers breaking rounding bottom
on weekly basis with good volume
#target 1600 sl 950
EDUCATIONAL IDEA

Deepak Fertilizer- All time high breakoutDeepak Fertiliser has given a breakout of all time high and is looking strong for 2000-2200 levels.

Deepak fertilizers & petrochemical Corp LtdIt is involve in chemicals, mining chemicals & fertilizers business.
Market Cap: 8474 crores
P/E 12.6 vs Industry P/E 33.2
ROCE is 25%
Previously ,it demonstrated a perfect example of Cup pattern breakout that achieved its target.
Currently it is on verge of giving breakout in a symmetrical triangle. weekly closing above 680 and RSI weekly closing above 60 should be consider as confirmation of breakout .If it does closes then it should head for 720 and 834. It has the potential to cross it ATH of 1065 in 2024.
The View should be neglected if it breakdown in symmetrical triangle.
This is not a stock Recommendation.


DEEPAK FARTLIZERMonsoon rain is expected to be 110% forecast by Metrological department.
Expecting subsidy from budget.
Technical chart shows bottom is formed and moving upward.
EMA Cluster moving upward indicating uptrend
Add quantities in small chunks and build pyramid.
Target 2x and above
THIS IS MY ASSESMENT
ONLY FOR EDUCATIONAL PURPOSE.

Deepak fertilizers-A stock that should be on everyone's radar ## Deepak Fertilizers & Petrochemicals: A Potential Player in a Booming Market
Deepak Fertilizers & Petrochemicals Corporation Ltd. (Deepak) is a noteworthy participant in the currently flourishing fertilizer and chemicals sectors. With both industries experiencing strong market momentum, Deepak presents itself as a company with significant growth potential.
**Analyst Viewpoint:**
Based on current trends, Deepak appears well-positioned for scaling its operations. If the stock's closing price for the week remains above ₹745, there's a possibility of it reaching ₹857.55. Given these factors, it's advisable to keep Deepak on your investment radar.
**Important Disclaimer:**
I hold a long-term investment in Deepak. This communication is for informational purposes only and should not be construed as a recommendation to buy or sell the stock. Please conduct your own thorough research before making any investment decisions.

Deepak Fertilizer Long12 May 2024
---------------
Deepak Fertilizer
Buy Above 556.65
SL 501.05
Target 583-620-657-694-805
Hold few months
Please consult your financial advisor before investing
All research for educational purposes only.

stock is in sideways rangeMy view is this, the stock is in the range of 526-728, sideways, and the stock is in the range of 700-730, which has strong chances of sustaining the breakout.

Long DeepakFlush Reversal setup
expected growth in coming quaters
volume increase
good daily setup
3-9 months view
cmp 602
sl 495
target 1200

DEEPAKFERT bullish; above 578.5 ? - Friday 31-May.The above information does not constitute investment/trading recommendation and it is purely for educational purpose....
INTRADAY Trading Strategy in 3 stages of breakouts:
1) Impulse upmove stage: The strong upmove (nearly upto 1.5% from trigger-price) happens within five minutes. "High Risk Traders" buy on breakouts in hope of continuation of upmove. "High Risk Traders" may have to patiently wait through the Pullback-Consolidation stage to realize profits. High risk:High reward set up as breakouts may fakeout (reversal)also
2) Pullback-Consolidation stage: After the above "Impulse upmove stage"; the price may then pull back and move sideways (between "Open" price and "High" of the above "Impulse upmove stage"). "Safe traders" with minimum risk profile wait for a breakout from the consolidation stage to enter into trade , to book high profits in the final "Breakout continuation" stage
3) Breakout continuation: Stocks often in the third stage breaks up above the "High" of the first "Impulse upmove stage" and continue to go higher again.
Both Safe Traders/High Risk Traders book profits at this stage
SWING Trading Strategy:
Position is created, only upon stock closing above the entry price on day closing basis and is held on for 5-10 trading sessions for larger gains (5-10%)
The above information do not constitute, financial, investment, trading, or other types of advice or recommendation.It is purely for educational purpose....

Deepak FertilizersHello & welcome to this analysis
Stock has been in a 2 years decline and is now v close to a crucial support at 515 if breached then further downside could continue in the short term.
Resistance at 625 and 750
Overall a wait and watch scenario for the stock
Happy Investing

DEEPAKFERT - Weekly AnalysisIn the Weekly Chart of DEEPAKFERT,
we can see that, after retesting of 480-500 levels which was acting as strong support.
It has shown a very strong up move from that levels.
Expected momentum is shown in chart.
