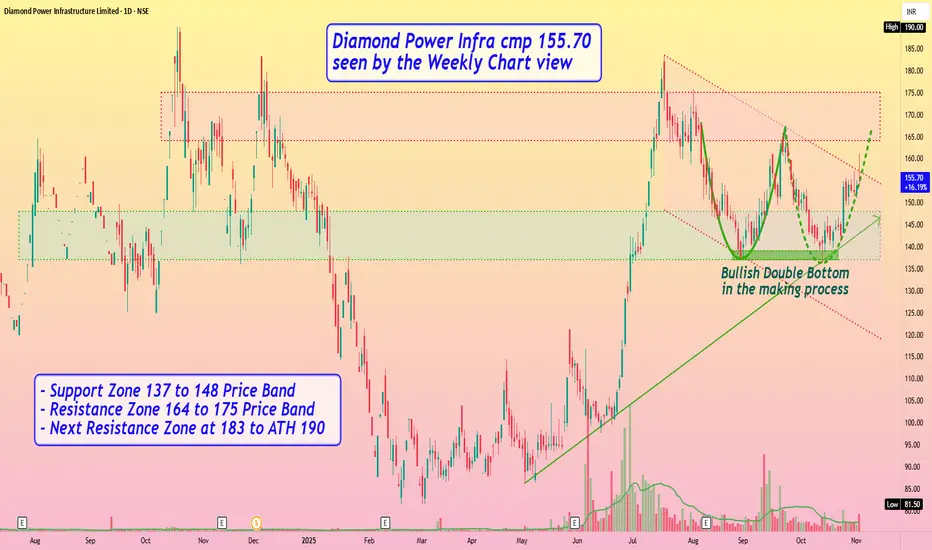
Diamond Power Infra cmp 155.70 seen by the Weekly Chart viewDiamond Power Infra cmp 155.70 seen by the Weekly Chart view
- Support Zone 137 to 148 Price Band
- Resistance Zone 164 to 175 Price Band
- Next Resistance Zone at 183 to ATH 190
- Bullish Double Bottom in the making process
- Rising Support Trendline seems well respected
- Volumes spiking regularly by close sync with avg traded qty
- Falling Price Channel Breakout seems to be in the making process
Trade ideas
DIACABS - Mutliple confirmation set upDiamond Power Infrastructure Limited (DIACABS) is trading near ₹154 in early November 2025. The stock shows mixed signals with a short-term sell signal but a longer-term buy signal, indicating some near-term caution within a general positive trend. Resistance is expected around ₹169.6, and support near ₹127.9. Technical indicators point to bullish momentum as the price is above 25-day and 50-day moving averages, although short-term volatility has caused some pullbacks.
Financially, DIACABS has a market cap of about ₹7,628 crore and recently showed impressive quarterly revenue growth of over 200%, though profit margins remain modest near 5.7%. The debt level is significant (₹2,355 crore) compared to its cash reserves, which raises risk concerns for risk-averse investors. The stock has delivered extraordinary long-term returns (+879% over five years), but recent performance has been volatile with notable quarterly earnings growth fluctuations.
Overall, DIACABS is a high-potential but higher-risk mid-cap stock showing bullish technical signals for short to medium-term trading, with resistance near ₹170 and downside risk if it falls below ₹128.

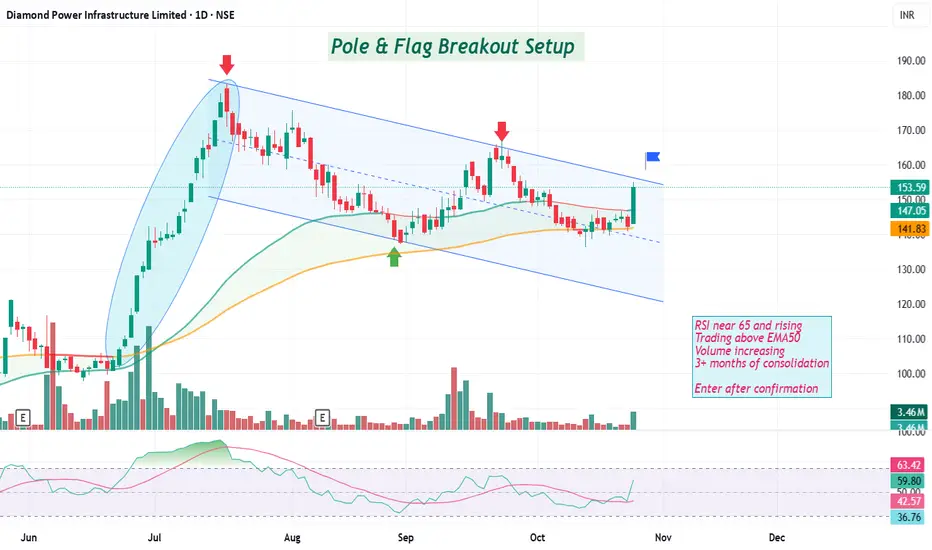
Breakout Soon in Diamond Power InfraPole & Flag Breakout Setup
RSI near 65 and rising
Trading above EMA50
Volume increasing
3+ months of consolidation
Enter after confirmation
Disc: for study, not a recommendation. DYOR
DIACABS Looks Good for LongDIACABS Looks Good for Long
Trading Above Pivot Has Breakout of Resistance 1 in Day Candle 9EMA and 15EMA has Crossover can Create ALL Time High.
CMP 1582 Buy Around 1550-1585 Sl 1437 Target 1695++ Safe Trader can Book Profit at 1695 Or
Trail Profit as Per the 9EMA.
