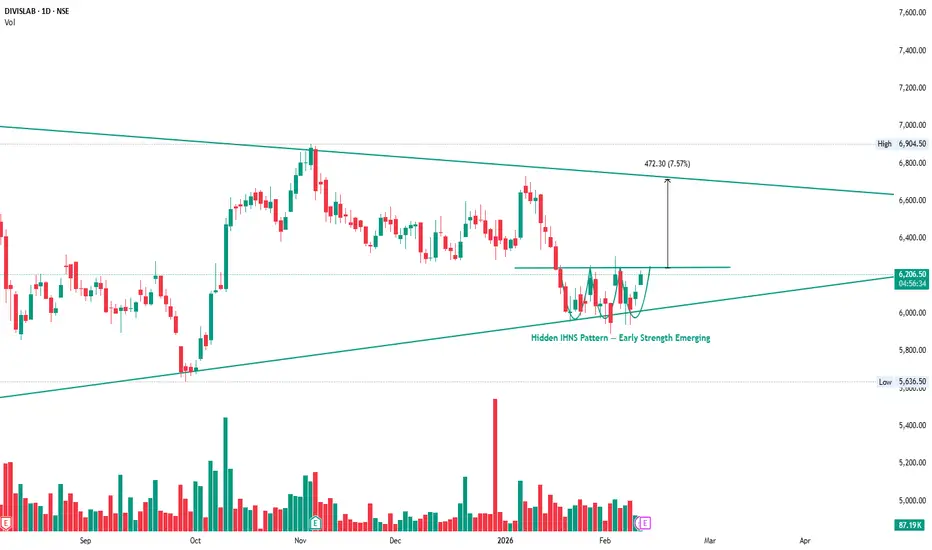
DIVISLAB : This Is Why Pattern Reading MattersThis is a hidden Inverse Head & Shoulders (IHNS) pattern forming near structure.
Price has already respected the neckline and higher lows are visible.
Such patterns usually appear before the crowd notices.
This is an early sign of strength, not a breakout chase.
Read the chart carefully — structure is speaking before price expands.
Divi's Laboratories Limited
No trades
What traders are saying
Bearish Hammer – EMA Confirmation Setup🧭 Overview
The Bearish Hammer pattern appears near the top of an upward move and signals potential buyer exhaustion. When combined with EMA High–Low band alignment, it provides a structured approach to identify early downside pressure.
⸻⸻⸻⸻⸻⸻⸻⸻⸻⸻⸻⸻⸻⸻
📘 Concept
A Bearish Hammer forms after an advance, where price attempts to move higher but faces strong rejection. The long upper wick reflects selling pressure entering the market.
To increase reliability, this setup is combined with the EMA High–Low band:
• The hammer should form above the EMA band.
• The EMA band should not touch the hammer body.
This alignment strengthens bearish bias within the broader structure.
⸻⸻⸻⸻⸻⸻⸻⸻⸻⸻⸻⸻⸻⸻
📊 Chart Explanation
1️⃣ A Bearish Hammer forms near the top of the move, indicating buyer exhaustion.
2️⃣ The candle appears above the EMA High–Low band, supporting bearish alignment.
3️⃣ The hammer’s low acts as the validation line for downside confirmation.
4️⃣ A close below the validation line confirms weakness.
5️⃣ A break above the hammer high acts as the devalidation level and cancels the setup.
⸻⸻⸻⸻⸻⸻⸻⸻⸻⸻⸻⸻⸻⸻
📝 Summary
Bearish Hammer near highs signals early selling pressure.
EMA band alignment improves structure clarity.
Close below the hammer low confirms the setup.
Break above hammer high invalidates the pattern.
⸻⸻⸻⸻⸻⸻⸻⸻⸻⸻⸻⸻⸻⸻
⚠️ Disclaimer
📘 For educational purposes only.
🙅 Not SEBI registered.
❌ Not a buy/sell recommendation.
🧠 Purely a learning resource.
📊 Not Financial Advice.

DIVISLAB 1 Week Time Frame 📌 Current Price Snapshot (latest)
Latest traded price around ₹6,056 – ₹6,056.50 (NSE) in early Feb 2026.
📈 Weekly Support & Resistance Levels (1-Week Time Frame)
📊 Key Levels for This Week (approx based on technical forecasting):
Level Type Price Level (₹)
Strong Resistance 3 (R3) ~6,496.8
Resistance 2 (R2) ~6,377.2
Resistance 1 (R1) ~6,194.3
Current Box Top Level (upper range) ~6,496
Support 1 (S1) ~5,891.8
Support 2 (S2) ~5,772.2
Strong Support 3 (S3) ~5,589.3
➡️ This implies the expected weekly trading range is roughly ₹5,590 – ₹6,495 if the stock remains within normal price swings this week.
🔍 Short-Term Technical Context
Price currently below many key moving averages (5, 10, 20 SMA etc.) indicating bearish bias in short term.
Momentum indicators like RSI and MACD show neutral to bearish positioning, suggesting limited upside unless buyers step in strongly.
📌 How To Use These Levels
Bullish trigger levels:
✔ Above ~₹6,194 (R1) — short-term upside bias
✔ Above ~₹6,377 (R2) — stronger bullish sentiment this week
Bearish trigger levels:
🔻 Below ~₹5,891 (S1) — indicates selling pressure
🔻 Below ~₹5,772 (S2) — more downside risk
📌 Summary Weekly View
Expected trading range this week: ₹5,590 – ₹6,495
Near-term resistance: ~₹6,194 → ~₹6,377
Near-term support: ~₹5,891 → ~₹5,772 (secondary)
📍 All levels are based on technical forecasts and pivots — not guaranteed — and actual price action may vary with market conditions.

Ascending Triangle vs Head & Shoulders — A Battle of StructuresThis chart is not about a single pattern — it’s about overlapping structures, which is why this zone matters.
On one hand, price has formed a Head & Shoulders pattern, signaling distribution near the top and warning that momentum has slowed after the prior up-move.
At the same time, the market is also forming an Ascending Triangle, with higher lows pressing against a common resistance, showing that buyers are still active and unwilling to give up ground easily.
This creates a high-importance decision zone:
• If price accepts above the resistance, the Head & Shoulders loses relevance and the ascending triangle resolves to the upside.
• If price breaks and holds below the rising trendline, the triangle fails and the Head & Shoulders structure activates, opening the door for deeper retracement.
This is not a prediction setup — it’s a reaction setup.
The market is compressing energy, and only price acceptance will decide which structure survives.
In such zones, patience and discipline matter more than anticipation.

DIVISLAB - Range-to-Breakout Attempt from Demand💹 Divi’s Laboratories Ltd (NSE: DIVISLAB)
Sector: Pharmaceuticals | CMP: 6642.5
View: Range-to-Breakout Attempt from Demand | Momentum Rebuild in Progress
Chart Pattern: Accumulation
Candlestick Pattern: Strong Bullish Marubozu | Bullish Engulfing
Price Action:
DIVISLAB has transitioned into a well-defined accumulation phase following a prolonged corrective decline. After forming a structural base near the 6200–6300 region, price action shows repeated demand absorption, indicating that selling pressure has been largely exhausted at lower levels. The recent session printed a decisive bullish expansion candle from within the range, signalling a shift in control back toward buyers. This move marks an early breakout attempt from consolidation, with price reclaiming the mid-range and pressing toward the descending supply line. While the broader structure is still evolving, the latest price behaviour reflects a clear change in character from compression to directional intent.
Technical Analysis (Chart Readings):
The chart reflects improving technical alignment following a prolonged consolidation. Price has delivered a strong bullish Marubozu / engulfing candle, highlighting decisive buyer dominance and minimal intraday supply. This expansion follows a visible Bollinger Band squeeze, pointing to a volatility release after compression. Short-term trend alignment is improving, with EMA 9–20 crossover visible and price stabilising above key short-term averages, while the broader trend remains in recovery mode. Momentum indicators support this transition, with RSI around 63 signalling strength without immediate exhaustion, MACD showing a positive crossover with expanding histogram, and ROC confirming positive rate-of-change momentum. Volume participation has expanded above recent averages, indicating that the move is supported by participation rather than a low-liquidity spike. Overall, the technical state suggests a momentum rebuild phase emerging from accumulation.
Key Levels (Chart Readings):
The chart highlights a clear demand–supply framework guiding near-term price behaviour. On the downside, a strong structural support zone is visible in the 6200–6000 region, which has acted as a base for accumulation and repeatedly absorbed selling pressure. Intermediate support levels around 6470, 6298, and 6203 further reinforce this demand structure. On the upside, overhead supply is visible near the 6700–7000 band, where prior price reactions indicate selling interest and distribution. Intermediate resistance levels around 6737, 6832, and 7004 mark zones where acceptance will be required for sustained upside continuation. The recent push from demand toward resistance reflects a range-to-expansion attempt, with price currently navigating a transition zone rather than an open trend environment.
Demand & Supply Zones (Chart Readings):
The chart outlines clearly defined demand and supply zones shaping short-term structure. On the Daily timeframe, a major demand zone is clearly established in the 6447-6345 region, where price previously(recently) formed a strong base followed by an impulsive upside move, highlighting long-term demand absorption and accumulation by higher-timeframe participants. This daily demand zone provides the broader structural floor for the current price action.
A swing demand zone is visible near the 6381–6345 region, which has acted as a base for higher-low formation and sustained buying interest. Within this, intraday demand zones around 6510–6481 highlight immediate support areas where buyers have been active during pullbacks. On the upside, supply zones remain clustered near the 7280–7330 region on higher timeframes, while nearer-term resistance is visible around the recent swing highs. Collectively, these zones frame the current environment, with price attempting to rotate upward from demand into overhead supply, making follow-through and acceptance key variables to monitor.
STWP Trade Analysis:
DIVISLAB has triggered a bullish expansion from an accumulation base, supported by improving momentum and expanding volume. From an intraday perspective, price holding above the 6660 zone keeps the bullish bias intact, with scope for continuation toward the upper resistance bands as long as demand remains defended. From a short-term swing standpoint, the same zone supports a broader mean-expansion framework over the next few sessions, provided price continues to build above reclaimed levels without slipping back into compression. The STWP view remains constructively bullish, with trend bias turning upward, RSI reflecting healthy strength, and volume behaviour confirming participation. Risk, however, remains elevated due to the proximity of overhead supply, making disciplined position sizing and structure-based risk management essential.
Final Outlook:
Momentum: Strong
Trend: Up
Risk: High
Volume: Moderate
The structure favours a continuation attempt as long as price sustains above demand zones, but confirmation through acceptance above resistance is required for trend acceleration. Traders should prioritise structure, risk control, and follow-through over prediction during this transition phase.
⚠️ STWP Educational & Legal Disclaimer
This content is shared strictly for educational and informational purposes only. All discussions, illustrations, charts, price zones, and options structures are meant to explain market behaviour and do not constitute any buy, sell, or hold recommendation. STWP does not provide investment advice, trading calls, tips, or personalized financial guidance, and is not a SEBI-registered intermediary or research analyst.
The analysis is based on publicly available market data and observed price–derivatives behaviour, which is dynamic in nature and may change without notice. Financial markets involve inherent risk, and derivatives carry elevated risk, including the potential for significant capital loss. Factors such as option premiums, implied volatility, open interest, delta, and other Greeks can shift rapidly and unpredictably.
All trading and investment decisions, including position sizing and risk management, are solely the responsibility of the reader. Always consult a SEBI-registered investment advisor before taking any financial action. STWP, its associates, or affiliates shall not be liable for any direct or indirect loss arising from the use of this material. Past patterns, structures, or historical behaviour must never be treated as guarantees of future outcomes.
Position Status: No active position in this instrument at the time of analysis
Data Source: TradingView & NSE India
💬 Did this add value?
🔼 Boost to support structured learning
✍️ Share your views or questions in the comments
🔁 Forward to traders who value disciplined analysis
👉 Follow for clean, probability-driven STWP insights
🚀 Stay Calm. Stay Clean. Trade With Patience.
Trade Smart | Learn Zones | Be Self-Reliant 📊

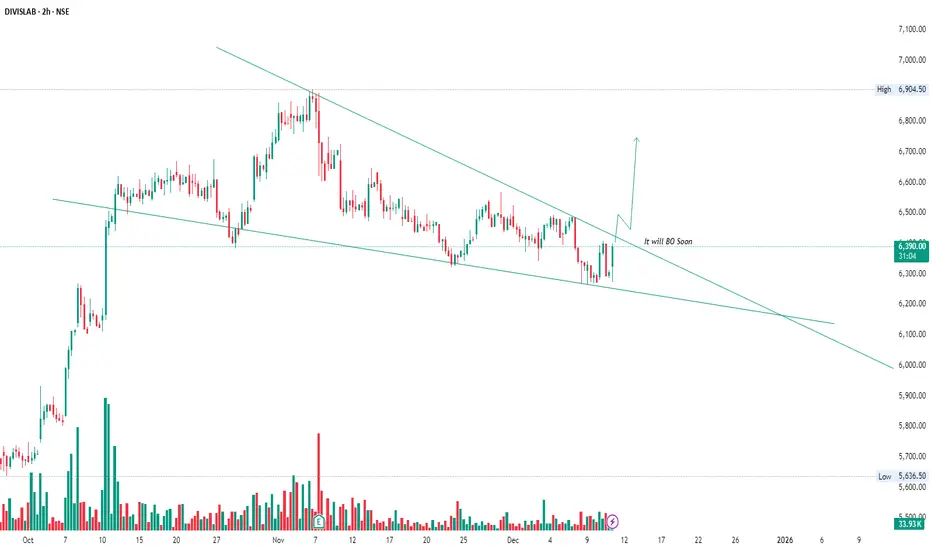
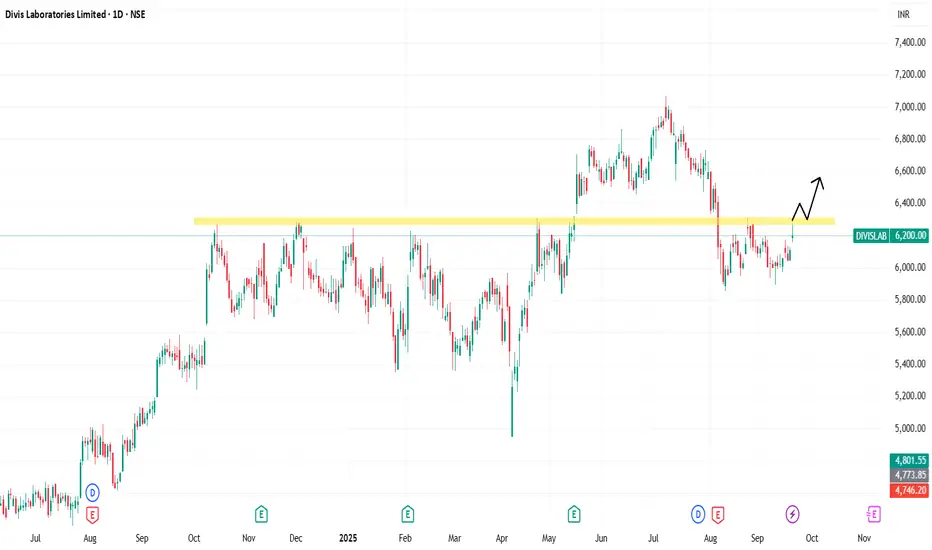
DIVISLAB – Tightening Inside a Falling Wedge | Breakout LoadingDIVISLAB is compressing beautifully inside a falling wedge, one of the strongest bullish reversal patterns.
Price has been making lower highs + higher lows, showing clear contraction. This usually means the stock is getting ready for a decisive move.
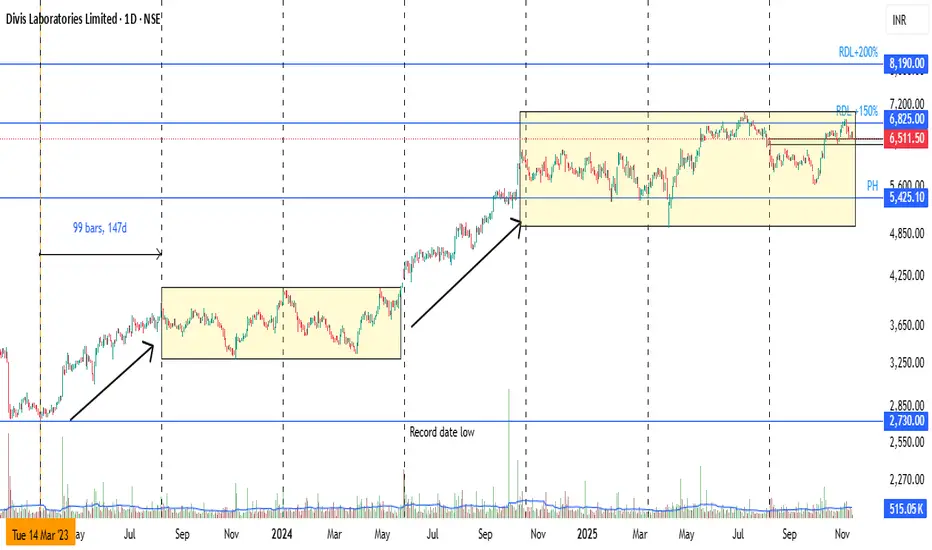
Divis Laboratories Ltd. (DIVISLAB)When you look at the Davis Lab chart, the most striking feature is that it has a large time cycle of 147 days. The normal Jupiter cycle of 12 (1+2=3)is root 144 (12X12) days. We found that 147 days is a very stable time cycle in Davis Lab.Of all the time cycle charts we have discussed or provided so far, Davis Lab has the longest time cycle, at 147 days.
At least two-three cycles in this have been run sideways, yet we saw that it has gone up almost 150 times from the record date low in the last 7 cycles.
We will discuss the celestial cycles in the future.We will also discuss the chart of the planet's cycle. For now, here is the chart from Davis Lab.
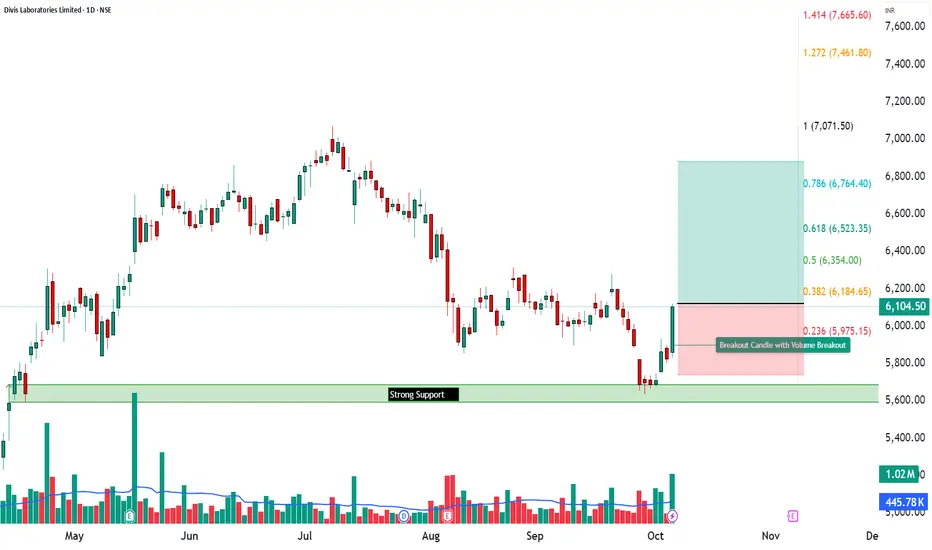
DIVISLAB - Bullish Momentum + RSI & MACD Breakout📈 Divis Laboratories Ltd | Bullish Momentum + RSI & MACD Breakout 🚀
🔹 Entry Zone: ₹6,100 – ₹6,120
🔹 Stop Loss: ₹5,739.80 (Risk ~₹380 pts)
🔹 Supports: 5,917.33 / 5,730.17 / 5,628.83
🔹 Resistances: 6,205.83 / 6,307.17 / 6,494.33
________________________________________
🔑 Key Highlights
✅ Strong Bullish Candle – powerful reversal from key support zone
✅ RSI Breakout – momentum confirmation after prolonged base
✅ MACD Crossover – positive trend shift visible
✅ Bullish SuperTrend + VWAP Alignment – institutional momentum confirmation
✅ BB Squeeze-Off → volatility expansion expected
________________________________________
🎯 STWP Trade View
📊 Momentum suggests a short-term bullish rally is in play.
A close above ₹6,200 may open further upside toward ₹6,307 – ₹6,494.
⚠️ Supports at ₹5,917 & ₹5,730 act as crucial protection zones.
Volume spike confirms fresh long build-up — a classic “Buy Today, Sell Tomorrow” setup.
________________________________________
💡 Learning Note
This setup beautifully showcases how combining RSI Breakout + MACD Crossover + VWAP alignment strengthens a momentum-based reversal.
When such signals converge near Fibonacci supports, they offer high-probability swing setups with strong follow-through potential.
________________________________________
⚠️ Disclosure & Disclaimer – Please Read Carefully
The information shared here is purely for learning and awareness purposes.
It is not a buy or sell recommendation and should not be treated as investment advice.
I am not a SEBI-registered investment adviser — all observations are based on personal chart study and publicly available data.
Trading involves risk — markets can move unexpectedly, and losses can exceed invested amounts.
Past setups or patterns do not guarantee future outcomes.
If you’re a beginner, treat this content as a learning reference and start with paper trades.
If you’re experienced, align setups with your own risk and position sizing strategy.
Always consult a SEBI-registered advisor before executing any trades.
By engaging with this content, you accept full responsibility for your actions.
________________________________________
💬 Found this useful?
🔼 Give this post a Boost to help more traders learn structured setups
💬 Drop your thoughts or chart views below — let’s grow together
🔁 Share with fellow traders who love clean, data-backed analysis
👉 “If you liked this breakdown, follow for more disciplined, structured setups.”
🚀 Stay Calm. Stay Clean. Trade With Patience.
Trade Smart | Learn Zones | Be Self-Reliant 📊
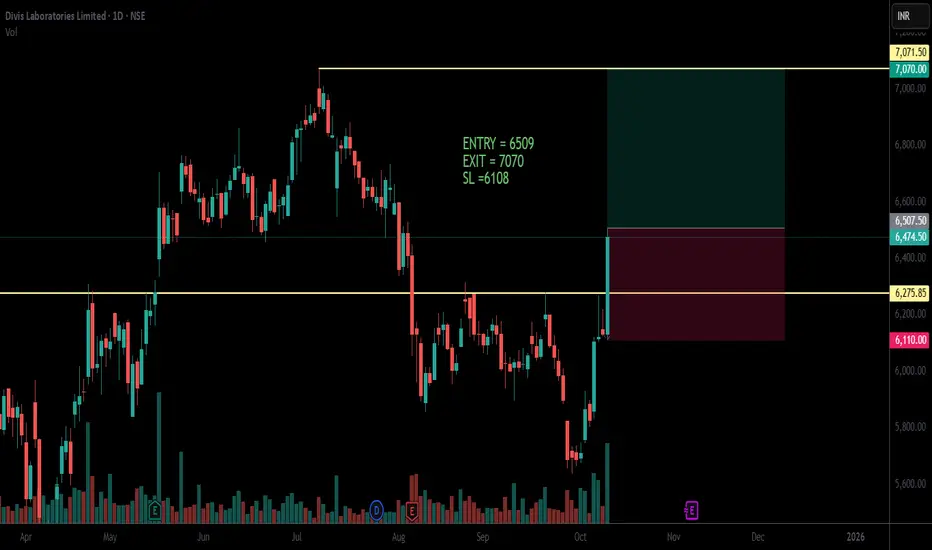
DIVISLAB SWING TRADE [DAILY]Divislab broke the resistance around 6276 with a clean and a long bullish candle. Buyers are having a party with this stock. Now, it might come to retest around 6276 and one can wait for that. Or else, my trade would be
DIVISLAB
ENTRY = 6509
EXIT = 7070
SL =6108
Disclaimer - This is for learning purposes only. It should not be considered as a financial advice.
DIVISLAB 1 Month Time Frame 📊 Key Financial Metrics
Current Share Price: ₹6,046.00
Market Capitalization: ₹1,60,780 Crore
Price-to-Earnings (P/E) Ratio (TTM): 69.65
Earnings Per Share (EPS): ₹86.81
Book Value per Share: ₹564
Dividend Yield: 0.51%
Return on Equity (ROE): 14.64%
Debt-to-Equity Ratio: 0.00 (virtually debt-free)
Beta (5Y Monthly): 0.17 (indicating low volatility)
Face Value: ₹2.00
📈 Recent Stock Performance (1-Month Overview)
Price Range: ₹5,692.50 (Oct 1) – ₹5,898.00 (Oct 6)
Average Price: Approximately ₹5,957.03
1-Month Change: Approximately -3.05%
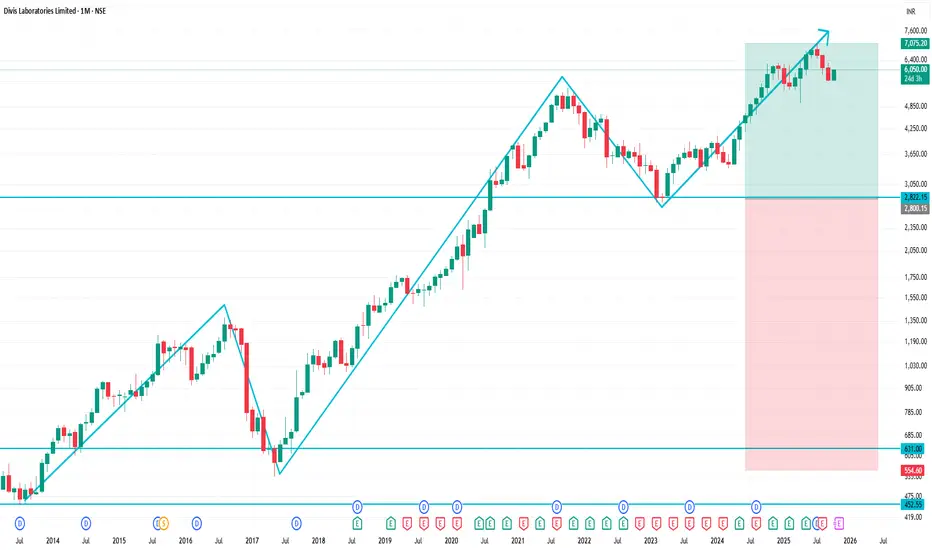
Divis Labs: Stellar FY25 Results Set Stage for Fresh BreakoutTechnical Analysis
Divis Laboratories has demonstrated exceptional technical progression with a super bullish rally spanning an incredible 2 decades, establishing itself as one of India's premier pharma success stories. The stock's consistent uptrend reflects the company's strong fundamentals and market leadership in the API segment.
From October 2024, the ₹6,250-6,300 zone emerged as formidable resistance, creating a critical supply area that tested multiple times. However, the game-changing catalyst arrived with the announcement of stellar FY25 results showcasing record revenue growth and impressive profitability metrics.
The positive FY25 performance and strong YoY growth provided the momentum needed to break above the stubborn ₹6,250-6,300 supply zone, with the stock rallying impressively to ₹7,071 - marking a significant 13% surge from resistance levels.
However, profit-booking and market volatility caused a correction back to ₹5,800 levels, and the stock is now trading at ₹6,200, finding itself once again at the critical supply zone. This same resistance area that was conquered earlier now acts as a key battleground for the next directional move.
Entry Strategy: Enter on confirmed breakout above ₹6,300 with strong volume, or accumulate on dips if ₹6,200 holds as support with bullish candlestick patterns.
Targets:
Target 1: ₹6,600
Target 2: ₹6,800
Target 3: ₹7,000
Stop Losses:
Critical Stop: ₹6,100 (below current support zone)
If this zone doesn't sustain and shows rejection, no more expectations on this stock.
FY25 Financial Highlights (vs FY24 & FY23)
Total Income: ₹9,360 Cr (↑ +19.3% YoY from ₹7,845 Cr; ↑ +20.5% vs ₹7,767 Cr in FY23)
Total Expenses: ₹6,387 Cr (↑ +13.3% YoY from ₹5,635 Cr; ↑ +18.3% vs ₹5,397 Cr in FY23)
Operating Profit: ₹2,973 Cr (↑ +34.5% YoY from ₹2,210 Cr; ↑ +25.4% vs ₹2,370 Cr in FY23)
Profit Before Tax: ₹2,916 Cr (↑ +34.8% YoY from ₹2,163 Cr; ↑ +23.1% vs ₹2,369 Cr in FY23)
Profit After Tax: ₹2,191 Cr (↑ +36.9% YoY from ₹1,600 Cr; ↑ +20.1% vs ₹1,824 Cr in FY23)
Diluted EPS: ₹82.53 (↑ +37.0% YoY from ₹60.27; ↑ +20.1% vs ₹68.71 in FY23)
Fundamental Highlights
Divis Laboratories delivered spectacular FY25 performance with PAT surging an exceptional 36.9% YoY to ₹2,191 crore, driven by robust demand for APIs and strong execution across all business segments. Revenue surged 19% to Rs 9,712 crore while net profit jumped 37% to Rs 2,191 crore, reflecting strong demand for APIs and robust growth momentum.
The company demonstrated remarkable quarterly consistency with Q3FY25 net profit of Rs 589 crore, up 64.5% Y-o-Y, and EBITDA rising to Rs 743 crore with margins improving to 32.04% from 26.9%. Q2 FY25 achieved consolidated revenue of ₹2,444 crore, up 22.50% YoY, with PAT of ₹510 crore, up 46.55% YoY.
Market cap stands at ₹1,63,282 crore with the company maintaining healthy dividend payout of 43.2%, demonstrating strong cash generation capabilities. Divi's Laboratories stands out as the sector's most preferred name, valued for its strong track record and broad domestic ownership with mid- to long-term growth visibility.
The company has positioned itself strategically for future growth with aggressive capex of ~₹1000-2000 crore including greenfield Kakinada plant over next two years to capture ~US$20 billion opportunity of APIs going off-patent over FY23-25.
Strong business mix with custom synthesis and generics contributing 53% and 47% respectively, while EBITDA margins expanded from 26.4% to 32%, showcasing superior operational efficiency and pricing power in premium API segments.
New Unit-3 operations started with ₹30/share dividend declared, indicating continued capacity expansion and shareholder-friendly policies. The company's focus on complex APIs and custom synthesis provides sustainable competitive advantages and higher margin profiles.
It is rare to find an Indian pharma company which makes systematic investments towards building customer trust, improving compliance and ramping up manufacturing efficiency, positioning Divis as a quality leader in the global API space.
Operating margin expansion from previous years demonstrates excellent cost management and operational leverage benefits. Strong balance sheet fundamentals and consistent profitability growth support the technical breakout thesis for sustained momentum in the premium pharma segment.
Conclusion
Divis Laboratories' outstanding 36.9% YoY PAT growth and 19.3% revenue surge in FY25, coupled with consistent quarterly outperformance, creates compelling technical and fundamental convergence at the critical ₹6,200-6,300 zone. The company's market leadership position, aggressive expansion plans targeting $20 billion off-patent opportunity, and strong sectoral tailwinds provide robust backing for sustained growth. Critical breakout above ₹6,300 with volume confirmation could unlock significant upside toward the ₹7,000 target zone. The 2-decade wealth creation journey continues with fresh technical setup favoring further upside in this premium API play.
Disclaimer: tinyurl.com

Divis Labs: Stellar FY25 Results Set Stage for Fresh Breakout🔍 Technical Analysis
Divis Laboratories has demonstrated exceptional technical progression with a super bullish rally spanning an incredible 2 decades, establishing itself as one of India's premier pharma success stories. The stock's consistent uptrend reflects the company's strong fundamentals and market leadership in the API segment.
From October 2024, the ₹6,250-6,300 zone emerged as formidable resistance, creating a critical supply area that tested multiple times. However, the game-changing catalyst arrived with the announcement of stellar FY25 results showcasing record revenue growth and impressive profitability metrics.
The positive FY25 performance and strong YoY growth provided the momentum needed to break above the stubborn ₹6,250-6,300 supply zone, with the stock rallying impressively to ₹7,071 - marking a significant 13% surge from resistance levels.
However, profit-booking and market volatility caused a correction back to ₹5,800 levels, and the stock is now trading at ₹6,200, finding itself once again at the critical supply zone. This same resistance area that was conquered earlier now acts as a key battleground for the next directional move.
Entry Strategy: Enter on confirmed breakout above ₹6,300 with strong volume, or accumulate on dips if ₹6,200 holds as support with bullish candlestick patterns.
🎯 Targets:
Target 1: ₹6,600
Target 2: ₹6,800
Target 3: ₹7,000
🚫 Stop Losses:
Critical Stop: ₹6,100 (below current support zone)
If this zone doesn't sustain and shows rejection, no more expectations on this stock.
💰 FY25 Financial Highlights (vs FY24 & FY23)
Total Income: ₹9,360 Cr (↑ +19.3% YoY from ₹7,845 Cr; ↑ +20.5% vs ₹7,767 Cr in FY23)
Total Expenses: ₹6,387 Cr (↑ +13.3% YoY from ₹5,635 Cr; ↑ +18.3% vs ₹5,397 Cr in FY23)
Operating Profit: ₹2,973 Cr (↑ +34.5% YoY from ₹2,210 Cr; ↑ +25.4% vs ₹2,370 Cr in FY23)
Profit Before Tax: ₹2,916 Cr (↑ +34.8% YoY from ₹2,163 Cr; ↑ +23.1% vs ₹2,369 Cr in FY23)
Profit After Tax: ₹2,191 Cr (↑ +36.9% YoY from ₹1,600 Cr; ↑ +20.1% vs ₹1,824 Cr in FY23)
Diluted EPS: ₹82.53 (↑ +37.0% YoY from ₹60.27; ↑ +20.1% vs ₹68.71 in FY23)
🧠 Fundamental Highlights
Divis Laboratories delivered spectacular FY25 performance with PAT surging an exceptional 36.9% YoY to ₹2,191 crore, driven by robust demand for APIs and strong execution across all business segments. Revenue surged 19% to Rs 9,712 crore while net profit jumped 37% to Rs 2,191 crore, reflecting strong demand for APIs and robust growth momentum.
The company demonstrated remarkable quarterly consistency with Q3FY25 net profit of Rs 589 crore, up 64.5% Y-o-Y, and EBITDA rising to Rs 743 crore with margins improving to 32.04% from 26.9%. Q2 FY25 achieved consolidated revenue of ₹2,444 crore, up 22.50% YoY, with PAT of ₹510 crore, up 46.55% YoY.
Market cap stands at ₹1,63,282 crore with the company maintaining healthy dividend payout of 43.2%, demonstrating strong cash generation capabilities. Divi's Laboratories stands out as the sector's most preferred name, valued for its strong track record and broad domestic ownership with mid- to long-term growth visibility.
The company has positioned itself strategically for future growth with aggressive capex of ~₹1000-2000 crore including greenfield Kakinada plant over next two years to capture ~US$20 billion opportunity of APIs going off-patent over FY23-25.
Strong business mix with custom synthesis and generics contributing 53% and 47% respectively, while EBITDA margins expanded from 26.4% to 32%, showcasing superior operational efficiency and pricing power in premium API segments.
New Unit-3 operations started with ₹30/share dividend declared, indicating continued capacity expansion and shareholder-friendly policies. The company's focus on complex APIs and custom synthesis provides sustainable competitive advantages and higher margin profiles.
It is rare to find an Indian pharma company which makes systematic investments towards building customer trust, improving compliance and ramping up manufacturing efficiency, positioning Divis as a quality leader in the global API space.
Operating margin expansion from previous years demonstrates excellent cost management and operational leverage benefits. Strong balance sheet fundamentals and consistent profitability growth support the technical breakout thesis for sustained momentum in the premium pharma segment.
✅ Conclusion
Divis Laboratories' outstanding 36.9% YoY PAT growth and 19.3% revenue surge in FY25, coupled with consistent quarterly outperformance, creates compelling technical and fundamental convergence at the critical ₹6,200-6,300 zone. The company's market leadership position, aggressive expansion plans targeting $20 billion off-patent opportunity, and strong sectoral tailwinds provide robust backing for sustained growth. Critical breakout above ₹6,300 with volume confirmation could unlock significant upside toward the ₹7,000 target zone. The 2-decade wealth creation journey continues with fresh technical setup favoring further upside in this premium API play.
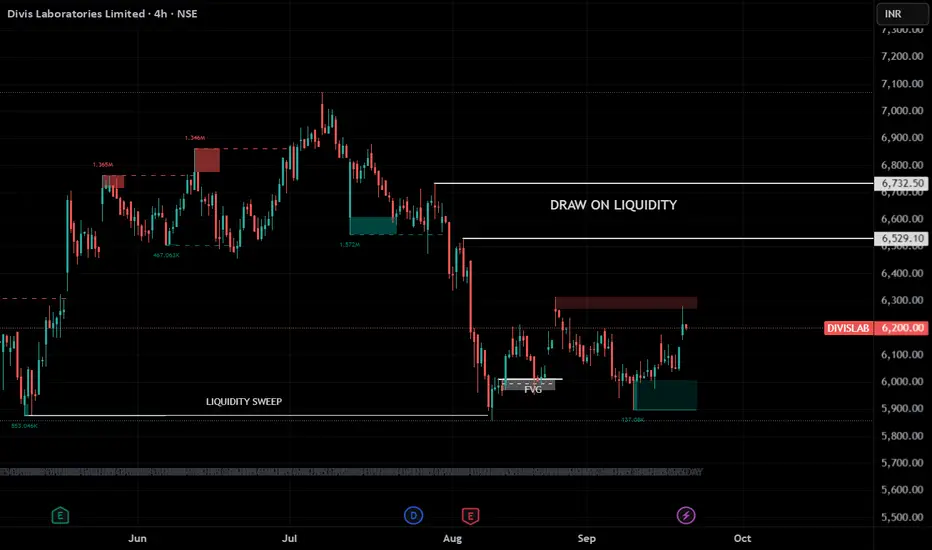
DIVIS LAB STOCK ANALYSISDIVIS LAB liq sweeped - 5878
still in demand zone .discount price so buy accumulate this stocks
1st target - 6528
2nd target - 6721
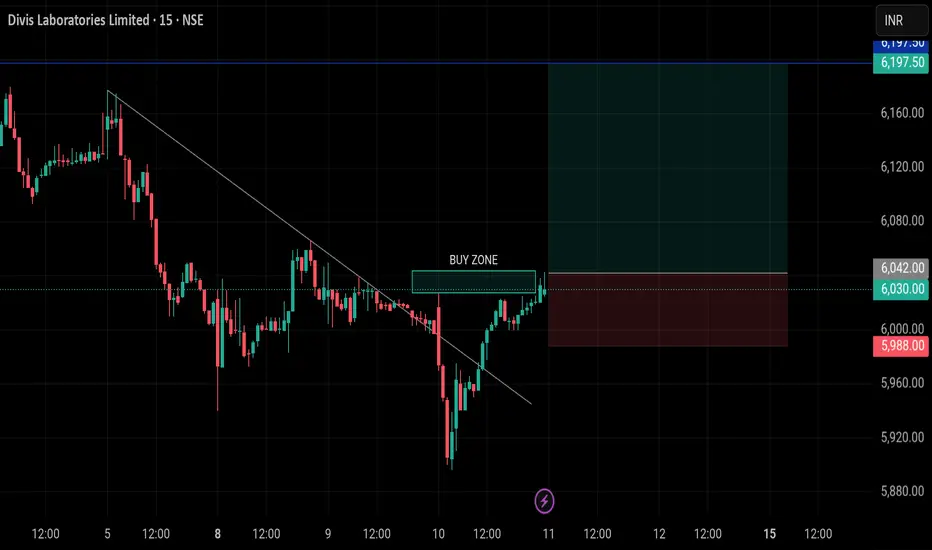
DIVISLAB | Buy Setup | 10 Sep 2025 – 16:33 IST DIVISLAB | Buy Setup | 10 Sep 2025 – 16:33 IST
Buy Zone: 6044 – 6027
Scenario : Buy
Entry: 6042
Stop Loss: 5988
Targets:
TP1 → 6197.50
Analysis:
From Buy Zone (6044 – 6027) creates possibilities for a buy move.
Stay alert on updates here.
⚠️ Disclaimer: This idea is shared for educational purposes only and should not be considered financial advice. Please do your own analysis before making trading decisions.
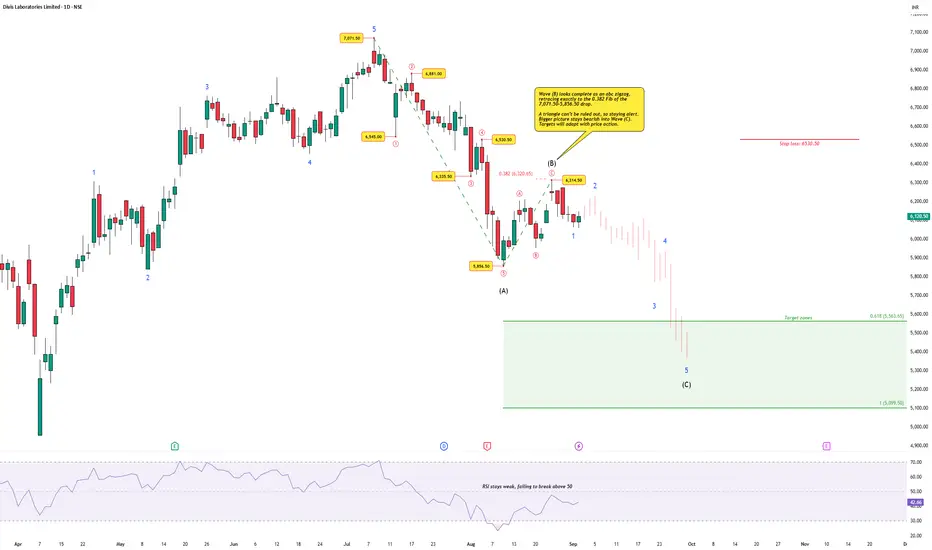
Divi’s Laboratories – Wave (C) Decline Targeting Lower ZonesWave Count
Divi’s Laboratories topped at ₹7,071.50, completing a 5-wave impulse.
From there, price declined in five clear waves into Wave (A) at ₹5,856.50.
The subsequent bounce unfolded as an abc zigzag, peaking at ₹6,314.50 — aligning perfectly with the 0.382 Fibonacci retracement of the 7,071.50–5,856.50 fall.
Wave (B) therefore looks complete, though the possibility of a triangle cannot be fully dismissed. The structure now favors a Wave (C) decline, unfolding in five waves toward lower zones.
Momentum
RSI stays weak, repeatedly failing to break above 50. This confirms lack of bullish strength and supports the bearish case.
Targets
Wave (C) is expected to stretch into the ₹5,563–₹5,100 zone, defined by the 0.618-1.00 extension and prior structural supports.
Trade Plan
Bias: Bearish until Wave (C) completes
Target zone: ₹5,563–₹5,100
Stop-loss / invalidation: Close above ₹6,350.50
Disclaimer: This analysis is for educational purposes only and does not constitute investment advice. Please do your own research (DYOR) before making any trading decisions.
divislab bearish trendshort divislab or buy a PE
divislab will repsect the resistance and double top pattern to show downward trend in the coming week

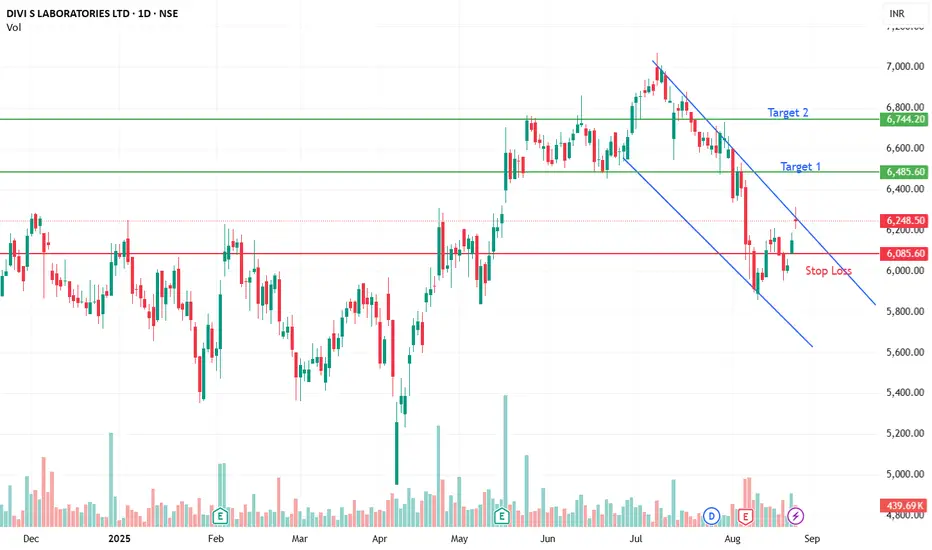
DIVISLAB - Falling Wedge pattern Breakout --> BullishEntry @6248
✅ Overall View
Current Price: ₹6248.50
RSI (Relative Strength Index): 47.62 → This indicates a neutral zone (neither overbought nor oversold).
✅ Support and Resistance Levels
Supports:
S1: ₹6010
S2: ₹6020.35
S3: ₹6162
Price is above all supports, which is positive.
Resistances:
R1: ₹6248.90 (current price is very close)
R2: ₹6275.85
R3: ₹6282.50
The stock is near its immediate resistance, so watch for a breakout above ₹6249–₹6282.
✅ Fibonacci Levels
Key levels derived from previous swing:
23.6%: ₹3754.59
38.2%: ₹4388.45
50%: ₹4900.75
61.8%: ₹5413.05
78.6%: ₹6142.42 (Price is above this level → bullish sign)
✅ Moving Averages
Short-Term:
EMA5 = ₹6141.71, SMA5 = ₹6102.50 → Price is above both → short-term trend is positive.
EMA9 = ₹6136.91, SMA9 = ₹6096.78 → Also bullish short-term.
Medium-Term:
EMA20 = ₹6237.30, SMA20 = ₹6240.43 → Price is slightly above → neutral to bullish.
Long-Term:
EMA50 = ₹6383.40, SMA50 = ₹6532.76 → Price is below → long-term still weak.
EMA200 = ₹6038.53, SMA200 = ₹6107.82 → Price is above → long-term trend is positive.
✅ Interpretation
RSI near 47 → Neutral (not overbought or oversold).
Price near immediate resistance (6248.90) → If breaks above ₹6282 with volume, bullish momentum possible.
Above major Fibonacci (78.6%) and above 200-day EMA/SMA → Long-term bullish bias.
Medium-term and short-term averages show slight strength but need a breakout above ₹6282 for strong uptrend.
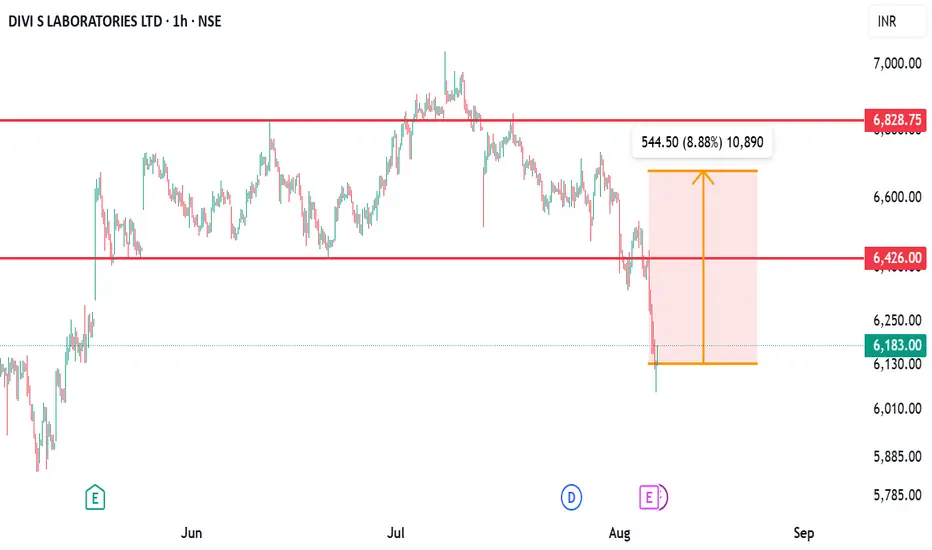
DivisLab showing bullish momentum aheadExpecting an upside move of 8% from current market price
Target: 6677
Keep watch for strong follow-through in upcoming sessions.
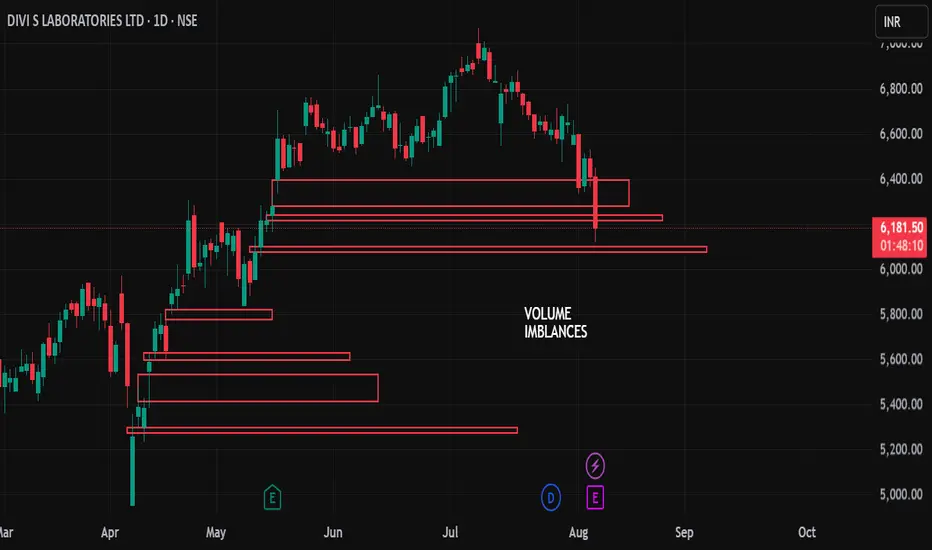
Understanding Volume ImbalancesUnderstanding Volume Imbalances – The Market’s Unfinished Business
A Volume Imbalance occurs when price moves very quickly upward or downward, leaving behind price zones where little or no trading has taken place – often called No Trade Zones. These imbalances can be spotted on the daily timeframe and are similar in nature to gap ups or gap downs. They typically happen due to strong news, institutional activity, or sudden shifts in sentiment. Market behavior shows that these gaps are often “filled” within 2–3 months, as price revisits these levels to balance out trading activity. For traders, these zones act as important reference points for future support, resistance, or potential trade targets.
#VolumeImbalance #PriceAction #GapTrading #MarketStructure #TechnicalAnalysis #TrueDirections1
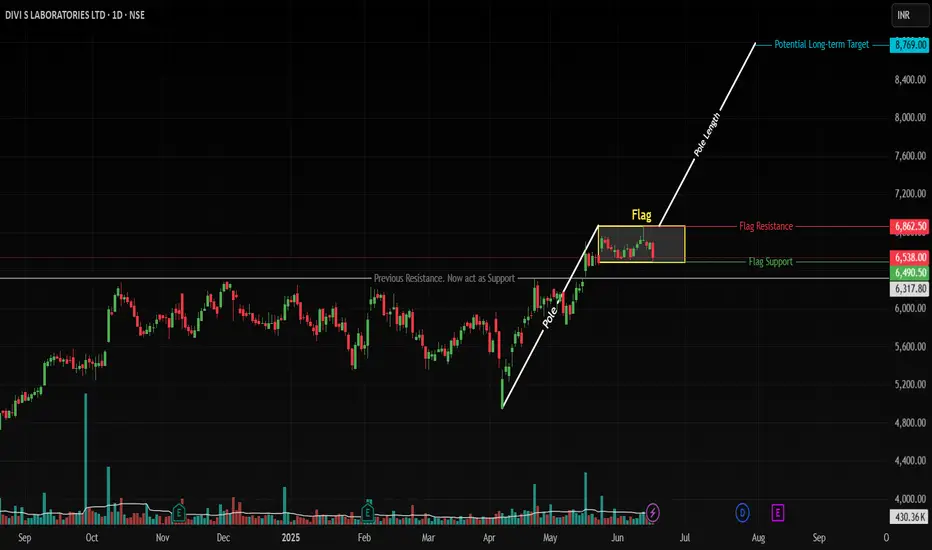
DIVISLAB: Flag & Pole Breakout Setup Targets New ATHsNSE: DIVISLAB | Pharmaceuticals | Large Cap | Updated: June 17, 2025
📊 Technical Structure
Pole Formation: Rally from 4,955 → 6,862 (1,907 points) on high volume
Flag Consolidation: Tight range between 6,490 (support) and 6,800 (resistance)
Key Breakout Trigger: Daily close above 6,862 (ATH)
Pattern Target: 8,769 (6,862 + 1,907 pole length)
Critical Support: 6,300 (confirmed swing low)
🎯 Price Targets & Roadmap
Immediate Target: 7,200 (2024 swing high)
Strong Resistance Zone: 7,600-7,750 (analysts ceiling)
Pattern Target: 8,769 (100% pole extension)
Confirmation Required for 8,769:
• Breakout volume >650K (20% above 20D avg)
• Pharma sector PE >42 (currently 39.2)
⚡ Trade Strategy
Scenario 1: ATH Breakout (Preferred)
Entry: Daily close above 6,862 (6,880-6,900 zone)
Targets:
• 7,200 (book 30% profits)
• 7,600 (book 50% profits)
• 8,769 (full exit)
Stop Loss: 6,700
Scenario 2: Flag Breakdown
Entry: 6,300-6,160 (50-DMA confluence)
Target: 6,800 flag retest → 7,200
Stop Loss: 6,050
Risk Management Essentials: Max 2% capital per trade
⚖️ Fundamental Drivers
Strengths:
• 15.4% ROE (vs sector 12.1%)
• 17% EPS growth (FY26E)
• FII holdings ↑2.1% YoY to 18.01%
Risks:
• High PE 79.2 (sector 39.2)
• Overbought risk above 7,600
⚠️ Critical Risks
Valuation Risk: Profit-booking likely near 7,600
Sector Risk: Pharma index seasonality (+4.91% avg June)
📉 Real-Time Levels
Current Price: ₹6,538 (-2.24% today)
Support: 6,490 (flag base) → 6,300 (swing flip)
Resistance: 6,800 (flag top) → 6,862 (ATH)
Volume Alert: Breakout requires >650K shares
✅ Conclusion
DIVISLAB offers a high-reward setup with defined risk parameters. The flag breakout above 6862 is the preferred play, backed by sector leadership and earnings growth. Always hedge with stops—overvaluation remains a concern.
📜 Disclaimer
This analysis represents my personal market view and not investment advice. Trading carries significant risk of capital loss. Past performance doesn't guarantee future results. Always:
Conduct your own due diligence
Consider your risk tolerance
Consult a SEBI-certified advisor
Verify real-time data before acting
Never risk more than you can afford to lose.
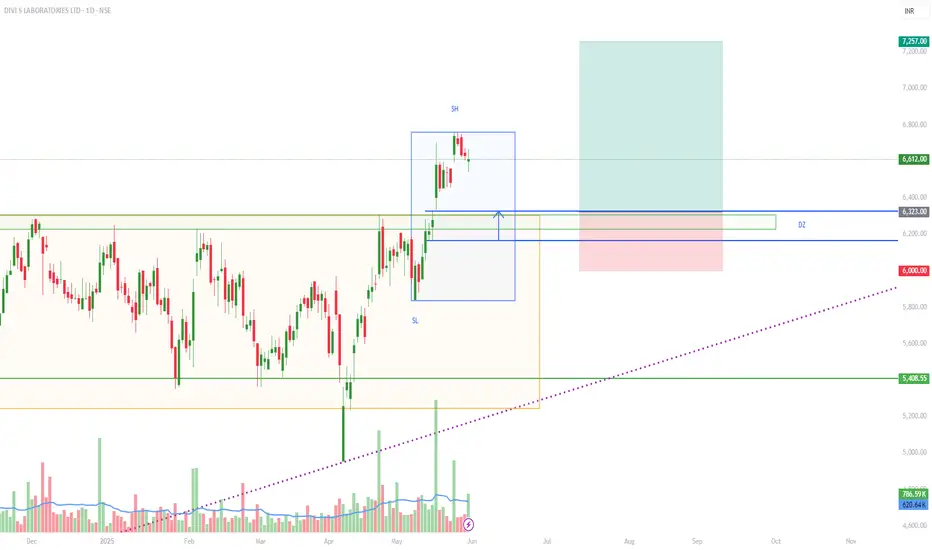
[DIVISLAB] - Potential pullback entry at the [RTS + DZ]
STOCK TREND - BULLISH
MULTI TF ANALYSIS
=================
MONTHLY - Rounding Bottom + ATH breakout with good Volume
WEEKLY - Box Consolidation near ATH
DAILY - Box Consolidation + Resistance turned Support(RTS) level breakout
TECHNICAL ANALYSIS
===================
Stock Price is trading above
RSI is above
Support Level -
Demand Zone -
FUNDAMENTAL ANALYSIS
======================
Compounded Sales Growth - 19%
Compounded Profit Growth - 37%
Stock Price CAGR - 54%
Return on Equity - 15%
TRADE DESIGN
==============
Potential pullback entry at the confluence of
ENTRY - 6323
SL - 6000
TARGET - 7257
RRR - 1:2.89
Disclaimer: This chart study is for educational purpose only. Kindly trade at your own risk.
PCR ( Put Call Ratio) Trading StrategyThe Put Call Ratio (PCR) is a market sentiment indicator calculated by dividing the total volume of put options by the total volume of call options. It's used to gauge whether traders are predominantly betting on a market decline (puts) or rise (calls). A high PCR suggests bearish sentiment, while a low PCR indicates bullish sentiment.

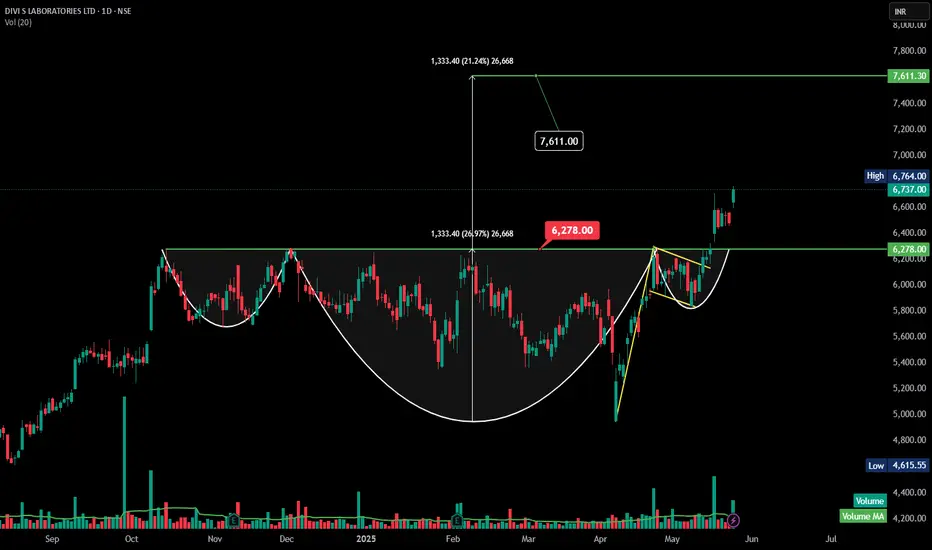
DIVISLAB -Inverted Head and Shoulders -DailyThanks for the clarification! Yes — the chart **does** resemble an **Inverted Head and Shoulders** pattern (a bullish reversal pattern), especially visible in the price structure before the breakout above ₹6,278.
---
### 🟢 **Inverted Head and Shoulders – Analysis (Divi's Lab)**
#### **Pattern Structure:**
* **Left Shoulder:** Formed in March.
* **Head:** Deepest low around early April.
* **Right Shoulder:** Higher low formed in late April to early May.
* **Neckline:** Breakout above the ₹6,278 level confirms the pattern.
#### **Breakout Confirmation:**
* Breakout is strong, supported by **increasing volume**.
* Target derived from neckline to head height = approx. ₹1,333.
* **Target after breakout:** ₹6,278 + ₹1,333 = **₹7,611** (already marked on the chart).
---