Trade ideas


THIS TIME DIVIS LONGafter respecting the trend line resistance seems it may come up and 3200 and 3250 can be seen
if not sustain then 3125 and low can be seen
level mark
stay tune on mcpriceaction


Weekly levels (7 to 11 September 2020) - DIVISLABmarked are weekly levels for 7 to 11 september 2020

#DIVISLAB DAILY CHART VIEW#DIVISLAB DAILY CHART VIEW
Divis Laboratories Ltd. is consolidating with progressively declining volume and positive RSI divergence
RSI still 50+.
Stock has initial support at mid bol 3193
On downside 3012 is crucial, once breached it may fall towards 2820 to fill up breakaway gap.
Upper bol 3329-3370 - immediate resistance.


DIVISLAB.. getting tiredDIVISLAB after a big breakout after results and then a pop up for inclusion in nifty looks tired,
RSI on daily in weakening and second high was made with a lower rsi peak,
also it is well outside of keltner channel
expecting a correction to 3200 and below that to 3140 in sept series
SL is 3335
this is for reference only, do your due diligence before trading.


DIVIS LAB Long Setup - Buy above given level onlyCondition : MARKET SHOULD BE POSITIVE
EDUCATIONAL PURPOSE ONLY

[Buddha] DIVISLAB Inside Bar TradeLong if it breaks the high of the previous day with a stop loss at the previous day's low.
Short if it breaks the low of the previous day with a stop loss at the previous day's high.
In case of gap up above the previous day's high or gap down below the previous day's low, please avoid buying it or selling it respectively. Follow the ending of the candle formed in first 5 minutes and follow ORB strategy.

DIVIS LAB | BUYThe stock after a huge gap up post results has been trading sideways to form a bull flag pattern (continuation pattern). The 20 period MA has been a good buy points for stocks forming All Time High. We believe the stock to continue its upward journey in days to come.


This is not a BUY call but a GREAT learningLook at 10th August candle of DIVISLAB with a high wick on top with a high volume bar.
What it signifies..?? Any guess?
It shows buyers were in force and took a very high jump from 2784 to 3063 and they also were successful to take the price upto 3293. But then suddenly Sellers came in force and prices dropped to 3117. This simply signifies that big players with smart money were bearish on the stock and they booked their profit on high bought quantities, which resulted in price drop.
BEWARE friends the breakout was with a very weak candle on high volumes, which will result in gap to be filled in a very short span of time AND the stock will retest it support at 2500-2600 range.
Follow for more market learnings and hit a like if you liked the concept.
-MOHIT RAJANI

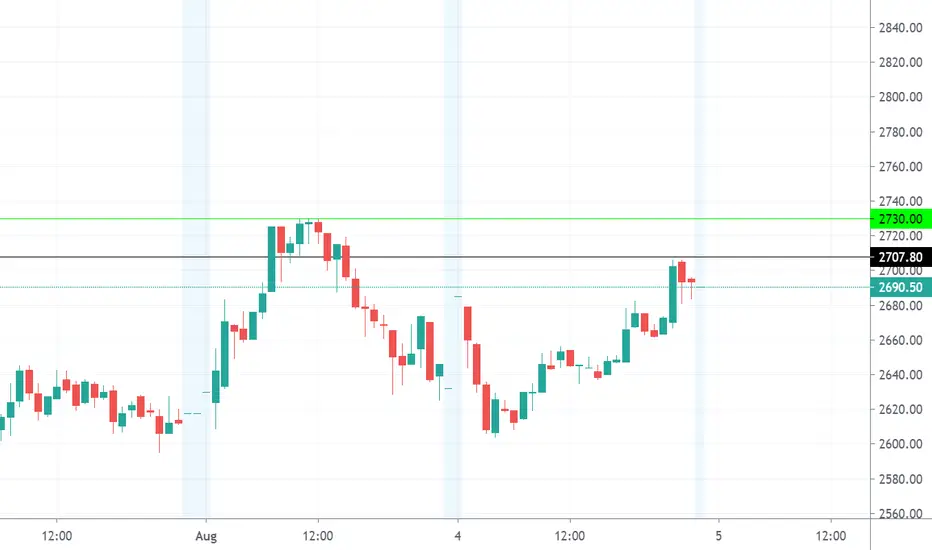
Downtrend started in DIVISLABAs marked in the chart probable downtrend setup is forming in the DIVISLAB
After breaking the important structure, price retested the levels again.
Hourly chart also shows the clear down trend starting.
Further increase in the delivery volume and volume in general also suggests the big move coming.
Next 2 sessions will confirm it further.