Trade ideas


DIVIS - MORE RESISTANCES ENROUTEDIVIS WILL HAVE RESISTANCES AT 1631 / 1642 AND 1658.
THERE IS A WEAK BUY SIGNAL IN THE DAY CHART.
AS THE CLOUDS ARE VERY THIN, THERE SHOULD NOT BE A PROBLEM TO REACH 1672 LVL.

DIVISDIVIS HAS A BUY SIGNAL.
THE TARGET LIKELY TO BE ACHIEVED IS 1676 IN THE COMING DAYS.
STOP LOSS MAY BE PLACED AT 1552.


DivisLab - Daily - Inverted Cup and Target Declaimer: This analysis is for Educational purpose and not for trade and investment.
DivisLab - Daily - Inverted Cup n Handle
Target : 1331- 1260 Approx.
This analysis is invalid, if Daily Close below : 1650


DIVISLAB - Bullish Bat - 1D TFBullish Bat pattern on Daily Chart of DIVISLAB. BUY 1550-1555, SL 1523.9, Target(s) - 1575, 1585,
I starting learning Harmonics some days ago and just observing currently, how the price action works here and thereby trying to refine on my Target(s), SL and entry levels.


DIVISLAB Inside Bar TradeLong if it breaks the high of the previous day with a stop loss at the previous day's low.
Short if it breaks the low of the previous day with a stop loss at the previous day's high.
In case of gap up above the previous day's high or gap down below the previous day's low, please avoid buying it or selling it respectively. Follow the ending of the candle formed in first 5 minutes and follow ORB strategy.

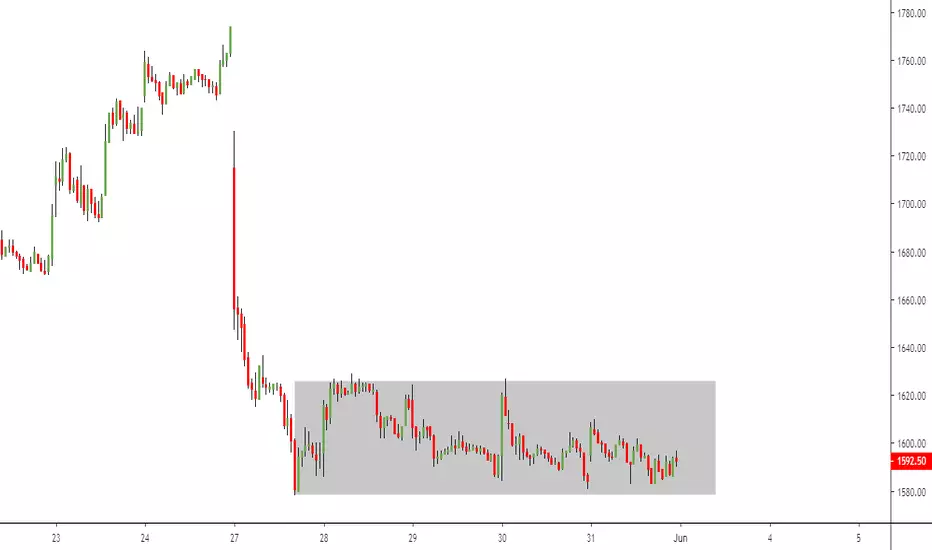
DIVIS - WHAT IS THE REASON?DIVIS SHARE COULD REACH 1500 / 1408 LEVEL ONCE THE SUPPORT 1590 PRICE.
SEE THE GRAPH.
SHARE IS TRADING BETWEEN 1620 AND 1590 DAILY.
TRADE ONLY SHORT.ac

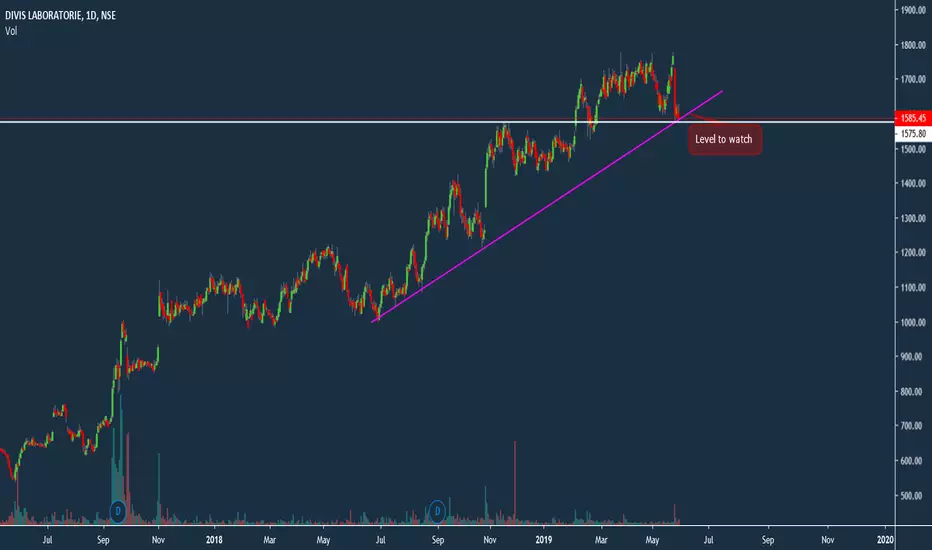

Sell on Reversal or RiseThis kind of structure dont last for long , they tend to brake and move fast out of the structure and also indicates long term
Views
One can look for short selling in Futures , Preferably for 3 Months , and stay with it for this entire move and book profits near the forecast

Divis LabsBreakout above 1775 could potentially take it to 1900.
Looking at this stock from 2 angles. If it breaks out could go to 1900.
If it takes resistance where it has been for the last couple weeks (1775), could get a good intraday or short term short opportunity.
My bias on this stock is Bullish though, but will play it whichever way the market takes it.


DIVISLABS - Bearish Bat - 2H TFBearish Bat pattern on 2H Chart of DIVIS LABS. SELL 1749-1753.
I starting learning Harmonics some days ago and just observing currently, how the price action works here and thereby trying to refine on my Target(s) & SL levels, which I'll be posting when I get proficient enough to.


