DLF - Commencing 5th wave up 770 to be tested firstAs per the EW counts, I believe that the 4th has ended now and the script is in it's early stages of the 5th wave up.
Here is the count on larger TF period
For this series, as per the harmonic pattern, 770 looks very much possible.
Lets track.
Disclaimer: I am not a SEBI registered Analyst and this is not a trading advise. Views are personal and for educational purpose only. Please consult your Financial Advisor for any investment decisions. Please consider my views only to get a different perspective (FOR or AGAINST your views). Please don't trade FNO based on my views. If you like my analysis and learnt something from it, please give a BOOST. Feel free to express your thoughts and questions in the comments section.
DLF trade ideas

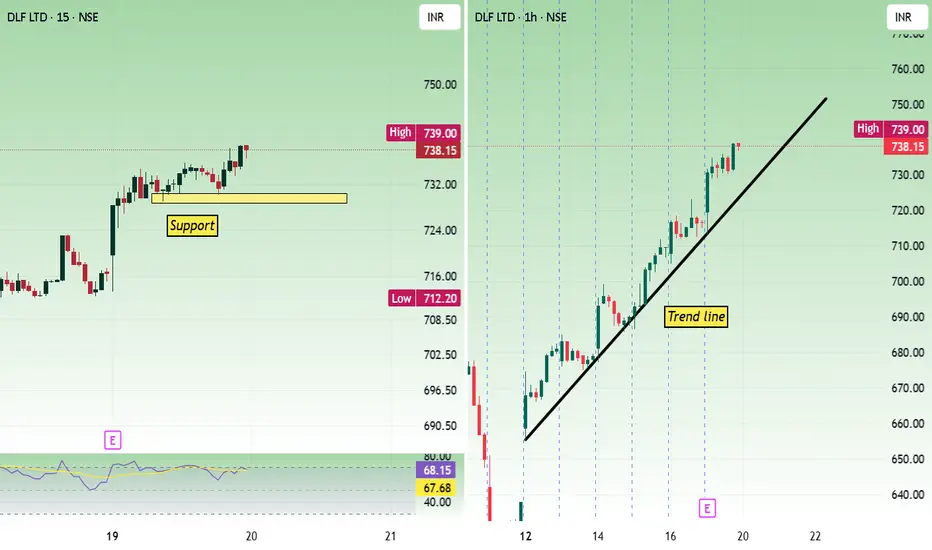
DLFIn one hour chart, whenever price is testing the trend line, it is moving up taking the support. In 15 minutes chart support is seen at 730 zone.
Buy above 734 with the stop loss of 728 for the targets 740, 748, 756 and 764.
Sell below 720 with the stop loss of 727 for the targets 714, 706, 798 and 790.
Resistance is seen at 760 zone. Sustaining this level with volume can move the price towards 780.
Always do your own analysis before taking any trade.
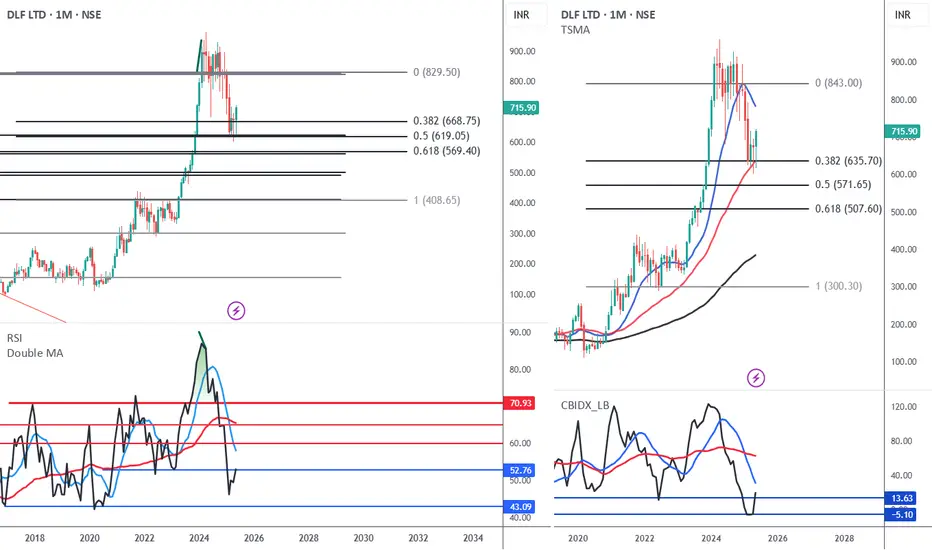
The uptend is intactDLF CMP 716
There are a host of stocks that I posted two months back that have rallied strongly. Will post a few stocks that are still a buy. This can be looked at for trading and investing.
Fibs- the correction to 38.2% from a higher swing is indicating strength.
RSI- that the oscillator is in the bull zone on both monthly and weekly is telling me the longer term trend is intact.
Composite - The oscillator has touched its maximum spread on this correction. This is an indication that bottom is in place.
Conclusion- First tgt is 830 and to me above that the stock will touch new highs.
BearishDLF loos bearish. can test 687. if closes below 685 then 634 is the next target. 732 is the SL on upside

DLF Stock Upcoming days Trade ideas to work like this DLF Stock Upcoming days Trade ideas to work like this, so wo can hold this stock for short term give 10-15% return in upcoming 2 months easily you can add your watchlist and see this
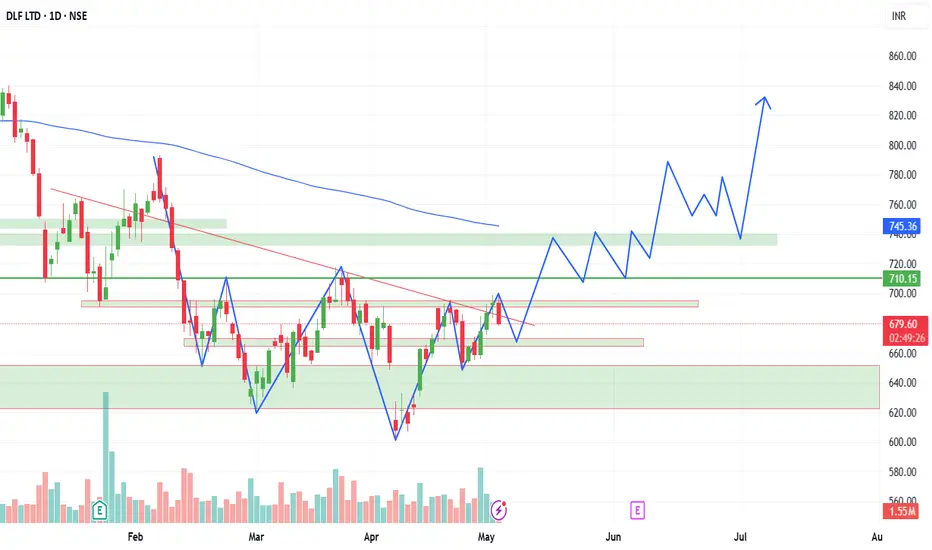
DLFHello & welcome to this analysis
In the hourly time frame after a steep correction followed by consolidation its now on the verge of an Inverse Head & Shoulder breakout above 695 for probable upward levels of 740 & 800.
It has very good support near 670 as shown by the Ichimoku Kumo
All the best

Wolfe Wave on DLFChart is self explanatory.. This pattern works most of the times..
See what happened with Reliance before..

DLF mine favorite stock, its time againDLF was in sideways moves for quite a long, however it was trying to finish the contracting triangle. What more we are at the right time.
Possibilites:
1) we can have another small contracting triangle in which leg e will be the leg a and so on.
2) we will see a sharp move towards 944-945 considering the triangle is completed.
Its a little wait and watch situation for few more days before we see any conclusive move.
Disclaimer: This is for educational purpose only. I am not authorised to give buy/sell recommendation. please do your own analysis and then take a decision.

DLFPrice is moving in a steady down trend. And in that process, price has formed a descending triangle. 680 is the near by resistance and 660 is the near by support.
Buy above 685 with the stop loss of 680 for the targets 690, 695, 702 and 708.
Sell below 676 with the stop loss of 681 for the targets 671, 665, 659 and 652.
Always do your own analysis before taking any trade.

High conviction / value buy stock pick - DLFCheck this stock which has made an all time low and high chances that it makes a "V" shaped recovery.
> Taking support at last years support or breakout level
> High chances that it reverses from this point.
> Volume dried up badly in last few months / days.
> Very high suspicion based analysis and not based on chart patterns / candle patterns deeply.
> VALUABLE STOCK AVAILABLE AT A DISCOUNTED PRICE
> OPPURTUNITY TO ACCUMULATE ADEQUATE QUANTITY
> MARKET AFTER A CORRECTION / PANIC FALL TO MAKE GOOD INVESTMENT
DISCLAIMER : This is just for educational purpose. This type of analysis is equivalent to catching a falling knife. If you are a warrior, you throw all the knives back else you will be sorrow if it hits SL. Make sure to do your analysis well. This type of analysis only suits high risks investor and whose is willing to throw all the knives above irrespective of any sectoral rotation. BE VERY CAUTIOUS AS IT IS EXTREME BOTTOM FISHING.
HOWEVER, THIS IS HOW MULTIBAGGERS ARE CAUGHT !
STOCK IS AT RIGHT PE / RIGHT EVALUATION / MORE ROAD TO GROW / CORRECTED IV / EXCELLENT BOOKS / USING MARKET CRASH AS AN OPPURTUNITY / EPS AT SKY.
Time makes money, GREEDY & EGO will not make money.
The real deal is when to purchase and where to purchase the stock.
LET'S PUMP IN SOME MONEY AND REVOLUTIONIZE THE NATION'S ECONOMY!

DLFPrice is at triple bottom support, which is a bullish pattern. At the same time it is consolidating in the formation of descending triangle which is a bearish pattern.
So how to trade? Let us decode it.
Buy above 738 with the stop loss of 731 for the targets 746, 752, 760 and 768.
Sell below 724 with the stop loss of 731 for the targets 718, 712, 704 and 696.
Do your own analysis before taking any trade.

DLFafter completing wyckoff accumulation bullish pattern, stock has shown weakness to sustain at higher level.
as of now it is in sideway range. Once 810 level is broken it may try to form "M" pattern
Lets wait and watch if this pattern is completed successfully
I do expect it to take minimum 3 months

DLF // Levels As of January 2, 2025, DLF Limited (NSE: DLF) is trading at ₹824.50, reflecting a 0.05% decrease over the past 24 hours.
Technical analysis indicates the following support and resistance levels:
Support Levels:
S1: ₹833.27
S2: ₹819.68
S3: ₹804.52
Resistance Levels:
R1: ₹848.43
R2: ₹862.02
R3: ₹877.18
These levels suggest that if the stock price falls below the immediate support at ₹833.27, it may find the next support at ₹819.68. Conversely, if the price rises above the immediate resistance at ₹848.43, it could encounter the next resistance at ₹862.02.
Additionally, the stock is currently trading between support at ₹820 and resistance at ₹900. A definitive break through one of these levels could indicate a new direction.

DLF - Correction expected in the short termCMP: 865
Price made 5 wave impulse from 744 to 880+ and is showing signs of profit booking.
If this view to play out, we are expecting a dip towards 830 and 800 (50& to 61.8% fib levels respectively).
Remember, this is going to be a ABC corretion, so wait for the A and B to play out for confirmation and then take the C leg down trade..
Or else, wait for the entire correction to get over with and then go for the most rewarding 3rd wave up..
A stock to watch for Jan Series...

Consolidation or Distribution DLF CMP 871
Fib - though the correction has halted at 38.2% from a higher swing which is strength. There is one very major point to be noted. the time correction is very long and that is not good news.
Trendline- the break of the trendline and retest is telling me to be careful.
RSI- every rally is unable to move above the bear zone. this is again negative. Therefore the negative divergence on the highs should be taken seriously.
Conclusion - to me this consolidation is distribution.

Stock is signalling Bullish reversalStock is signalling Bullish reversal
Wait for the breakout with Good Volume confirms upward momentum
look at your eye of this

intraday for 3rd december dlfDLF has reclaimed it breakdown points on chart, whenever breakdown points are reclaimed a good shortcovering follows. Real estate market upgrades are also good in order. For intraday with sl of 828 it can be bought for 864-876 -888 targets. swing traders can target 888, good for postionally 2 to 4 days also.


DLFDLF's candlestick chart has shown a parallel channel breakout, signaling a potential trend change. Here's what it indicates:
Breakout Direction: If upward, it suggests bullish momentum; if downward, bearish sentiment may dominate.
Volume Confirmation: High volume during the breakout strengthens its validity.

Short term longThis stock buying lewel supported many times..
Now again this lewel
What's now.. my view is upside
Only for education purpose..

Is DLF Poised for Further Growth? A Technical AnalysisLet's analyze the daily stock price chart of DLF India Limited and try to predict its future movement.
Technical Analysis:
Current Trend:
Based on the chart, DLF India Limited appears to be in an uptrend. The stock price has been making higher highs and higher lows over the past year, indicating bullish momentum.
Support and Resistance:
* Support:
* The 10-day and 50-day Exponential Moving Averages (EMAs) have been acting as strong support levels.
* The recent low around the 800 level could also serve as a support level.
* Resistance:
* The immediate resistance is the recent high around the 875 level.
* If this resistance is broken, the next resistance could be the psychological 900 level.
Potential Targets:
* Upside Targets:
* If the stock breaks above the 875 resistance, it could potentially move towards the 900 level.
* Further upside could be towards the 1000 level, which was a previous resistance level.
* Downside Targets:
* If the stock breaks below the 800 support level, it could potentially move towards the 700 level.
Indicators:
* Relative Strength Index (RSI): The RSI is currently above 50, indicating bullish momentum. However, it's important to monitor the RSI for potential overbought or oversold conditions.
Future Movement Prediction:
While the current trend is bullish, it's important to consider the following factors:
* Market Sentiment: The overall market sentiment can impact the stock's performance.
* Economic Indicators: Economic factors such as interest rates, inflation, and GDP growth can influence stock prices.
* Company-Specific Factors: News and developments related to the company, such as earnings reports, mergers, and acquisitions, can significantly impact the stock price.
Investment Decision:
Whether to invest in DLF India Limited for the near future depends on your risk tolerance and investment goals. If you have a higher risk tolerance and are looking for short-term gains, you might consider buying the stock at current levels, with a stop-loss order below the recent support level.
However, it's important to remember that the stock market is volatile, and past performance is not indicative of future results. Always conduct thorough research or consult with a financial advisor before making any investment decisions.
Additional Considerations:
* Fundamental Analysis: It's crucial to analyze the company's fundamentals, such as its financial health, business model, and competitive advantage.
* Diversification: Diversifying your portfolio across different asset classes can help reduce risk.
By considering these factors and conducting thorough research, you can make informed investment decisions.
Please note that this is a technical analysis based on the provided chart and does not constitute financial advice. Investing in stocks involves risk, and it's always recommended to conduct thorough research or consult with a financial advisor before making investment decisions.

If u have it hold itDLF CMP 846.6
Trendlines- they act as a timing tool. After consolidating for a while it has now reached the trendline. That doji is telling me it is preparing to reverse.
Fibs- they are not even coming down to 38.2%. This is tremendous strength.
RSI - one very vital point here. See how the RSI has come down to bull support where as there is not much damage to price. This is strength.

DLF Ltd Support and Resistance DLF Ltd. (DLF) on a 1-hour timeframe, here are the key support and resistance levels:
Support Levels: ₹916.25, ₹909.65, ₹901.00
Resistance Levels
