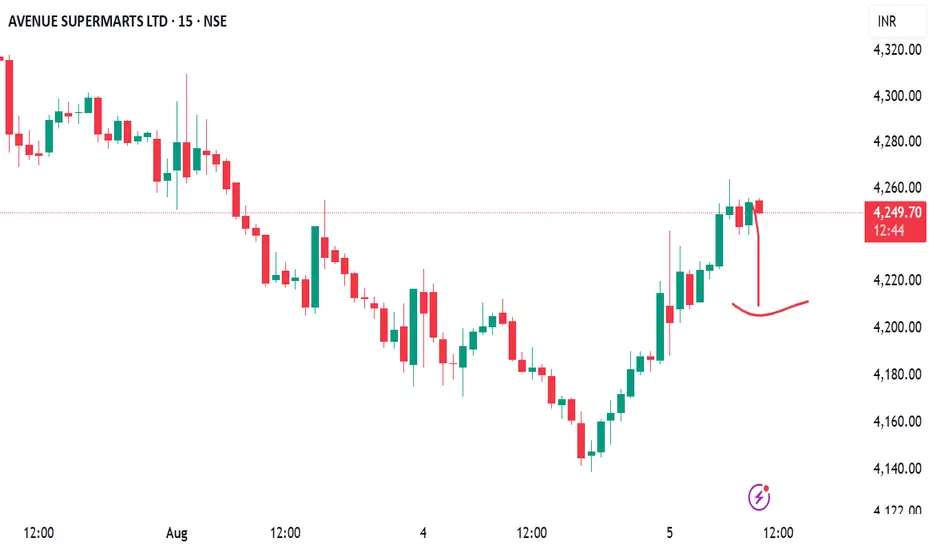
Double bottom created in Dmart 1) On support dmart have formed double bottom pattern
2) falling wedge pattern makes more confirmation that buyers are taking control now
3) In negative market stock didn't breakdown
4) In short term stock may reach 4300 levels with strict sl R:R is good
Avenue Supermarts Ltd.
No trades
What traders are saying

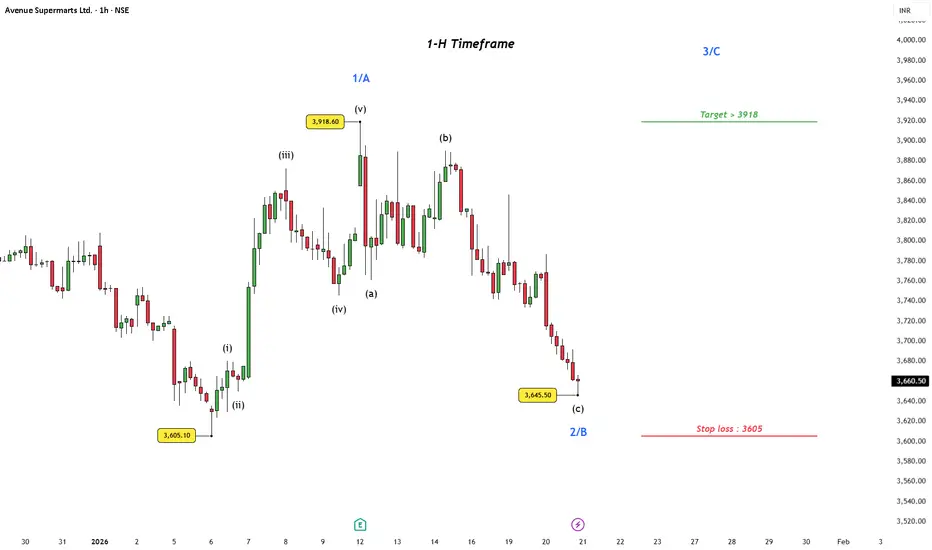
Avenue Supermarts(1-H): Structure Over NoiseToday’s price action was rough across Nifty and the broader market. But beneath the volatility, some charts are quietly holding their structure — and that’s worth paying attention to.
In Avenue Supermarts Ltd , price has unfolded a clean 5-wave advance on the 1-hour timeframe from the 3605.10 low to 3918.60 , allowing the move to be labeled as Wave 1 / A .
The subsequent decline shows a corrective ABC structure , with overlapping price action and weakening momentum — characteristics typical of a correction. The drop into 3645.50 fits well as wave b
, potentially completing Wave 2 / B .
At this point, confirmation of Wave 2 / B completion is still awaited . The bullish structure remains valid only if price continues to hold above 3605.10 on a closing basis . As long as this level is respected, the setup keeps the door open for a potential Wave 3 / C advance , with scope for a retest and possible extension beyond 3918 , offering a favorable reward-to-risk profile .
A decisive close below 3605.10 would invalidate this count and warrant a reassessment.
Disclaimer: This analysis is for educational purposes only and does not constitute investment advice. Please do your own research (DYOR) before making any trading decisions.
DMART in uptrend on 2H timeframeDMART seems to have completed or in the process of completing wave B, after which we will enter Wave C or wave 3.
In either case an upward move is expected.
SL1 -> 3720
SL2 -> 3600, after which the move will be invalidated
Will keep you guys as the move progress

DMART - on good buy levels 3600-3700The stock is holding a strong support zone and may see a good iupside in coming days
Upside target: Open for a big move toward ₹4484/4830/5033+++.
Current level: Around ₹3832.
Any dip near ₹3600 should be viewed as a buying opportunity

DMART 1 Week Time Frame 📊 Recent Price Range (Last Week)
Stock was trading around ₹3,780–₹3,900 in the recent trading sessions.
Weekly price change has been relatively modest, showing a small rise over the past week (~+1–2%) in some data and a slight variation in others due to different closing levels.
🛑 Weekly Support Levels
These are key zones where the price may find buying interest / downside support over a short 1‑week horizon:
1. ₹3,665–₹3,705 — Short-term pivot/support cluster (near prior recent lows).
2. ₹3,531–₹3,597 — Lower support range that may act if the stock breaks below near‑term levels.
3. ₹3,340 — Broader 52‑week low area (reference of major historical support).
📈 Weekly Resistance Levels
These are zones where the price may see selling pressure / upside barriers in the near term:
1. ₹3,841–₹3,881 — Near current pivot and first resistance for short‑term trading.
2. ₹3,929–₹3,950+ — Next upside resistance from classic pivot methods.
3 .Above ~₹4,000 — Psychological and technical interest level (also broker target levels in wider timeframe).
📌 Summary — 1‑Week Key Levels to Watch
Level Type Price Zone
Immediate Support ₹3,665 – ₹3,705
Deeper Support ₹3,531 – ₹3,597
Short‑Term Resistance ₹3,841 – ₹3,881
Higher Resistance ~₹3,929 – ₹3,950+

#DMART RESLUT COMING PERFECT#DMART RESLUT COMING PERFECT
ADD ABOVE 3873 FOR 4949
there are support near 3333 and resisitance near 5200
for long term
after breaking these levels ..new tgt will open

DMART is now ready to big move After a good result and in chart there is good confirmation to buy in this point and the target are 4000, 4200 with the sl 3700

DMART - What can you possibly expect next......💹 Avenue Supermarts Ltd (DMart)
Context: Q3 FY26 Results vs Market Expectations
Chart View: Daily
Market Context: When Good Results Are Not Enough
DMart reported growth in both revenue and profit in its latest quarterly results. The company continues to add stores, customer demand remains steady, and the business model is stable. There was no major negative surprise in the results, and the long-term business story remains intact.
However, the stock market does not react only to whether results are good or bad. It reacts to whether results are better or worse than what the market was expecting. Before the results, many participants were expecting faster sales growth, better margin improvement, and clearer signs of stronger earnings momentum.
The reported numbers, although positive, did not go much beyond these expectations. Because of this, the stock price did not show a strong positive reaction. When a stock is already trading at higher valuations, the market looks for improvement, not just stability.
This difference between expectations and actual results explains the price behaviour. When expectations are high and results only meet them, prices often move sideways or see short-term selling. This does not mean the business is weak — it simply means the market is adjusting its expectations.
From a chart point of view, the stock is facing selling pressure near earlier price levels. Buying interest is limited for now, and price action suggests the stock is taking time to absorb the results rather than moving in a clear direction.
While DMart continues to report double-digit growth, the market is becoming cautious about the pace of that growth. Revenue growth in the latest quarter was lower than the company’s longer-term average and also slower than the rate at which new stores are being added. This suggests pressure on same-store sales. In addition, margins are facing challenges due to intense competition, price cuts in daily-use products, and changes in GST rates. These factors explain why the stock price has remained under pressure despite healthy headline numbers.
The key learning for beginners is simple: stocks do not always go up after good results. Sometimes prices move sideways to allow expectations to cool down. Patience and understanding the bigger picture are more important than reacting emotionally to quarterly numbers.
⚠️ Disclosure & Disclaimer
This post is shared only for educational and informational purposes. It is not investment advice or a recommendation. Stock market investments involve risk. Please consult a SEBI-registered financial advisor before making any investment or trading decisions.
🚀 Stay Calm. Stay Clean. Trade With Patience. Trade Smart | Learn Zones | Be Self-Reliant

DMART - Descending Channel💹 Avenue Supermarts Ltd (NSE: DMART)
Sector: Retail | CMP: 3841.6
View: Reaction from Higher-Timeframe Demand | Early Momentum Recovery
Chart Pattern: Descending Channel (Corrective)
Candlestick Pattern: Strong Bullish Marubozu
________________________________________
Price Action
DMART has spent the last few months in a controlled corrective decline after a prior uptrend, respecting a well-defined descending channel marked by lower highs. Price recently reacted sharply from a higher-timeframe demand base in the 3600 region, printing a decisive bullish expansion candle and closing near the session high. This move signals a shift from passive correction to active demand emergence, with sellers losing near-term control at lower levels. While the broader structure is still recovering and overhead resistance remains intact, the latest price behaviour reflects an early change in character rather than a weak bounce.
________________________________________
Technical Analysis (Chart Readings)
Technically, the chart shows improving alignment after prolonged consolidation. The bullish Marubozu indicates strong buyer dominance with minimal intraday supply. This expansion follows a compression phase, suggesting a short-term volatility release. Momentum indicators remain constructive but not euphoric — RSI around 51 reflects healthy recovery without exhaustion, while price reclaiming short-term averages points to stabilisation above demand. Volume participation is meaningfully above recent averages, confirming that the move is supported by participation rather than thin liquidity. Overall, the technical setup reflects a recovery phase with improving momentum but still within a broader corrective framework.
________________________________________
Key Levels (Chart Readings)
On the downside, a strong structural support zone lies in the 3600–3500 region, which has repeatedly absorbed selling pressure and now acts as the primary downside reference. Intermediate supports around 3719 and 3596 provide near-term cushions during pullbacks. On the upside, immediate resistance is visible near 3907–3972, followed by stronger overhead supply near 4095 and above, where prior distribution has occurred. Price is currently positioned between demand and resistance, making acceptance above these levels critical for sustained upside continuation.
________________________________________
Demand & Supply Zones (Chart Readings)
The demand–supply framework offers clear structure across timeframes. On the Daily timeframe, a major demand zone is established between 3680–3605, forming the broader base for the current recovery attempt, while a higher-timeframe supply zone remains active near 4111–4222. On the Swing timeframe, demand is concentrated around 3680–3605, with swing supply visible near 4173–4222. Intraday demand zones are clustered near 3769–3747 and 3743–3720, highlighting immediate buying interest, while short-term supply remains active near 3668–3658 on pullbacks. These zones frame the current recovery phase, with price rotating upward from demand into nearby supply.
________________________________________
STWP Trade Analysis
DMART has initiated a momentum recovery from a higher-timeframe demand base, supported by rising volume and improving price stability. From an intraday perspective, holding above the 3800–3850 zone keeps the bullish bias intact and allows scope for continuation toward upper resistance levels if participation sustains. From a short-term swing (hybrid) standpoint, the same structure supports a broader mean-expansion framework over the next few sessions, provided price does not slip back into the prior demand range. While the trend bias is turning upward, the presence of overhead supply and elevated volatility warrants disciplined execution, controlled position sizing, and strict respect for structural invalidation levels.
________________________________________
Final Outlook
Momentum: Strong
Trend: Up
Risk: High
Volume: High
The structure favours further recovery as long as price sustains above demand zones, but confirmation through acceptance above overhead supply is essential for trend acceleration. This phase rewards structure awareness, patience, and risk discipline over prediction.

STOCK MARKET: A GAMBLE OR BUSINESS ??The stock market without knowledge is surely a gamble, but with knowledge and patience, it can be a lucrative venture. If someone wants to make a fortune, they are welcome in the stock market—provided they have the right knowledge. We recommend investing rather than trading, as investment is the only reliable way to earn money in this market.

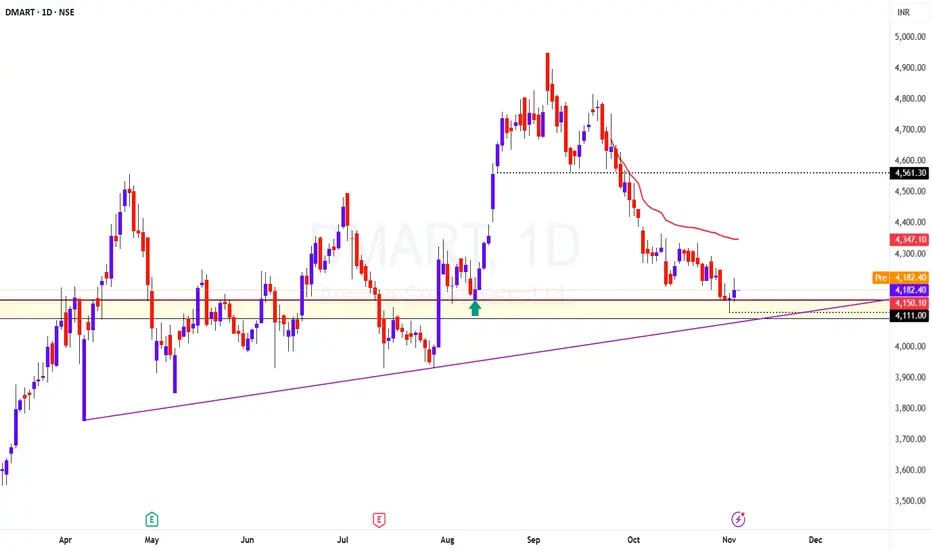
DMART - Will it hold 4000-4100 Support/Demand Zone?TF: Daily
CMP: 4182
Price has formed a pinbar at the 4150 mark and holding the 4100 support/demand zone for now.
Price has moved in an impulse fashion from this level in August 2025
The zone of 4000-4100 has been very strong on weekly TF as well (be it acting as a Resistance or as Support)
Here is the weekly chart with levels for better understanding
At CMP 4180, it looks like a low risk long set up with a daily close below 4100 as Stoploss
Things to be Cautious about:
Price is trading below 200 DEMA, safe traders can wait for the daily close above 200 DEMA (4250 levels)
Price is trading below the Cloud as well
Strict SL is a must for long bias trades.
Definitely this is not a place to go SHORT
Disclaimer: I am not a SEBI registered Analyst and this is not a trading advise. Views are personal and for educational purpose only. Please consult your Financial Advisor for any investment decisions. Please consider my views only to get a different perspective (FOR or AGAINST your views). Please don't trade FNO based on my views. If you like my analysis and learnt something from it, please give a BOOST. Feel free to express your thoughts and questions in the comments section.
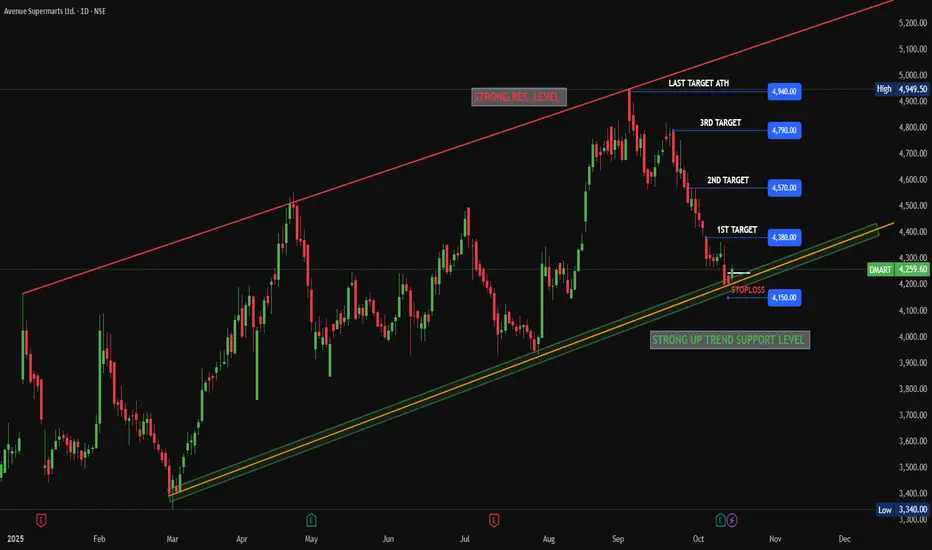
DMART LONGDMART (Avenue Supermarts) has reached a strong trend support level. Additionally, in the daily timeframe, the current candle closed at the previous day's candle level.
Therefore, we can go long in DMART for a swing trade. Fundamentally, the quarterly results are already out, so there is no immediate issue regarding upcoming events.
Go long on DMART, but make sure to manage your trade quantity, risk, and reward based on your risk appetite. This is for educational purposes only and does not guarantee returns.
DMart(Avenue Supermarts Ltd) – A Correction Inside a CorrectionOn the daily chart, DMart(Avenue Supermarts Ltd) appears to be unfolding a clean (a)-(b)-(c) correction within the ongoing downtrend from ₹4,949.50.
The initial leg down to ₹4,111 unfolded in five waves, marking Wave (a) of the correction. A relief rally is likely next — an expected Wave (b) move that could face resistance around the ₹4,500–₹4,600 zone.
If this view holds, a final Wave (c) decline may complete the pattern near ₹3,300–₹3,400 — aligning with the previous demand area. RSI is trying to rebound from oversold territory, hinting that the short-term recovery phase could soon begin.
When we zoom out to the weekly chart, this entire structure fits as part of a larger W–X–Y double zigzag correction that began from the ₹5,900 all-time high.
In other words — a correction inside a correction .
Until price convincingly breaks above ₹4,950, DMart remains in a broader corrective phase. The bulls may see short-term relief, but the bigger correction likely hasn’t finished playing out.
Disclaimer: This analysis is for educational purposes only and does not constitute investment advice. Please do your own research (DYOR) before making any trading decisions.

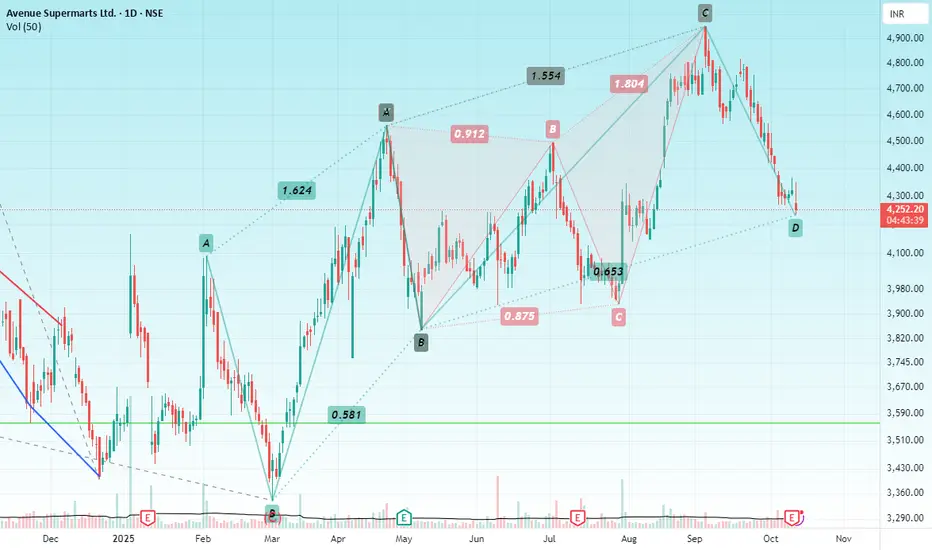
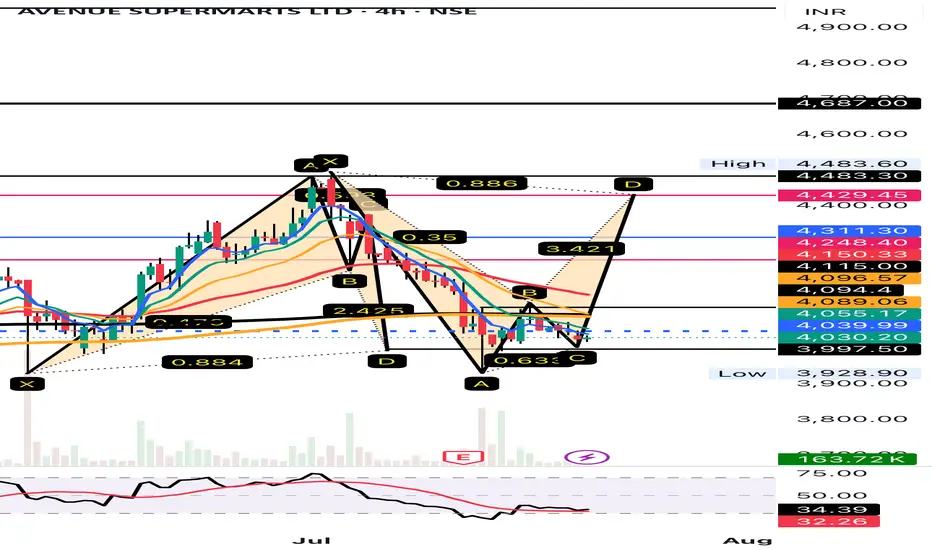
DMARTHello & welcome to this analysis
DMART has usually reversed regularly from Harmonic Patterns as can be seen in this chart in daily time from a
Bullish Reciprocal ABCD
to a
Bearish Deep Crab
to now forming a
Bullish Reciprocal ABCD
If it sustains above 4200 then it could give a probable bounce/reversal to 4400 & 4550 indicating a good risk : reward ratio
All the best
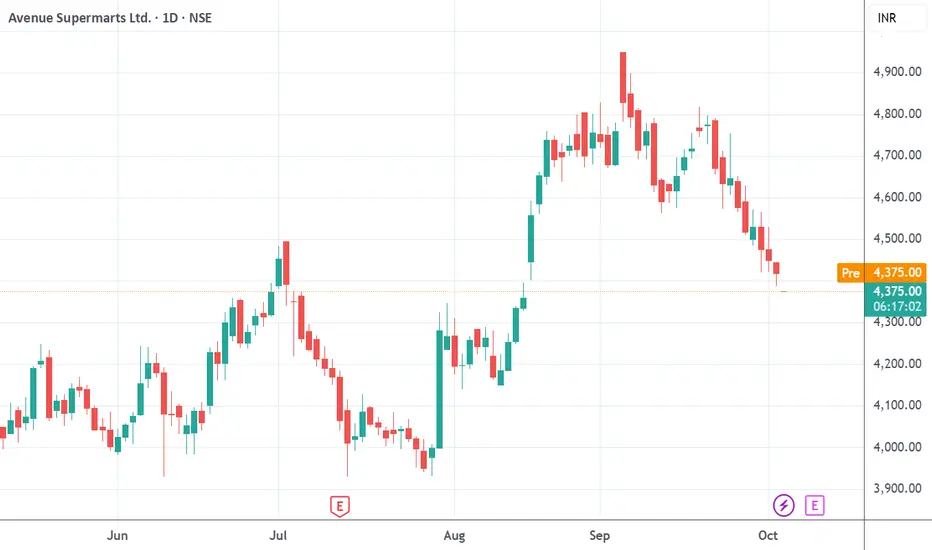
Trade Setup: DMART | Rally–Base–Rally zone 14AUG25🟢 Trade Setup: DMART (Avenue Supermarts Ltd)
- 📅 Entry Date: Oct 06, 2025
- 💰 Buy Price: ₹4375
- 🔍 Setup Logic: Rally–Base–Rally zone identified around 14AUG25, signaling bullish continuation
- 🧠 Bias: Anticipating momentum build-up into the 14AUG25 zone
- ⏳ Exit Plan: Will exit before Oct 20, 2025 (14 days from entry)
- 📌 Exit Price: To be updated post execution
- 📊 Trade Type: Positional, short-term momentum play
- 🛡️ Risk Note: Time-based exit strategy, not dependent on price target
#DMART #RallyBaseRally #TradeSetup #PositionalTrade #StockMarketIndia #TechnicalAnalysis #TradeJournal #MomentumPlay #ShortTermTrade #TradingViewIndia #EthicalTrading #TradeHow #OctTrades #NSEStocks #PriceAction #ExitStrategy #TradingDiscipline
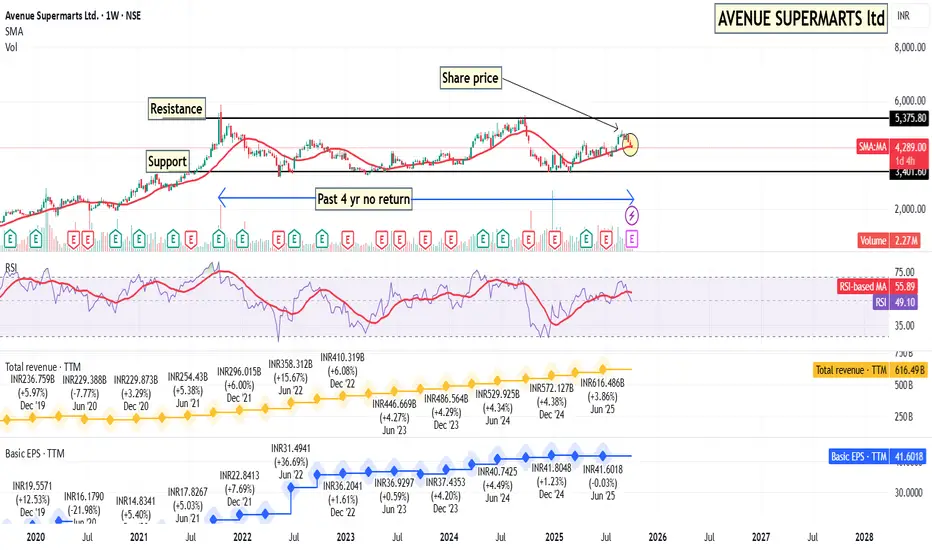
DMARTIn past 4 years dmart has given no return as an investor so invest wisely some uncles would say they believe in this share and their fore, they had bought it it's good to park money, but it is also important to make money from those park money. i would like to say that one of my professors tells a lot about this share but. the most important things to me is make money first then get some knowledge because in market you have to make money first a lecture later because money in the Indian stock market are only made in certain limited area of market so it is better to avoid this share, and we will see when it crosses its resistance with heavy volume
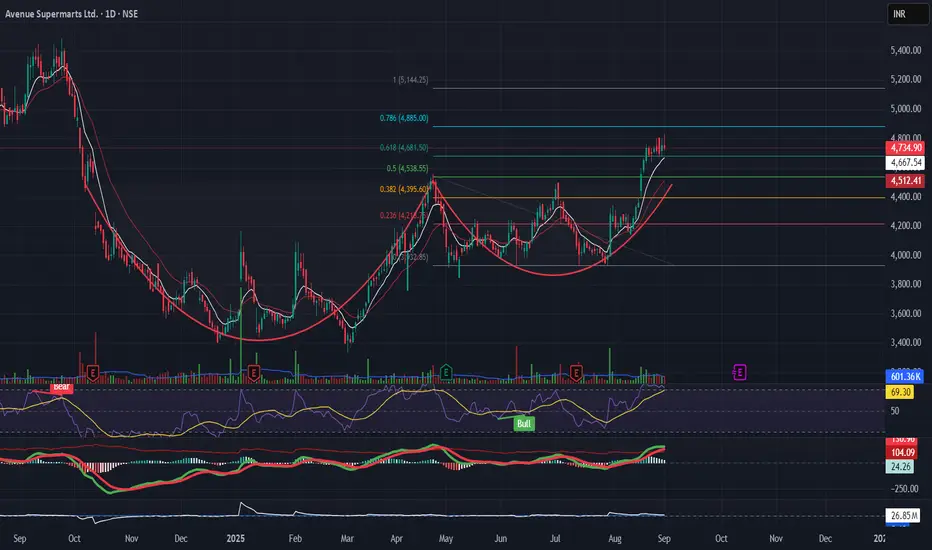
D’Mart (Consumption) Possible Throwback to breakout levelD’Mart (Consumption)
Chart Context:
D’Mart after its breakout near ₹4524 with EMAs aligned bullishly d'Mart Start Weakening and possible throwback to the breakout level. RSI is above 69, indicating strength. Fib levels highlight potential upside to ₹4,885 → ₹5,145.
Post Caption:
"D’Mart sustaining above ₹4,524 breakout zone.
Upside levels: ₹4,885 → ₹5,145.
Stop near ₹4,540.
🛒 Consumption theme continues to show leadership."
DMART BREAKINGLONG TERM RESISTANCE WEEKLYDMART breaking long time resistance on weekly chart
huge volume, bullish RSI above 60
trading above 20 ema
GST Reform effect
target1 4900 target2 5400
sl 3900 use ur own sl
NO BUY/SELL RECOMENDATION

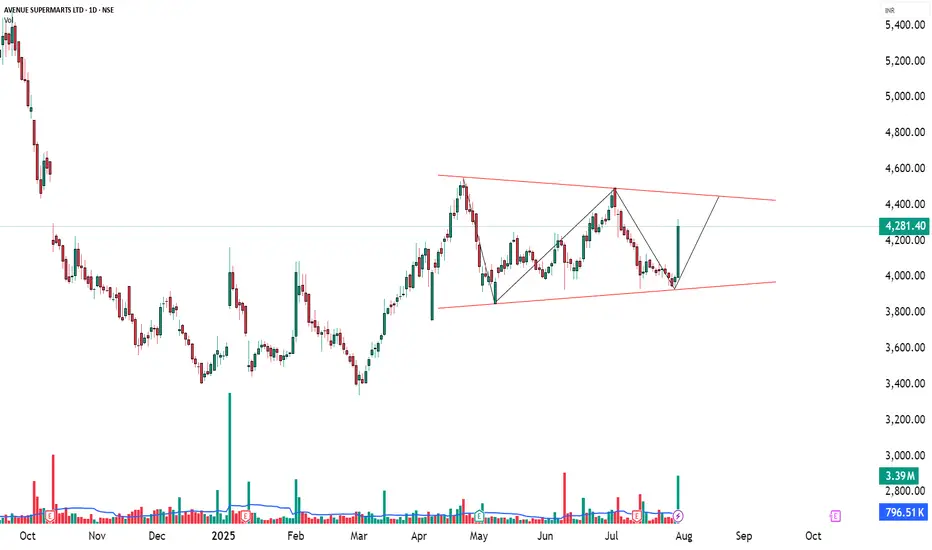
AVENUE SUPERMARTS LTD#STOCK : # Avenue Supermarts
#Chart Time Frame : #Daily
#Structure : #Symmetrical Triangle BO on daily basis
On #Daily Time Frame the stock has given a good BO of Symmetrical Triangle Pattern with increasing volumes
So it looks good for long as per the levels mentioned below :
#CMP : 4558 or BoD 4400
#Target 1 - 4690
#Target 2 - 4925
#Target 3 - 5160
#SL - 4100
#Holding Time Frame - #Medium Term
All Charts & Studies posted here are only for #EDUCATIONAL PURPOSE

DMart – Short ViewDMart is showing signs of weakness in the current session, with selling pressure building up. If the stock fails to hold above key support levels, we may see further downside movement.
Short View: Bearish
Target: ₹4210
DMART – A Clean Case Study in Patience & Price Action________________________________________
Ticker: NSE: DMART
Sector: Retail – Supermarkets & Hypermarkets
Market Cap: ≈ ₹2.78 lakh crore (approx as of July 30, 2025)
Current Price: ₹4,281.40 (up ~7% on July 30, 2025)
Technical Rating: ⭐⭐⭐⭐⭐
________________________________________
📢 DMart (Avenue Supermarts) Update – July 30, 2025:
If you’re a new investor tracking India’s retail space, DMart just gave us a masterclass in how market sentiment can flip fast — and why fundamentals still matter.
In its Q1 FY26 results, DMart reported a modest 2% profit growth (₹830 cr), despite a solid 16% jump in revenue. This raised concerns among analysts about tight margins and intensifying competition, especially from fast-moving consumer goods (FMCG) and quick-commerce players. Not surprisingly, the stock dipped around 2.6% post-results.
But fast-forward to late July, and the narrative flipped.
On July 30, DMart shares surged 7–8% intraday, marking their biggest rally since March, after announcing the opening of its 426th store and laying out a bold expansion plan. The market cheered the company’s strong growth visibility and confidence in its value-retail model. CEO Neville Noronha emphasized the importance of store additions, digital scaling via DMart Ready, and the company’s resilience in a competitive landscape.
On the digital front, online grocery sales grew 21% YoY to ₹3,502 cr in FY25 — a good sign of consumer shift — though losses widened as DMart expanded into new cities.
What’s the takeaway? For learners, this is a great example of how stocks don’t move just on earnings, but on future guidance, strategy, and investor confidence. DMart may not have wowed with profits this quarter, but its long-term vision still packs a punch.
________________________________________
📉 Technical Analysis | Chart Pattern: Potential Breakout Brewing:
DMART has been consolidating in a symmetrical triangle pattern on the daily chart since April 2025 — a classic setup that often signals a big move ahead. On July 30, the stock showed signs of life with a strong 7% gain and a 5× volume spike, which usually reflects institutional accumulation and rising trader interest.
🔍 But here’s the key insight:
Despite the surge in volume, the price has not yet convincingly broken above the triangle’s upper trendline. This means there’s no valid price breakout yet — only a volume-based alert. For newer traders, this is a great example of why volume alone isn't enough. A true breakout needs a strong candle closing above the pattern, preferably with follow-through buying.
________________________________________
🔼 Key Resistance Levels to Watch:
₹4,403 – Recent swing high and immediate target if breakout confirms
₹4,526 – April top and near-term bullish milestone
₹4,728 – Long-term resistance if momentum builds up post-breakout
🔽 Important Support Levels:
₹4,078 – Breakout support zone and first pullback entry area
₹3,876 – Base of the triangle, also a structural support
₹3,753 – Deeper support, invalidation point if breached
________________________________________
🧭 Strategy Insight for New Traders:
This is a textbook case of a "breakout watchlist" setup. With strong bullish indicators — RSI > 60, MACD crossover, Supertrend flip, and a BB Squeeze breakout setup — the chart is preparing for a move. But confirmation is key.
✅ Wait for a clear breakout above the trendline with sustained volume
✅ Avoid chasing the move too early — breakout traps are common
✅ If the breakout confirms, ₹4,403 and ₹4,526 become logical targets
✅ A retest toward ₹4,080 could offer a low-risk long entry if supported by volume
________________________________________
🧠 Pro Note for Beginners: A breakout isn’t just about price jumping — it’s about structure, confirmation, and follow-through. Think of volume spikes as the "whispers" before the market makes a bold statement.
________________________________________
🔍 Fundamental Analysis:
If you’re just starting out in stock market investing, DMART offers an interesting case study—a well-run retail company with strong fundamentals and a clear growth story. As of July 2025, DMART has shown solid performance, especially in revenue growth, while keeping debt levels incredibly low.
In Q1 FY26, the company posted standalone revenues of ₹15,932 crore—up 16.2% YoY—highlighting strong consumer demand and steady growth momentum. Over the full FY25, consolidated revenue rose nearly 17% YoY, reflecting DMART’s consistent top-line performance. However, while revenues are rising fast, margins have seen slight compression. PAT (net profit) for FY25 stood at ₹2,707 crore with a PAT margin of 4.6%, down from 5% a year earlier.
DMART’s earnings per share (EPS) is growing steadily too—₹41.61 in FY25, up ~7% from last year. But with a price-to-earnings (P/E) ratio of ~96x, the stock trades at a steep premium compared to peers, signaling that the market has high expectations for its future growth.
One of DMART’s biggest strengths is its minimal debt—the company operates with almost zero leverage, giving it exceptional financial flexibility. It also generates healthy free cash flows from its core retail operations, though its online grocery venture (DMart Ready) is still in the investment phase, posting losses as it expands.
From a valuation standpoint, DMART is expensive, no doubt. But investors are paying for its scalability, low-risk model, and disciplined management. With 415 stores across India and consistent quarterly additions, the company continues to grow organically while maintaining a lean balance sheet.
🔔 Bottom Line for Beginners: DMART is a financially strong and well-managed company with proven business fundamentals. But with a very high valuation and slowing profit growth, new investors should be cautious. It may be wise to watch for better entry points or wait for earnings to catch up with the price. For long-term investors with patience and a high-quality bias, it could still be a worthy contender—especially if margins and digital growth improve.
________________________________________
📈 DMART Chart Study – Educational Swing Trade Example:
Disclaimer: This is an educational post intended to help new traders understand breakout setups. This is not a recommendation to buy, sell, or hold any stock or security. Always consult your registered financial advisor before making any trading decisions.
If you're learning how swing trades work, this DMART daily chart setup from July 30, 2025, offers a great example of how price action, volume, and key levels can come together. It’s a practical case study to understand the breakout trading concept.
________________________________________
🛠️ Trade Structure (For Educational Purposes)
Reference Entry Price: ₹4,324.00
Reference Stop Loss: ₹3,925.85
Risk-Reward Scenario: Approx. 1:1, with potential extension to 1:2+ (based on hypothetical higher target)
________________________________________
🔍 Key Chart Observations:
✅ Breakout Candle Formation: A strong bullish candle closed near its high — a typical sign of price strength.
✅ Volume Confirmation: Volume surged to 3.39 million shares, which is over 4× the daily average — often seen in breakout moves.
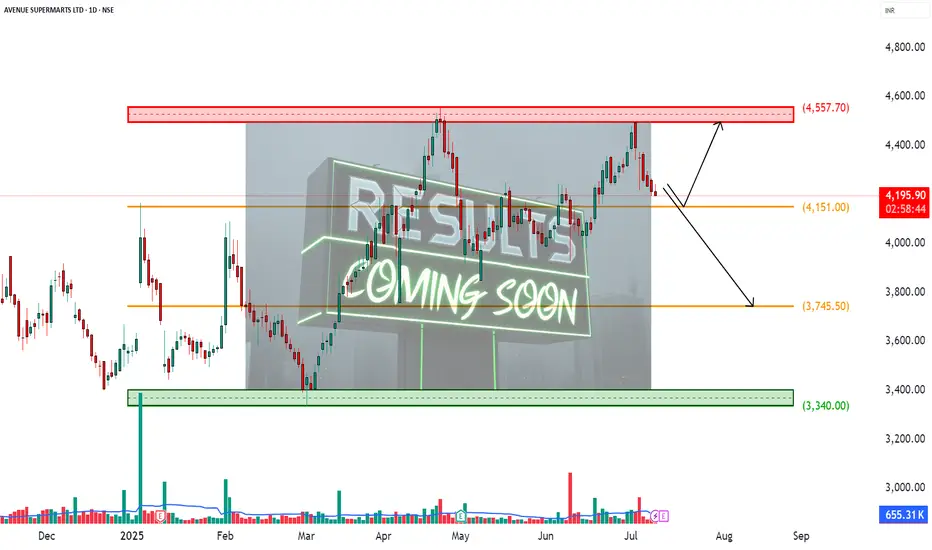
✅ Price Range Context:
• Support/Base Zone: Around ₹3,340
• Initial Target Zone: ₹4,557.70
________________________________________
📘 Educational Insights:
🔴 Risk-Reward Perspective: At the observed entry level, the risk-to-reward ratio was near 1:1 — not ideal for most strategies. A more efficient trade setup might occur on a pullback or with a more distant target.
🔄 Retest Possibility: If the price retraces to ₹4,150–₹4,200 with lower volume, that zone could serve as a reference for learners exploring re-entry setups (purely for study).
🧠 Capital Risk Planning: Risk management is crucial. Avoid risking more than 2–3% of total trading capital on any single idea, no matter how strong the pattern looks.
________________________________________
📌 Beginner Learning Point:
Breakout trading is more than just chasing big candles. A proper breakout setup usually involves volume surge, clear consolidation range, and defined risk management. Learning to combine these elements is key to developing trading discipline.
________________________________________
🧾 Why I’m Watching DMART — A STWP Perspective for Beginner Investors:
One of the best lessons I’ve learned in my investing journey is this: It’s better to buy a great business at a fair price than a fair business at a great price. And when I look at DMART (Avenue Supermarts Ltd.), I see the foundation of a truly great business — even if the price isn’t quite right just yet.
________________________________________
🛒 A Business Anyone Can Understand:
DMART isn’t chasing trends or building flashy tech. It’s focused on something much simpler — and far more reliable: selling everyday essentials. Groceries, home goods, basics — the things people need no matter what. And they do it efficiently, consistently, and affordably. That simplicity, when executed well, is a major strength.
________________________________________
🧱 A Strong, Repeatable Model:
What really impresses me is their cost discipline. DMART owns many of its stores, keeping rental costs low. They avoid unnecessary frills and instead focus on efficiency and tight operations. The result? A cost advantage that’s tough for others to beat. Even though retail has thin margins, DMART’s model is scalable, profitable, and built for the long haul.
________________________________________
👨💼 Led by a Trusted Name:
The company is backed by Radhakishan Damani — a man known for his patience, clarity, and capital discipline. He’s not in a rush to make headlines. He’s building something durable. And when you find great leadership combined with a focused business model, that’s a rare combo worth watching.
________________________________________
📉 Why This Stock Is on My Watchlist?
In one word: Valuation.
DMART often trades at 80–100 times earnings — which is expensive, even for a wonderful business. As an investor, I’d rather wait for a better deal than rush in and overpay. Great businesses can still turn into poor investments if you don’t get the price right. So for now, I’m staying patient.
________________________________________
📈 If the Price Comes Down…
If the market turns pessimistic or earnings grow into the valuation, DMART will be high on my buy list. Here’s why:
✅ A clean, debt-light balance sheet
✅ A brand people trust
✅ A scalable, cost-efficient model
✅ A long growth runway in India’s retail sector
✅ And thoughtful, no-drama leadership
________________________________________
🪙 Final Thought for New Investors:
As Warren Buffett says, “Time is the friend of the wonderful company and the enemy of the mediocre.”
DMART, in my view, is a wonderful company. I’d love to own it — but only when the price is right. Until then, I’ll keep watching, learning, and staying patient.
(Of course, one could consider buying a small quantity now and adding more on dips — a strategy that balances quality with prudence.)
________________________________________
⚠️ Disclaimer (Please Read Carefully):
This content is shared strictly for educational and research purposes only.
I am not a SEBI-registered investment advisor, and no buy or sell recommendations are being made.
All views expressed are based on personal market analysis and experience. They are not intended as financial advice.
Trading — especially in derivatives like options — involves significant financial risk. Losses can exceed your initial investment.
👉 Always do your own research and consult a certified SEBI-registered advisor before making any investment or trading decisions.
👉 Use proper risk management and only trade with capital you can afford to lose.
The author assumes no responsibility or liability for any trading losses incurred from acting on this content.
By engaging with this material, you agree to these terms.
________________________________________
💬 Found this helpful?
Drop your thoughts, questions, or insights in the comments below ⬇️ — let’s learn together!
🔁 Share this post with your trading friends and community — help them discover clean charts, structured setups, and zone-based learning.
✅ Follow @simpletradewithpatience for clear setups, educational content, and a no-nonsense approach to price action, supply-demand zones, and risk-managed trades.
🚀 Trade with patience. Trust your charts. Stay clear-headed.
Because the goal is not just to trade — it's to trade better.
Be Self-Reliant | Trade with Patience | Learn with Charts & Zones 📊
DMART - Reversal expected target 4420++Dmart double bottom formed now ready for 4420++ and more in August
Good bet buy 4400 AUG CALL near 25-29
TGT open
DMART – Earnings Incoming________________________________________________________________________________📈 DMART – Earnings Incoming: What’s the Right Time to Enter an Options Trade?
📆 Result Date: 11th July 2025 (Friday)
🕒 Strategy Style: Beginner + STWP HNI Learning Setup
🔍 For Educational Purposes Only
________________________________________________________________________________
🧠 What's the Setup?
DMART is announcing results on Friday, 11th July. We’re expecting a strong move — either up or down — because of mixed expectations around revenue and margins.
When you trade options around results, timing your entry is just as important as selecting the right strikes.
Let’s simplify it ⬇️ ________________________________________________________________________________✅ Option 1: Enter on 10th July (Thursday, After 2 PM)
💡 This is the ideal time for most traders.
🟢 Better option prices (not too inflated yet)
🟢 Good liquidity for smooth entry
🟢 Gives you overnight time to plan
🟢 You avoid the Friday panic crowd
🎯 STWP Suggested Strategy:
Buy 4300 CE + 4100 PE = ~₹180 total premium
This is called a Long Strangle – You win if the stock moves sharply up or down after results.
________________________________________________________________________________⚠️ Option 2: Enter on 11th July (Friday, Before 2 PM)
🔸 You might think, "Let me wait till Friday to get more clarity" — but there’s a catch:
❌ Option prices become expensive (high IV)
❌ Bid-ask spreads get wide (hard to enter)
❌ No time to react if results come intraday
❌ You’re stuck with weekend gap risk without prep
Unless you're experienced or scalping early, it’s not ideal for beginners.
________________________________________________________________________________🎯 Best Timing Rule – STWP Style:
📌 Enter on 10th July between 2:00 PM – 3:15 PM
Why?
You’ll lock in a clean setup with decent pricing and avoid stress.
📆 Exit Plan:
Hold through the weekend → Exit on Monday (14th July) if stock moves sharply 🔥
________________________________________________________________________________🧠 Alert:
Set alerts at:
₹4450 (Upside)
₹3950 (Downside)
If either hits on Monday, trail the winning side and exit the losing leg.
________________________________________________________________________________
📚 This is a learning example – not a trade recommendation.
Options carry risk. Please manage your capital and don’t trade blindly.
________________________________________________________________________________⚠️ Disclaimer (Please Read):
• This chart is shared for educational purposes only and is not investment advice.
• I am not a SEBI-registered advisor.
• The information provided here is based on personal market observation.
• No buy/sell recommendations are being made.
• Please do your own research or consult a registered financial advisor before making any trading decisions.
• Trading involves risk. Always use proper risk management.
________________________________________________________________________________