DMART Long Trade IdeaDMART is coming out of a double bottom breakout and likely to provide an excellent risk to reward opportunity for the next few weeks.
Trade ideas

DMARTI'll buy DMART at current levels for 6000 level target.
SL will be around 3900 DCB
positional trade.
not a trading recommendation.
#dmart

Classic double bottom in DmartThis has all ingredients needed for the double bottom.
A good downtrend since oct from 5600.
Existing earlier resistance at 3200.
Double bottoms at 3200 level
Break of neckline at 4050
Target 4850
SL 3800
Buy on dips.

DMART- Bulls Counter attackDMART- Bulls Counter attack. Price trending up as long as it sustains above 3902 on closing basis. Potential target - 4360

Avenue supermarket Bull runAvenue supermarket seems cup with handle breakout in daily concentrate
if price sustain above 4243 in 4hrs


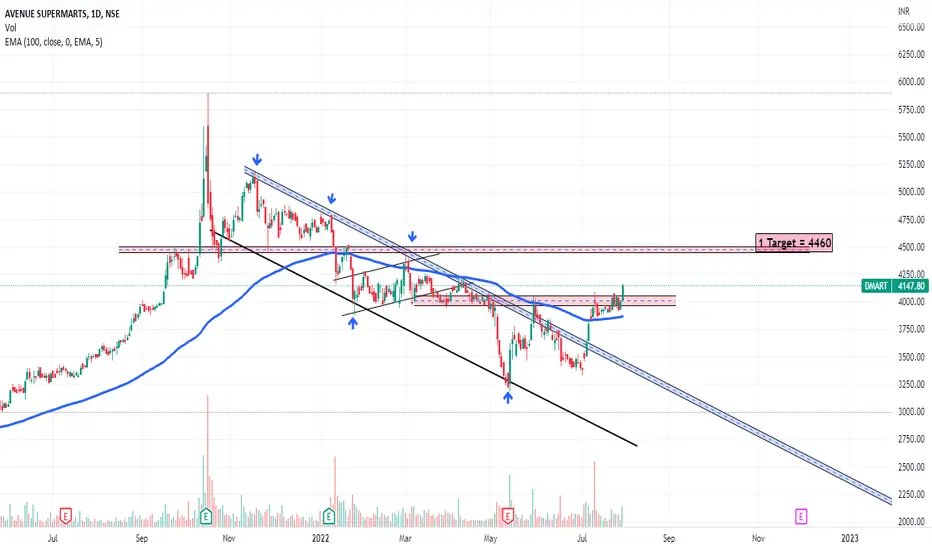
Value Entry In : DMARTNSE:DMART
Let see the price action = Double top pattern breakout happen ,it also look like cup & handle pattern over all good consolidation breakout.
1 target = 4460
fix your stop loss as per your R:R
let tell your opinion in comment section.
like & share...
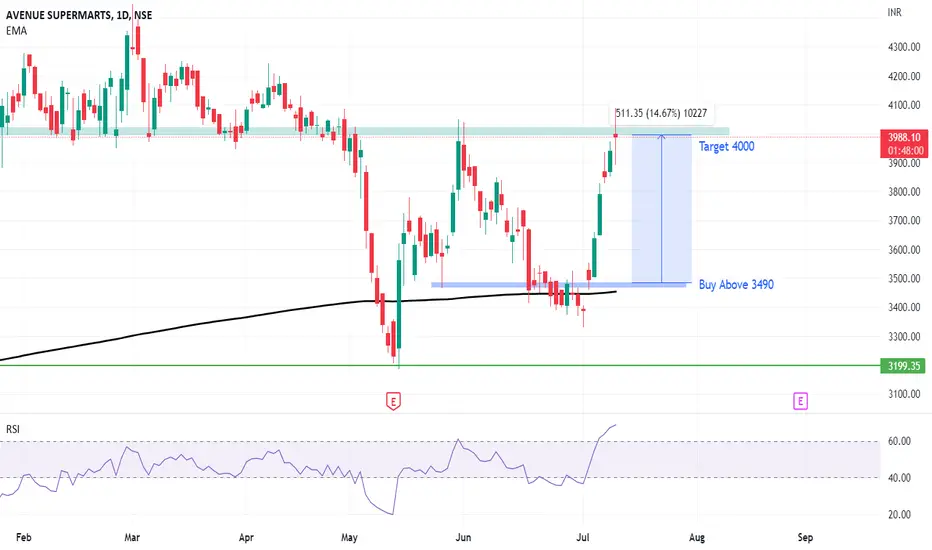
DMART trying to breakoutAs shown in chart, DMART is trying to breaking out of Support zone as well as moving above trend-line after some consolidation.

Dmart Cmp 4035 dated 21-7-2022Dmart Cmp 4035 dated 21-7-2022
1. Trendline BO @ 4055
Buy above 4055 for a tgt of 4110-4250-4390
SL 3950
It is just a view, pls trade at your own risk.

Dmart Longif close above 3950 it will be a good breakout
Dmart Long (21 July)
RSI- 64
Buy on close above- 3950
SL- 3880
Target- Open
Join us, Learn more, Earn more
Disclaimer- We are not SEBI registered advisor.
Charts and views are only for educational purpose.

Flagpole Pattern : DMART (Avenue Supermarts)NSE:DMART
DMART is forming one of the common Technical patterns in its Chart on a daily time frame.
The technical pattern here we are talking about is Flagpole.
A Flagpole is formed by strong movement in one direction creating the pole of the flag and a pennant shape by converging trendline causing the Flagpole structure complete.
This is a continuation pattern that indicates the price can continue in the same direction.
The Flagpole can occur either in falling or rising markets.
The volume spurts during the pole and consolidates during pennant structure and again raises if the breakout occurs.

LEVELS TO WATCH ON DMARTNSE:DMART
This is an short term trade .
The stock is at major resistances zone .
Onces it breaks the next target is in upside 4450 and in down side is the support zone 3700.
This is for educational purpose.

accumulate NSE:DMART
Hourly time frame is more accumulated nearby resistance zone.
With volume visibility at any time can go for a long position.
Thanks...

Double Bottom Breakout at Dmart#doublebottom #pattern #Breakout (trend reversal) at #Dmart (Avenue Supermarts Ltd) weekly chart. Soon #Dmart Start to #Outperformed #Nifty.
What Is a Double Bottom?
A double bottom pattern is a technical analysis charting pattern that describes a change in trend and a momentum reversal from prior leading price action. It describes the drop of a stock or index, a rebound, another drop to the same or similar level as the original drop, and finally another rebound. The double bottom looks like the letter "W". The twice-touched low is considered a support level.
ONLY FOR #educational
NOT SEBI REGISTERED. #LEARNEARN (DONT TRUST ANYONE)
#nifty50 #sharemarket #BREAKOUTSTOCKS #Multibagger #sharemarket #sharemarketindia #sensex #technicalanalysis #kukiinvest #Chartanalysis #headandshoulders #doubletop #doublebottom #parallelchannel #relativestrength

DMART Dmart :- Avenue supermart..
Broken its downward trendline
Formed a double bottom
disclaimer :- this is for demonstration and educational purpose only. this is not buying and selling recommendation

Dmart long opportunityNSE:DMART
Stock -> Dmart
TimeFrame -> Weekly
Hello all!
Dmart has been consolidating in a flag structure since October 2021, thus forming a flag and pole pattern. It finally broke out of it with good volumes last week. This makes for a good opportunity to go long.
There are multiple reasons which strengthen my conviction on going long:
1) The stock has bounced back from 3200 levels which is a good support.
2) The weekly closing is above 50 EMA.
3) The breakout has happened with good volumes.
Risk-averse traders can wait for the stock to sustain above 4000 on a daily timeFrame for going long, although accumulation in small quantities can be done.
*NOT A CALL*


Dmartstock following trend line ressistance again and again.
macd show reversal and rsi already going down.
wait for horizontal support.

DmartWait for reversal either upside or down side. On trendline support is best value in price to buy.

Dmart Ready for the Bear If Breaks Then The Targets can be Taken at 3339 and 3187 .
Time Frame :- 1 Hour
Patterns Name :- Triangle
Symbol Name :- Dmart
Based on Your Own Risk this is only to Show you the Current Pattern .
We are not responsible for any profit or loss .
BTW Like and Follow if you like this awesome content

swing level for DMART dt 18-5-22with reference to chart analysis posted on 7th may 2022 DMART movement is going as per levels breaking the distribution zone and then touching our marked levels exactly and then reverse. We can expect 3950 to 3967 level in comming days. I am not a SEBI registered investment advisor . Please consult your financial advisor before taking any investment decision.

dmart @ long term supportdmart is trading at at strog support zone which is supported by trend line and 50% retracement of fibonnaci from ATH to ATL. i.e 3242
3250 is the good zone to buy, also dmart is down by 45% from all time high
