Trade ideas


DMART Positional -W Pattern Breakout & Pullback to Breakout zonePrice has given a W pattern breakout and pullback to breakout/Support zone & 9 Week EMA, can be added at cmp and dips upto 2550 for target arnd 3000, view gets negated below 2450 on weekly closing basis.
On daily time frame price can give a trendline breakout above 2716 levels for initial target 2750.
VIEWS FOR LEARNING PURPOSE ONLY


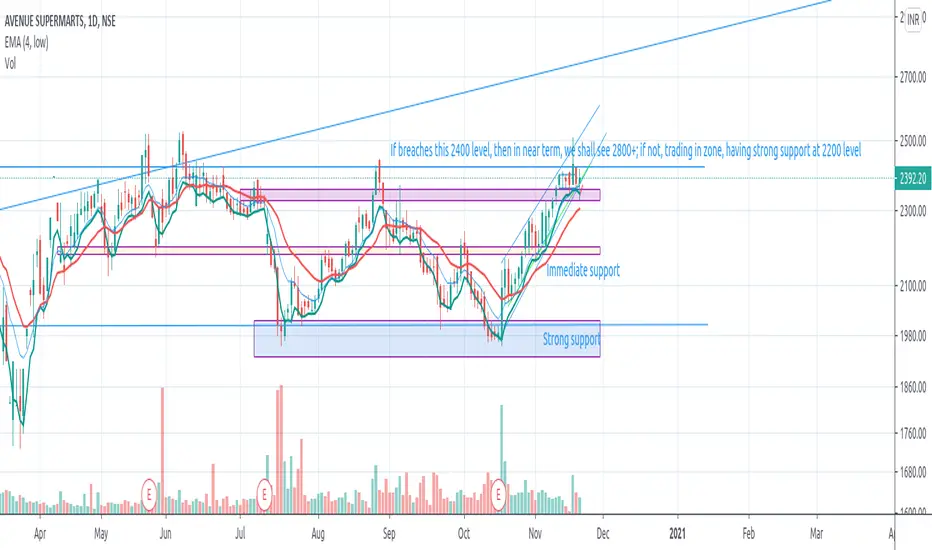
DMART_In ZoneIf breaches 2400, then 2800+ level is possible (if not, moving in zone)
near support at 2200
strong support at 2000
Only educational purpose
DMART ANALYSIS 28.12.2020BUY 2673 TO 2580
ONCE IF IT CLOSE ABOVE 2690 WITH STRONG BULL CANDLE MEANS TARGET UPTO 2873 AND 2946
REASON FOR BUYING:
IN WEELY AFTER THE SIEDAY WAYS IT HAS BREAK THE RESISTANCE LINE IT SHOWS POSTIVE TREAND AND IT HAS ALSO RETESTED.
IN WEEKLY TARGET UP TO 3269 .


Positional Short CandidateD mart is a positional short candidate but unfortunately its not in F&O .Could wait for new entry.
Levels are on chart


Dmart making newer ATH levels Dmart took a beautiful support at the previously broken strong resistance level and continued its up move. Further move is expected. Visit previous chart in the link below. For educational purpose.


Watchlist Update: Dmart ascending triangle probable breakout.-Look out for Volume when breaking out!
-There are two separate possibilities of trade represented by two arrows after breakout at 2700.
-Target is set through ATR.
-Risk Reward is 3.078
-Happy Trading :)


Strongest stock - DMART (Rejection day)Buy At 2588-2600 range for an excellent entry.
SL - Exit if stock close below 2580, since it will definetely test the low's of the rejection candle.
Reason for the trade: Rejection day
Rejection Days have a range that is significantly larger than the 10-day average and The ideal swing entry is the Rejection Day midpoint,which can be defended for 1-4 days after the rejection.
Exit when : A daily close below the Rejection Day midpoint breaks the pattern, as this would indicate a retest of the Rejection Day low
Disclaimer : Author may enter in trade so take your own decision. This is an trading idea not an trading or Investment advice.


Buy DmartBuy Dmart Near Cmp 2556 or add more near 2550 level ..Stoploss 2200 Target 3030
Risk to Reward 1.70
Study: Stock is trading near Retesting level of Previous Breakout level..
