DOMS is in a bullish continuation setupDOMS Industries is offering a clean range‑breakout swing setup with defined supports and two upside objectives, suitable for a 2–6 week holding period if momentum sustains
Setup overview
Structure: Stock is trading above primary support ₹2,488 and secondary support ₹2,430, consolidating just below the resistance band around ₹2,640–2,650 on the daily chart.
Bias: As long as price holds above ₹2,430, the broader post‑IPO uptrend and recent higher‑low structure remain intact, favouring a bullish breakout continuation play.
Trade plan (conservative breakout)
Entry: Buy on a daily close above ₹2,646 with strong volume (resistance breakout confirmation).
Stop-loss: ₹2,488 on a closing basis (below primary support and recent swing lows).
Targets:
Target 1: ₹2,765 (primary target / mid‑range supply).
Target 2: ₹2,890 (full target just below previous higher band).
Reward–risk: From ₹2,646 entry, downside to SL ≈ ₹160 (~6%), upside to T1 ≈ ₹120 (~4.5%) and to T2 ≈ ₹245 (~9%), so partial booking at T1 and running balance to T2 keeps effective R:R attractive.
Alternate plan (buy on dip to support)
Entry zone: ₹2,500–2,520 near current price if the stock pulls back intraday while still closing above ₹2,488.
Stop-loss: ₹2,430 closing basis (secondary support).
Targets: Same T1 ₹2,646, then ₹2,765 and ₹2,890; once T1 is hit, trail SL to just below ₹2,580 and then below each higher swing low.
So, the fundamental picture (24% revenue growth, ~₹240–250 crore PAT run‑rate) supports taking trades towards ₹2,765–2,890, but the 60–70x PE band argues for: smaller position size, strict SL at ₹2,430–2,488, and systematic profit‑taking as price climbs through your targets.
Disclaimer: aliceblueonline.com
DOMS Industries Limited
No trades
What traders are saying

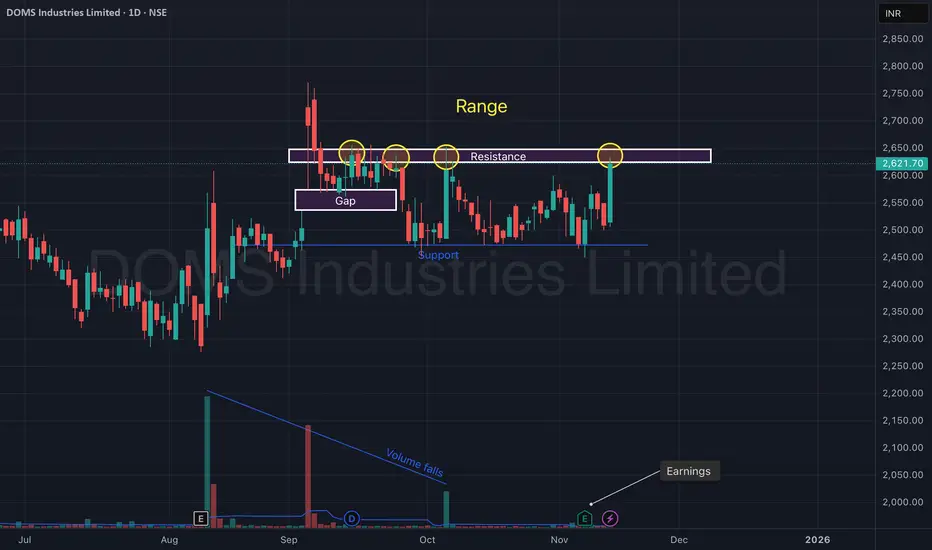
DOMS Industries Ltd – Range Breakout Attempt After Earnings.DOMS Industries continues to trade inside a well-defined range structure, with price repeatedly rejecting the ₹2,630–₹2,660 resistance zone. The recent strong bullish candle toward the upper boundary, combined with improving sentiment after earnings, signals a potential breakout attempt.
A clear gap zone retest around ₹2,520–₹2,550 provided a solid base. Support at ₹2,450 has held cleanly multiple times, validating the lower boundary of the range.
With volume slowly recovering from its multi-week decline and price pressing into resistance again, DOMS is approaching a decisive move.
🎯 Key Technical Levels
CMP: ₹2,621.70 (+4.49%)
Resistance Zone: ₹2,630 – ₹2,660 (Range high)
Gap Support: ₹2,520 – ₹2,550
Major Support: ₹2,450
Breakout Levels to Watch: Close above ₹2,660 with strong volume
📈 Technical View
Price is respecting a horizontal range for several weeks.
Repeated rejections highlighted by circles show strong supply near ₹2,650.
Gap zone acted as demand, helping price bounce back toward resistance.
Volume trend has been falling, suggesting participation has been subdued — a pickup in volume during any breakout would be critical.
Structure stays bullish above ₹2,520; bearish only if price closes below ₹2,450.
📊 Latest Earnings Snapshot
DOMS continues to deliver strong quarterly performance, supporting the technical setup:
Q2 FY26 (Sep 2025):
Net Profit: ~₹55.8 Cr
YoY Profit Growth: ~16%
Q1 FY26:
Revenue: ₹508.7 Cr (↑ ~26% YoY)
PAT: ~₹59.1 Cr (↑ ~8.8% YoY)
Consistent earnings growth strengthens the medium-term outlook and boosts confidence in a potential range breakout.
🧠 View
DOMS is back at its major resistance zone after a clean bounce from the gap support. A strong-volume breakout above ₹2,660 can trigger a momentum extension toward fresh highs, while ₹2,520 and ₹2,450 remain key demand zones to watch.
DOMS – Multi-Month Triangle Breakout |________________________________________
💹 DOMS Industries Ltd (NSE: DOMS)
Sector: Consumer & Stationery Products | CMP: 2621.70 |
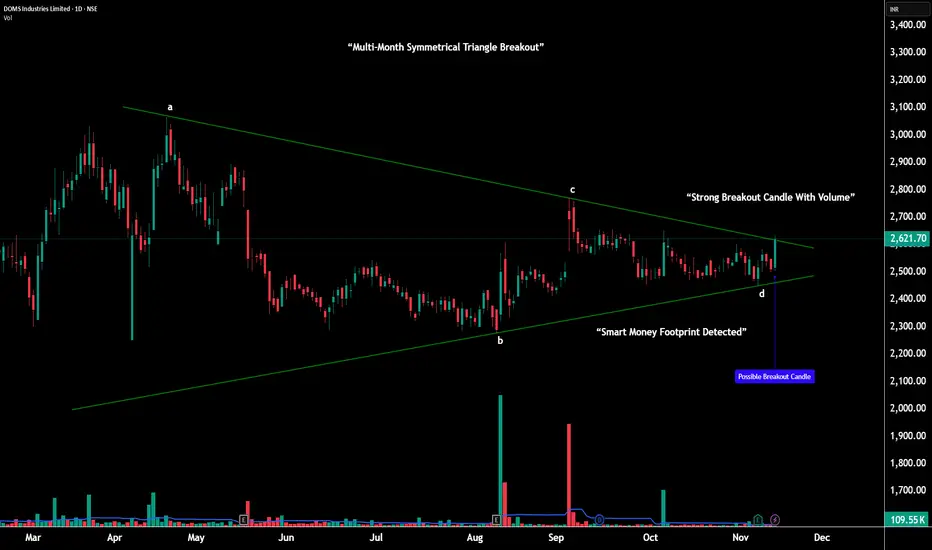
View: Multi-Month Symmetrical Triangle Breakout With Expanding Momentum
________________________________________
📊 Price Action:
DOMS has spent the last five months forming a large symmetrical triangle — a volatility contraction structure marked by steady lower highs and higher lows from points A–B–C–D.
Throughout this period, buyers consistently defended the broader 2470–2500 demand belt, while sellers lost strength on every push lower.
This slow tightening shows how the market was preparing for a decisive move.
In the latest session, DOMS finally broke above the upper trendline, backed by a strong bullish range candle and a clear rise in volume, confirming the start of a fresh expansion phase.
________________________________________
📉 Chart Pattern Analysis – Large A–B–C–D Symmetrical Triangle:
This multi-month structure represents a major volatility compression following a previous uptrend — a classic continuation setup.
Point A: First major lower high
Point B: Deep anchor low
Point C: Lower high confirming supply weakening
Point D: Higher low showing demand strengthening
This clean A–B–C–D formation validates the symmetrical triangle perfectly.
As price approached the apex, volatility dried up, volume decreased, and the range narrowed — all ideal ingredients for a strong breakout.
The breakout candle now signals the end of compression and beginning of trend expansion.
________________________________________
📈 STWP Trading Analysis:
Bullish Breakout Zone: 2621.70 – 2633.20 | Stop Loss: 2498.60
The breakout candle shows high momentum and elevated volume, signaling institutional activity. Price has reclaimed all key moving averages with trend strength visible across 1H–1D–1W timeframes. As long as DOMS holds above the 2570–2590 structure zone, the bullish continuation bias remains active. Upside resistance levels can be used as potential levels of partial profit-taking, momentum checkpoints, and trend continuation targets.
________________________________________
🕯️ Candlestick Structure – Strong Bullish Breakout Candle:
The latest session printed a wide-range bullish candle, breaking through the upper triangle boundary decisively.
This type of candle — strong body, controlled wicks, clean range expansion — reflects conviction buying, not speculative spikes.
When this appears at the apex of a large compression pattern, it often marks the start of a new trending phase.
________________________________________
📏 Fibonacci Analysis:
Measured from swing low 2275.40 to swing high 2585.70:
38.2% @ 2393 → Secondary support
50% @ 2430 → Balanced support zone
61.8% @ 2467 → Strong golden zone (defended repeatedly)
The rebound from the 61.8% area aligns with the D-point of the triangle — reinforcing the structural validity and strengthening the breakout.
________________________________________
🧭 STWP Support & Resistance:
Resistances: 2667 | 2713 | 2794
Supports: 2540 | 2459 | 2413
The 2470–2500 region remains a major demand base, where the stock formed its higher lows at point D.
Immediate supply lies near 2667–2713, the first test zone after the breakout.
________________________________________
📊 STWP Volume & Technical Setup:
Volume climbed to 109.55K, significantly higher than recent averages — showing accumulation on the breakout.
RSI at 59 and Stochastic at 67 suggest healthy momentum with room for continuation.
MACD structure remains bullish, and multi-timeframe trend strength is intact.
Trend Direction: UPTREND | Volume Confirmation: Strong Buying Activity
________________________________________
🧩 STWP Summary View:
Momentum: Strong
Trend: Bullish
Risk: Moderate
Volume: High
DOMS has broken out of a large multi-month symmetrical triangle, a pattern known for initiating strong directional moves once volatility expands.
The structure remains bullish above 2570–2590, with continuation potential toward 2667 → 2713 → 2794 in the coming sessions.
________________________________________
⚠️ Disclosure & Disclaimer – Please Read Carefully
This analysis is for educational purposes only and should not be treated as investment advice.
I am not a SEBI-registered financial advisor.
Trading carries risk — use stop-loss, risk limits, and disciplined position sizing.
Please consult a SEBI-registered adviser before making trading decisions.
________________________________________
Position Status: No active position in (DOMS) at the time of this analysis.
Data Source: TradingView & NSE India
________________________________________
💬 Found this useful?
🔼 Boost this post to help more traders learn structured analysis
💭 Share your thoughts — does this breakout hold the strength for trend expansion?
🔁 Share with traders who study breakout structures
👉 Follow for more clean, price-action-driven institutional breakdowns
🚀 Stay Calm. Stay Clean. Trade With Patience.
Trade Smart | Learn Zones | Be Self-Reliant 📊
________________________________________
DOMS INDUSTRIES ON VERGE OF TRENDLINE BREAKOUT.DOMS INDUSTRIES may break trendline to move further up.
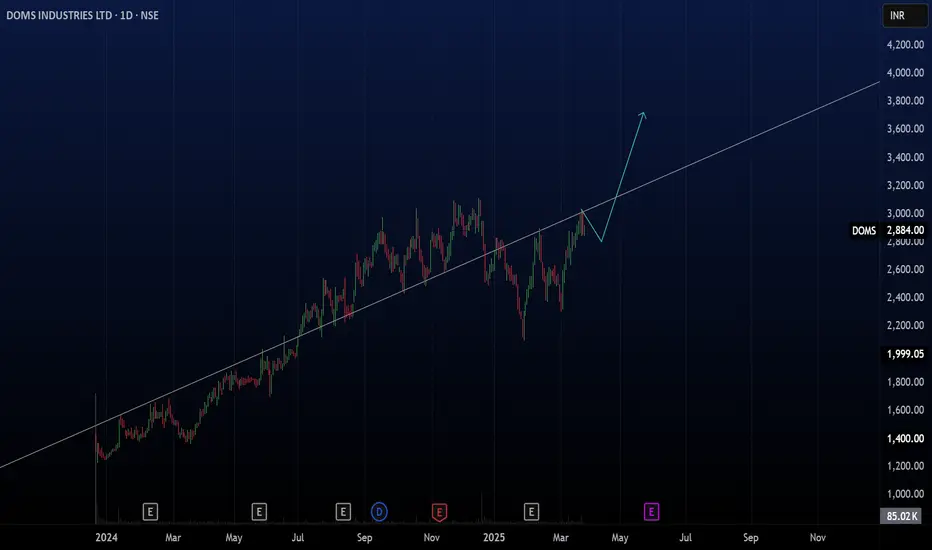
DOMS - ABCD Pattern, Crossing Swing Highs.NSE:DOMS Crossing Swing Highs with Strong Candles With RSI and MACD Trending Upwards and according to ABCD Pattern it's Likely to Cross ATH in Short Term.
About:
Incorporated in 2006, NSE:DOMS is a stationery and art product company primarily engaged in designing, developing, manufacturing, and selling a wide range of these products under the flagship brand, NSE:DOMS is the 2nd largest player in India’s branded 'stationery and art' products market. It held 29% and 30% market share for its core products in FY23 for pencils and mathematical instrument boxes.
Trade Setup:
A Swing Trade Can be Done as per the ABCD Pattern and Bullish Price Action. Keep Position Size as Per Appetite.
Target (Take Profit):
Near ATH Levels of 3115
Stop Loss:
Entry Candle Low for Aggressive Swing Traders and Swing Low in General.
📌Thank you for exploring my idea! I hope you found it valuable.
🙏FLLOW for more
👍BOOST if useful
✍️COMMENT Below your views.
Meanwhile, check out my other stock ideas on the right side until this trade is activated. I would love your feedback.
Disclaimer: "I am not SEBI REGISTERED RESEARCH ANALYST AND INVESTMENT ADVISER."
This analysis is intended solely for informational and educational purposes only and should not be interpreted as financial advice. It is advisable to consult a qualified financial advisor or conduct thorough research before making investment decisions.

DOMS - MAKE OR BREAK ????? Doms at crucial level. Any breakout and closing above 2840 will be a good long opportunity towards 3100
Disclaimer: All information give is for educational purposes. Please consult your financial advisor before investing.
If you like such content please subscribe and share it with your Trader Friends or Family Members.
For more such content. Stay Tuned.

RECTANGLE PATTERN- DOMSDoms Industries has formed the Rectangle Pattern.
Previous resistance turned into the support. Now it has formed new resistance and now trying to take rest near high. If it breaches the trendline with good volume, shall go long.
Let us see.

Doms BreakoutChart -> Doms Daily
CMP: 3070
Good Range to Buy: 2975 to 3075
Targets: 3200, 3300, 3400
SL: 2900 Daily Close
Disclaimer: This is for educational purposes only, not any recommendations to buy or sell. As I am not SEBI registered, please consult your financial advisor before taking any action.

Doms at a channel support.
#Doms at a channel support. Watch the levels.
The market is fragile keep that in mind.
CMP: 2727.45
The chart shared is just for educational purposes.

Postional setup for next week Stock in uptrend with potential to give short term move. Be ready to play for 12 % return with 6 % SL happy trading.

Doms - Breakout-RetestDoms :
Resistance breakout done and currently retesting and doji formation at support, might bounce back

DOMS
Prices have taken support at the 50 Day EMA along with the Daily RSI bouncing from its Oversold level.
Price correction of 18% is also in line with its past corrections.
Hence stock is expected to continue its on-going up-move to form a new high in 3300-3500 zone.
Bullish outlook would remain intact as long as price is above 2400.

Doms Industries Ltd| Long Term Momentum InvesmentIncorporated in 2006, DOMS Industries Limited is a stationery and art product company primarily engaged in designing, developing, manufacturing, and selling a wide range of these products under the flagship brand, DOMS
Financial:
Market Cap ₹ 10,224 Current Price ₹ 1,685 Stock P/E 107
ROCE 34.4 % ROE 32.8 % Debt to equity 0.41
Promoter holding 75.0 % Quick ratio 0.41 Current ratio 1.22
Piotroski score 8.00 Profit Var 3Yrs 38.5 % Sales growth 3Years 22.8 %
Return on assets 18.1 %
This stock is momentum strong stock as well as everyone knows about this company . This is going to wealth creator in long time . as per my view this is hold and patient for long term if run in our favor.
Note: I am not SEBI registered financial Adviser. I solely present my views on chart .I do not charge any kind of service. This is not buy sell recommendation.
If you like my ideas than like boost and follow me for more ideas.
Thanks and feel free to comment.

Watchlist-DOMS--IPO base breakout
--consolidation near breakout region
--Enter after the breakout with good volume
--Target 1800/2000
Disclaimer:
- The view expressed here is my personal view
- Any decision you take, you need to take responsibility for the same
- It's your hard earned money. Treat it wisely
- Trade / Invest keeping in mind your trading style, goals and objectives, time horizon & risk tolerance
-- Do your own analysis and consult your financial adviser if needed

BUY TODAY SELL TOMORROW for 5%DON’T HAVE TIME TO MANAGE YOUR TRADES?
- Take BTST trades at 3:25 pm every day
- Try to exit by taking 4-7% profit of each trade
- SL can also be maintained as closing below the low of the breakout candle
Now, why do I prefer BTST over swing trades? The primary reason is that I have observed that 90% of the stocks give most of the movement in just 1-2 days and the rest of the time they either consolidate or fall
Trendline Breakout in DOMS
BUY TODAY SELL TOMORROW for 5%

DOMSBased on price moving and Ema
positions Up move possibility is higher
This is only for educational purposes.

DOMSThis stock up move as per the below prediction
1.21 Ema above 50 Ema
2.50 Ema above 200 Ema
3.Price above 21 EMA
4.21 Ema retrace
5.Stock in unmoved
5.ROCE >15
6.Debt to equity<1
This is for the educational purposes

DOMS Industries Ltd - LONG TERM STOCKLTP 1450.00
Buy on dips & Hold for Long
Overview
DOMS Industries Limited, as we know it today, traces its lineage back to over 4 decades, with the formation of a partnership firm, ‘R.R. Industries’ by our founders, Late Shri Rasiklal Amritlal Raveshia and Late Shri Mansukhlal Jamnadas Rajani, which over the years undertook the business of manufacturing and sale of scholastic stationery; scholastic art material; paper stationery; kits and combos; office supplies; hobby and craft; and fine art products.
Co. is the 2nd largest player in India’s branded ‘stationery and art’ products market. It held 29% and 30% market share, respectively, in FY23 for its core products for pencils and mathematical instrument boxes.
Product-wise Revenue Bifurcation - FY23
Scholastic stationery - 47%
Scholastic art material - 24%
Paper stationery - 10.5%
Kits and Combos - 10.5%
Other products - 8%
Geographical Revenue Bifurcation
Exports - 79% in FY23 vs 76% in FY22
Domestic - 21% in FY23 vs 24% in FY22
I've Posted a detailed Video on it
Robust Growth
We launched our flagship brand, “DOMS” in 2005, which has taken large strides in revolutionising the Indian ‘stationery and art material’ industry. This was followed by a strategic partnership with a listed Italian multinational company, engaged in the supply of various ‘art materials’ and ‘stationery products’, with a global presence, F.I.L.A. – Fabbrica Italiana Lapis ed Affini S.p.A (F.I.L.A.), Italy, in 2012, which has enabled us to gain access to international markets for distribution of our products, augmentation of our R&D and technological capabilities. Later, we acquired Pioneer Stationery Private Limited, a company engaged in the business of manufacturing, selling, marketing and distribution of paper stationery products. In 2023, we acquired a minority stake in ClapJoy Innovations Private Limited, which is in the business of manufacturing and sale of ‘toys’. This acquisition is in line with our objective to increase the breadth of our product offering by entering categories that are associated through the growing years of kids, children and young adults. Further, in the year 2023, we acquired a majority stake in Micro Wood Private Limited, which is in the business of manufacturing tin and paper based packing material. This acquisition is in line with our Company’s strategy in achieving greater degree of backward integration for manufacturing.
Our manufacturing facilities are located in Umbergaon, Gujarat and Jammu & Kashmir, India. The Company’s Manufacturing activities are spread across 1.07 million square feet of built-up-area. Further, to accommodate its immediate growth plan, the Company intends to streamline its operations and enhance its manufacturing capacity for writing instrument products by adding approximately 0.20 million square feet to its Umbergaon Manufacturing Facilities.
In Jammu, current production facilities are spread across 0.07 million square feet of build-up area focused at producing wooden slats from locally sourced wood.
The Indian government has implemented several initiatives to increase the literacy rate
Some of the prominent ones are:
Samagra Shiksha Scheme
The Sarva Shiksha Abhiyan
The Rashtriya Madhyamik Shiksha Abhiyan
Pradhan Mantri Poshan Shakti Nirman Scheme
National Education Policy 2020:
National Scholarship Portal (NSP)
Digital India
Macro-Economic and Overview – Gross Enrolment Ratio of key global countries – across level of education (Primary Education (Class 1st to 5th); Upper Primary Education (Class 6th to 8th); Secondary Education (Class 9th & 10th) and Secondary Education (Class 11th & 12th) Gross Enrolment Ratio (GER) is an important tool for policymakers and educators, as it provides valuable information on access to education and helps to identify areas where improvements are needed. GER is a measure in education that calculates the percentage of students enrolled in a particular level of education (irrespective of age) compared to the total population of that age group. India’s GER for primary school education has grown from 98% to 103% between FY 18 and FY 22. Among the major economies of the world, the GER for China and India has shown growth between CY 17 to CY 21, whereas the GER of countries like USA and Germany has dropped from 104% to 103%, 105% to 101% for the respective countries.
Don't miss to Like / Comment & Share
For more info - Plz visit my Profile
Rgds,
Naresh G
Sebi Reg. RA

DOMS IND CHART ANALYSIS 1.Moving averages
- 21 Ema above 50
-50 Ema above 200
-Gap between Ema seems better
2.uptrend continues observed
3.Good pivot levels
