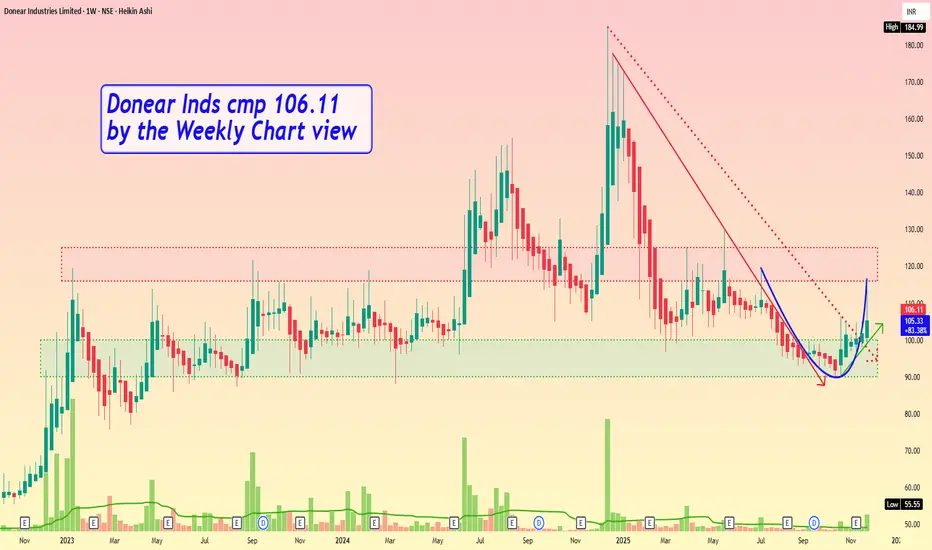
Donear Inds cmp 106.11 by the Weekly Chart viewDonear Inds cmp 106.11 by the Weekly Chart view
- Support Zone 90 to 100 Price Band
- Resistance Zone 116 to 125 Price Band
- Price shouldering along the Rising Support Trendline
- Breakout from Falling Resistance Trendline well sustained
- Bullish Rounding Bottom done by Resistance Zone neckline
Donear Industries Limited
No trades
6.48 INR
318.68 M INR
9.09 B INR
12.14 M
About Donear Industries Limited
Sector
Industry
CEO
Rajendra Vishwanath Agarwal
Website
Headquarters
Mumbai
Founded
1987
Identifiers
2
ISININE668D01028
Donear Industries Ltd. engages in the manufacturing and sale of textiles. It operates through two segments: Manufacturing and Dealing in Textiles and Rentals Property. Its products include suiting, trousers and shirting fabrics. The company was founded by Vishwanath Laxminarayan Agarwal in 1987 and is headquartered in Mumbai, India.
Related stocks
DONEAR - Weekly AnalysisIn the Weekly Chart of DONEAR ,
we can see that, it is at decision making point.
Possible momentums are shown in chart.
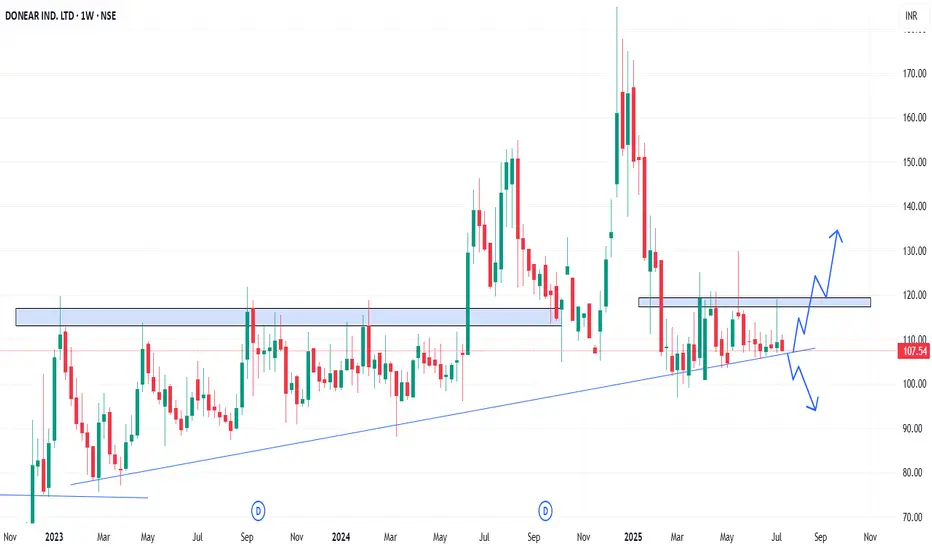
DONEARMoving in the parallel lines. Currently near Demand / Support Zone. Expecting to reach the target / resistance. SL your own.

DONEAR - Swing trade analysis - 16th JulySWING TRADE
DONEAR Looking good for upside
CMP 125.93
Buy around current levels
Target 140

DONEAR - ONLY FOR WATCHLIST Using weekly chart to show complete picture.
(Review daily chart for re-confirmation)
Several attempt was made to cross 121/122 range..
10th June : Stock again toughed the same but close below
11th June : Open above resistance (123) made day high of 130
(Gave away entire day end gain to close at

#Donear BO at 119#Donear Industries
Ltd manufactures Textiles and deals in
Rental Property. CMP 135. Price moved abv the 120 after 74 weeks and retested it before moving again. Fundamentally PEG at 1.03 and shown good sales growth in last 3 years. Only concern is growing debt. If same growth trajectory remains then

Donear - Breakout after long consolidation. Best Buy above 145Donear - After Two times rejection at around 120, the stock has given breakout.
One can enter at current price and some around 122 for Targets of 140/178
Strict Stop loss of Rs-100
Disclaimer : Educational Content. Do your own research.

Donear Industries : 42% to 583% Upside Potential#Donear Industries : 21 Jun 2024
"Life is Simple, we make it complicated, So is Trading.
Discover Simple, Yet POWERFUL IDEAS."
In Play : HH : HL
Summary
• CMP : 138.72
• Clean Price Action with Vol favor's BULLS FOOT PRINT
• Nice CONSOLIDATION of around 17 months
• Trading right ABOVE VP mountain

DONEAR INDUSTRIES seems bullishBreak out after 18 months. 121 may be act as SL for investors on daily close basis.

DONEAR INDUSTRIES BULLISH BREAKOUTIts a bullish breakout with huge volume.Its a up flag and good consolidation of flag pattern breakout. target will hit within 33 trading days.

See all ideas
Summarizing what the indicators are suggesting.
Oscillators
Neutral
SellBuy
Strong sellStrong buy
Strong sellSellNeutralBuyStrong buy
Oscillators
Neutral
SellBuy
Strong sellStrong buy
Strong sellSellNeutralBuyStrong buy
Summary
Neutral
SellBuy
Strong sellStrong buy
Strong sellSellNeutralBuyStrong buy
Summary
Neutral
SellBuy
Strong sellStrong buy
Strong sellSellNeutralBuyStrong buy
Summary
Neutral
SellBuy
Strong sellStrong buy
Strong sellSellNeutralBuyStrong buy
Moving Averages
Neutral
SellBuy
Strong sellStrong buy
Strong sellSellNeutralBuyStrong buy
Moving Averages
Neutral
SellBuy
Strong sellStrong buy
Strong sellSellNeutralBuyStrong buy
Displays a symbol's price movements over previous years to identify recurring trends.
Frequently Asked Questions
The current price of DONEAR is 95.35 INR — it has decreased by −1.65% in the past 24 hours. Watch Donear Industries Limited stock price performance more closely on the chart.
Depending on the exchange, the stock ticker may vary. For instance, on NSE exchange Donear Industries Limited stocks are traded under the ticker DONEAR.
DONEAR stock has fallen by −3.60% compared to the previous week, the month change is a −5.31% fall, over the last year Donear Industries Limited has showed a −42.49% decrease.
DONEAR reached its all-time high on Jan 31, 2007 with the price of 241.00 INR, and its all-time low was 8.65 INR and was reached on Mar 3, 2014. View more price dynamics on DONEAR chart.
See other stocks reaching their highest and lowest prices.
See other stocks reaching their highest and lowest prices.
DONEAR stock is 3.30% volatile and has beta coefficient of 1.18. Track Donear Industries Limited stock price on the chart and check out the list of the most volatile stocks — is Donear Industries Limited there?
Today Donear Industries Limited has the market capitalization of 5.06 B, it has decreased by −2.74% over the last week.
Yes, you can track Donear Industries Limited financials in yearly and quarterly reports right on TradingView.
DONEAR net income for the last quarter is 123.89 M INR, while the quarter before that showed 88.06 M INR of net income which accounts for 40.70% change. Track more Donear Industries Limited financial stats to get the full picture.
Yes, DONEAR dividends are paid annually. The last dividend per share was 0.20 INR. As of today, Dividend Yield (TTM)% is 0.21%. Tracking Donear Industries Limited dividends might help you take more informed decisions.
Donear Industries Limited dividend yield was 0.19% in 2024, and payout ratio reached 3.26%. The year before the numbers were 0.21% and 3.00% correspondingly. See high-dividend stocks and find more opportunities for your portfolio.
As of Dec 24, 2025, the company has 2.88 K employees. See our rating of the largest employees — is Donear Industries Limited on this list?
EBITDA measures a company's operating performance, its growth signifies an improvement in the efficiency of a company. Donear Industries Limited EBITDA is 918.37 M INR, and current EBITDA margin is 8.92%. See more stats in Donear Industries Limited financial statements.
Like other stocks, DONEAR shares are traded on stock exchanges, e.g. Nasdaq, Nyse, Euronext, and the easiest way to buy them is through an online stock broker. To do this, you need to open an account and follow a broker's procedures, then start trading. You can trade Donear Industries Limited stock right from TradingView charts — choose your broker and connect to your account.
Investing in stocks requires a comprehensive research: you should carefully study all the available data, e.g. company's financials, related news, and its technical analysis. So Donear Industries Limited technincal analysis shows the strong sell today, and its 1 week rating is sell. Since market conditions are prone to changes, it's worth looking a bit further into the future — according to the 1 month rating Donear Industries Limited stock shows the neutral signal. See more of Donear Industries Limited technicals for a more comprehensive analysis.
If you're still not sure, try looking for inspiration in our curated watchlists.
If you're still not sure, try looking for inspiration in our curated watchlists.