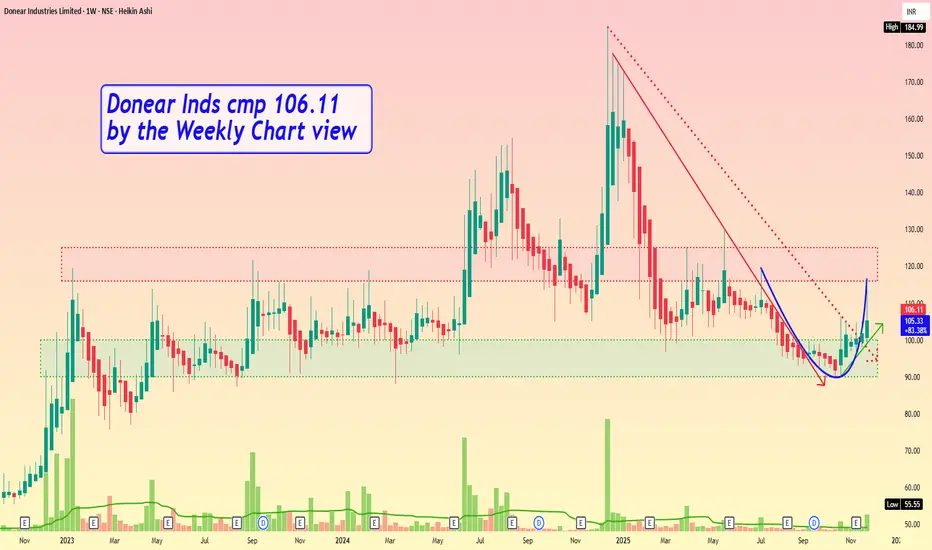
Donear Inds cmp 106.11 by the Weekly Chart viewDonear Inds cmp 106.11 by the Weekly Chart view
- Support Zone 90 to 100 Price Band
- Resistance Zone 116 to 125 Price Band
- Price shouldering along the Rising Support Trendline
- Breakout from Falling Resistance Trendline well sustained
- Bullish Rounding Bottom done by Resistance Zone neckline
- Support Zone tested retested prior to price moved to upscale
- Volumes are intermittently spiking heavily over past few weeks
Donear Industries Limited
No trades
Market insights
DONEAR - Weekly AnalysisIn the Weekly Chart of DONEAR ,
we can see that, it is at decision making point.
Possible momentums are shown in chart.
DONEARMoving in the parallel lines. Currently near Demand / Support Zone. Expecting to reach the target / resistance. SL your own.

DONEAR - Swing trade analysis - 16th JulySWING TRADE
DONEAR Looking good for upside
CMP 125.93
Buy around current levels
Target 140

DONEAR - ONLY FOR WATCHLIST Using weekly chart to show complete picture.
(Review daily chart for re-confirmation)
Several attempt was made to cross 121/122 range..
10th June : Stock again toughed the same but close below
11th June : Open above resistance (123) made day high of 130
(Gave away entire day end gain to close at 123 levels)
Positive : Still holding above 123
(THIS ANALYSIS IS JUST TO KEEP IT IN RADAR IF SHOW POSITIVE MOVE TOMORROW -- TARGET 150)

#Donear BO at 119#Donear Industries
Ltd manufactures Textiles and deals in
Rental Property. CMP 135. Price moved abv the 120 after 74 weeks and retested it before moving again. Fundamentally PEG at 1.03 and shown good sales growth in last 3 years. Only concern is growing debt. If same growth trajectory remains then hopefully debt can also be taken care of. Current D/E ratio is 1.65 which is high.

Donear - Breakout after long consolidation. Best Buy above 145Donear - After Two times rejection at around 120, the stock has given breakout.
One can enter at current price and some around 122 for Targets of 140/178
Strict Stop loss of Rs-100
Disclaimer : Educational Content. Do your own research.

Donear Industries : 42% to 583% Upside Potential#Donear Industries : 21 Jun 2024
"Life is Simple, we make it complicated, So is Trading.
Discover Simple, Yet POWERFUL IDEAS."
In Play : HH : HL
Summary
• CMP : 138.72
• Clean Price Action with Vol favor's BULLS FOOT PRINT
• Nice CONSOLIDATION of around 17 months
• Trading right ABOVE VP mountains
* BO with good volume
* ATH : 241
Conclusion
• CMP 138.72
• Looks good for going NORTH
• Higher Levels could be around
o Imm Higher Levels : 187
o Potential Levels : 352/597/785/944
Wish You Happy & safe trading
"Always Respect Risk"
Happy Trading
Jai Hind Jai Bharat

DONEAR INDUSTRIES seems bullishBreak out after 18 months. 121 may be act as SL for investors on daily close basis.

DONEAR INDUSTRIES BULLISH BREAKOUTIts a bullish breakout with huge volume.Its a up flag and good consolidation of flag pattern breakout. target will hit within 33 trading days.

Donear Industries Ltd:- Ascending Triangle Donear Industries Ltd:- Ascending Triangle
58% Upside potential
Levels mentioned on chart & given targets seems achievable.
Plan your trade accordingly.
Views are for ‘’EDUCATIONAL PURPOSE ONLY’’,trade at your own risk.
"Trade what you see, Not what You Think"
Happy Trading(:)

Donear- professor-gov-sg-bull-flag-3-days-volume-increase-and-clDonear- professor-gov-sg-bull-flag-3-days-volume-increase-and-cl
1) Retouch 144
2) Once up, it will double money within 2 months
3) lets see else go to pee

Symmetrical Triangle Pattern, Institution Active In This Stock📈 DONEAR looking good
✅ Symmetrical triangle breakout above 112
✅Strong support from 50 EMA
✅ High Volume & rise in adx showing strength in upside momentum
✅ Revenue more than Doubled in last 3 years
✅ Promoter holding 75% unpledged
✅ Roce & Roe is good but book value is poor
✅ Compounded Growth:- sales 15%, Profit 45% , CAGR 48%

DONEAR - Weekly AnalysisIn the Weekly Chart of DONEAR ,
we can see that, it is shrinking in upward direction.
My expected momentums is shown in chart.

Donear is forming Ascending Triangle pattern(Bullish)On Weekly TF charts it is forming Ascending Triangle pattern .
Struck in and Forming pattern from more than 1year.
1. Taking support on trend line and forming higher lows.
2. Taking support on 50EMA.
3. RSI also taking support on trendline.

DONEAR - Weekly AnalysisIn the Weekly Chart of DONEAR ,
we can see that, it is shrinking in upward direction.
Since it is at decision making point, we can enter on breaking its High with Low as SL.
My expected momentums is shown in chart.

DONER looks good for swing trade.The recent swing has broken its all time high and now it has formaed an uptrend pattern with breakout ofter pullback. The minor trend of the pullback has changed into uptrend which is indicating a bullish move in incoming. Do your own research before investing.

2 Amazing swing trade ideas for 8 Sep Markets I daily make educational content videos for swing / positional trading

Consolidation Over for DONEAR1. Buy or Sell at your own risk
2. Don't risk more than 1%-2% of your capital as stop loss
3. Position Size formula: - Stop Loss Amount/(Buy Price - Initial Stop Loss Price)
4. Sell on initial Stop Loss hit or RSI close below 40
5. Some other ways to sell stocks can be
a. 25% or 50% up in three weeks or less
b. Weekly tailing tops with high volume
c. Exhaustion gaps
d. Heavy daily volume without further upside
e. Largest one-day price drop
After a consolidation of nearly 8 months NSE:DONEAR is showing signs of a new up move, buy with a stop at ₹100.
Disclaimer: I am not SEBI Registered. Do trade or invest at your own risk, I am not responsible for any losses and won't claim anything from your profits either. Take financial advice from your advisors before jumping in.

DONEARNote:
1. Views are personal and for educational purposes only. Recheck and take the trade as per your RR.
2. Always remember SL is your lifeline, not the big target...
3. Follow us for more patterns and like, share so that we feel it is helpful to many and share more patterns...
3. Views given here is not a tip rather it is for educational purpose... Aftermarket opens, the condition might change so learn to handle different conditions...
Keep an eye ladies and gentlemen. Cheers and Happy Trading

DONEARTRADING COMMUNITY
JOIN US ONLY IF YOU WANT PEACE AND PROFIT IN YOUR TRADING LIFE.
I am not a call provider, not SEBI approved person. All the charts and PnL here are for educational purposes. Consult a professional financial advisor before you invest.


