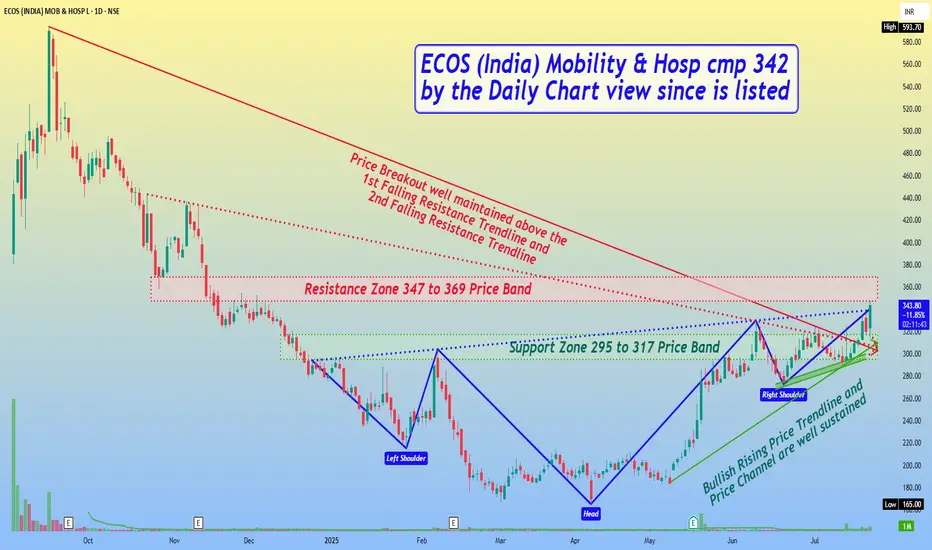
ECOS (India) Mobility & Hosp cmp 342 by Daily Chart since listedECOS (India) Mobility & Hosp cmp 342 by the Daily Chart view since is listed
- Support Zone 295 to 317 Price Band
- Resistance Zone 347 to 369 Price Band
- Bullish Rising Price Trendline and Price Channel are well sustained
- Above may also be interpreted as a Bullish "W" Double Bottom pattern
- *Rising Bullish Head & Shoulders pattern completed at Resistance Zone Neckline
- Volumes are intermittently spiking heavily indicative of demand based buying on the stock counter
- Price Breakout well maintained above the 1st Falling Resistance Trendline and 2nd Falling Resistance Trendline
ECOSMOBLTY trade ideas
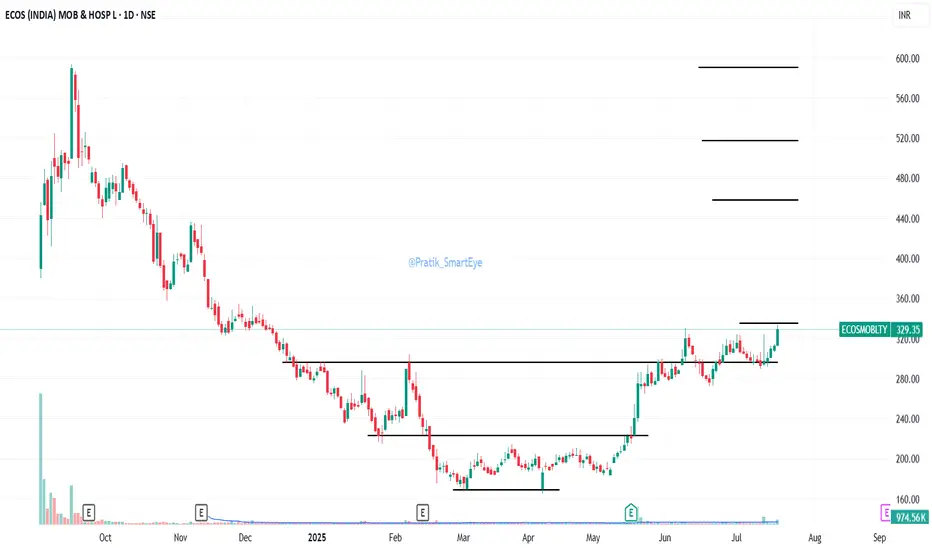
ECOSMOBLTY: IPO Stock Base BreakoutECOSMOBLTY: IPO Stock Base Breakout with volumes. CMP 329.
Resistance at 335/458/517/590
Support at 300
Ecos (India) Mobility & Hospitality Ltd Technical Summary – ECOSMOBLTY
Weekly Chart:
Forming a Darvas Box (range-bound consolidation).
Price got rejected from the downside, indicating buying interest.
A weekly breakout is likely if price closes above ₹330.
Daily Chart:
Forming a W pattern (double bottom), a bullish reversal setup.
Neckline at ₹330 – breakout point.

Ecosmobility Trendline Breakout in DTF !!This share has given a Trendline Breakout in it's Daily Time Frame
CMP: 281
Dip: 250
Tgt: 320,350,375.
SL: 210 Below WCB
Chart is only for Educational Purpose !!
