Range + Cup & Handle Breakout In Eicher MotorRange + Cup & Handle Breakout = Lethal Combination
1.Got 6 Years Range + Cup & Handle Breakout on Dec 2023 Closing ( 4143.5 )
2. April 2024 Monthly Candle Closed At 4597.4, Above The Breakout Level Of Dec 2023
TRADE:
Buy 50% Here At Cmp - 4765 & Rest 50% If You Get Any Dip To 4150-4200
SL - 3880 ( Monthly Closing Basis )
Target = 6500++
EICHERMOT trade ideas

Bullish Finally we have a break out with huge volume,now it's buying on every dips till 5900
My nearest target is atleast 6500 zone
If stock didn't sustain 5900 clb , then we can say breckout failure
This week closing is very very important

Eicher Motors Ltd 2 HourReal-Time Data Summary (Latest Close)
The most recent available data (close as of August 26, 2025) shows Eicher Motors trading at around ₹6,151, with a daily range between ₹5,970 and ₹6,210
Pivot Points (Daily) – Useful for Approximate 2-Hour Levels
While true 2-hour pivots aren't available, daily pivot points can be used as guidance for shorter intraday intervals.
From Investing.com (Daily Pivots):
Classic Pivot: ₹6,185
Support Levels (S1/S2/S3): ₹6,170, ₹6,140, ₹6,125
Resistance Levels (R1/R2/R3): ₹6,214.5, ₹6,229.5, ₹6,259
TipRanks Pivot Points (Based on Prior Day's Prices)
Classic Pivot: ₹5,951.98
Support (S1–S3): ₹5,913.97, ₹5,858.98, ₹5,820.97
Resistance (R1–R3): ₹6,006.97, ₹6,044.98, ₹6,099.97
Support & Resistance via StockInvest.us
Fibonacci Levels:
R1: ₹6,203.99
R2: ₹6,261.27
R3: ₹6,353.98
S1: ₹6,018.57
S2: ₹5,961.29
S3: ₹5,868.58
Additional Support (Accumulated Volume):
₹5,527, ₹5,495.55, ₹5,439.75
Final Thoughts
Overall bullish momentum persists (daily strong buy signals), though some indicators signal overbought conditions—be cautious.
Key swing zones:
Support: ₹6,018–₹5,961 (short term), ₹5,527–₹5,495 (deeper)
Resistance: ₹6,204–₹6,261 zone
Intraday, keep an eye on how price behaves around ₹6,100–₹6,150—it’s critical for deciding direction.

#EicherMotor Targets - 5715, 5760#Eichermotor is long on daily charts and well above 50 day SMA. Volumes are looking good. Nifty is looking to move up now after consolidation.
#Eichermotor long targets : 5715,5760. Currently at 5671
#stocks #StocksInFocus #StockMarketIndia #Nifty #TargetHit #PriceAction
I am not a SEBI-registered RIA. Please consult a qualified SEBI-registered advisor before making investment decisions.

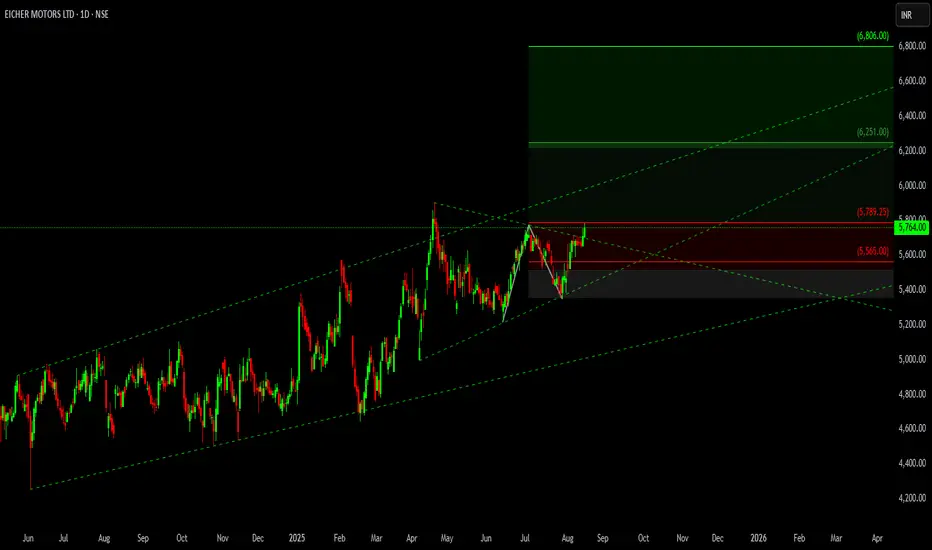
Eicher Motors Ltd - Big breakout loading…📊 Eicher Motors Ltd (NSE) – Technical Analysis (Daily Chart)
Eicher Motors is trading at ₹5,764, forming a triangle consolidation pattern inside a larger ascending channel. The price is now testing the upper boundary of this triangle, signaling a possible breakout.
🔑 Key Insights
🔺 Triangle Pattern: Price is squeezing within a contracting triangle. A breakout above resistance could trigger a strong move.
✅ Support Zone: ₹5,565 remains the critical support inside the pattern.
✅ Resistance Zone: ₹5,789 is the breakout level to watch.
✅ Upside Targets (on breakout):
🎯 First Target: ₹6,251
🎯 Second Target: ₹6,806
⚠️ Downside Risk: If the price fails to break out and slips below ₹5,565, it may retest ₹5,400 – ₹5,200 levels.
📌 Conclusion
Bullish Case: A confirmed breakout above the triangle resistance at ₹5,789 could extend the rally toward ₹6,251 and ₹6,806.
Bearish Case: A breakdown below ₹5,565 would invalidate the bullish setup and invite further downside.
#EicherMotors #Breakout #TechnicalAnalysis #StockMarketIndia #PriceAction #NSE
Bullish On Eicher Motors 5658 Eicher Motors – Riding Strong Momentum at ₹5,658**
Eicher Motors continues to hold its bullish structure, supported by:
* **Robust Royal Enfield sales** and growing export demand.
* **Premium motorcycle & commercial vehicle segment growth** outpacing the industry.
* **Technical strength** with consistent higher highs & healthy volumes.
* **Positive market sentiment** towards quality mid-cap auto plays.
**📌 Safe Target (2 Months)**: ₹5,940 – ₹6,220 (approx. 5–10% upside)
**🛡 Stop-Loss (SL)**: ₹5,286 (closing basis)
⚠ **Disclaimer:** This is *not* a buy/sell recommendation. This is my personal market view for educational purposes only. Please trade at your own risk, follow strict stop-loss discipline, and size positions according to your risk profile.

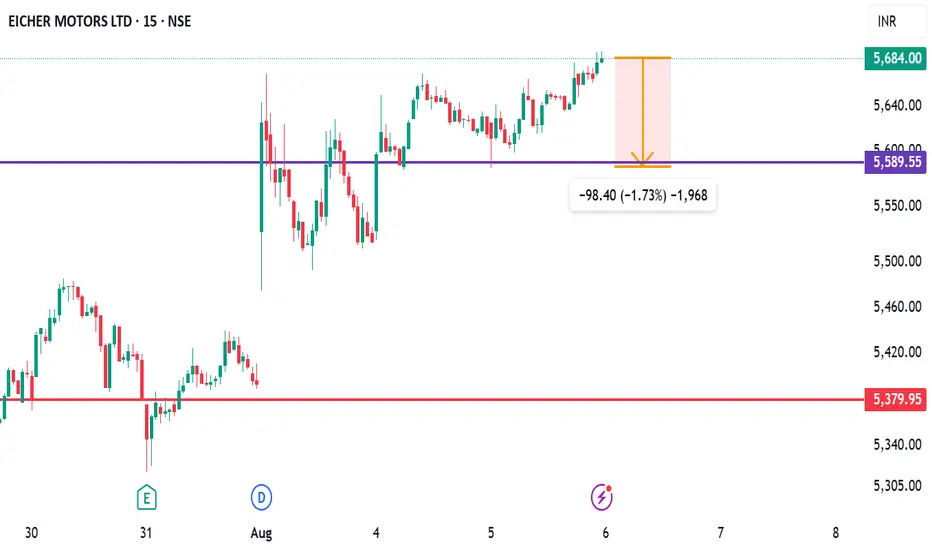
Short View: Eicher MotorsEicher Motors looks weak in the current session. A breakdown below recent support levels indicates bearish momentum building up.
📉 Strategy: Short Eicher Motors
🎯 Target: 5590
EICHER MOTORS SHORTEICHER MOTORS SHORT POSITION. the whole 2wheeler sector is going to take a dip in the coming days its best to short this stock target 5000, duration 20 days

Eichermotor 80 points long playEichermotor is long on daily chart indicators. Broke strong resistance at 5875. Looks good to climb to 5685 and 5620. Current Level : 5640
#stocks #StocksInFocus #StockMarketIndia #Nifty #TargetHit #PriceAction

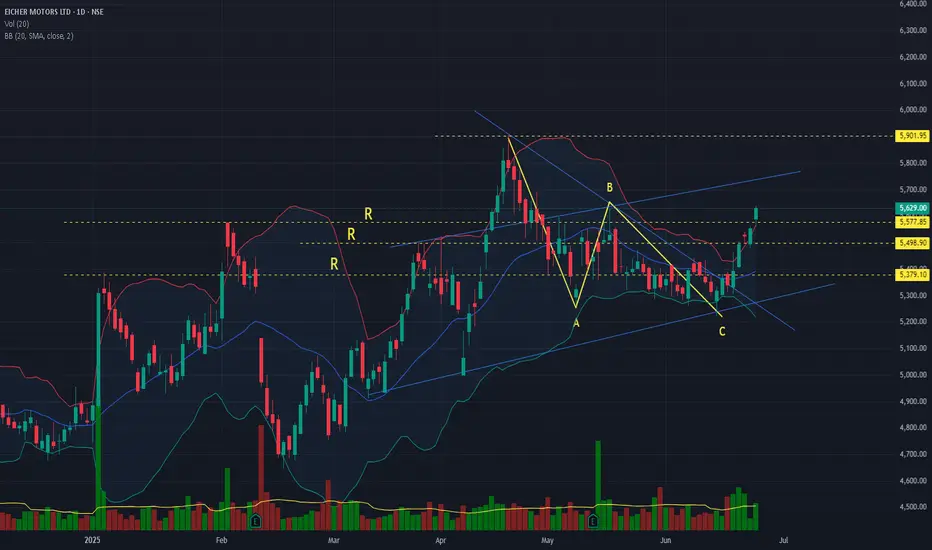
Eicher motor at momentum eicher motor is in momentum
script after abc correction tried to breakout b level today
script all major resistance crossed with gap up
24 june high is greater than 19 may
if we consider as a new high then it is new higher high
in hourly rounding bottom
if script sustain rally next resistance is all time high level of 5901
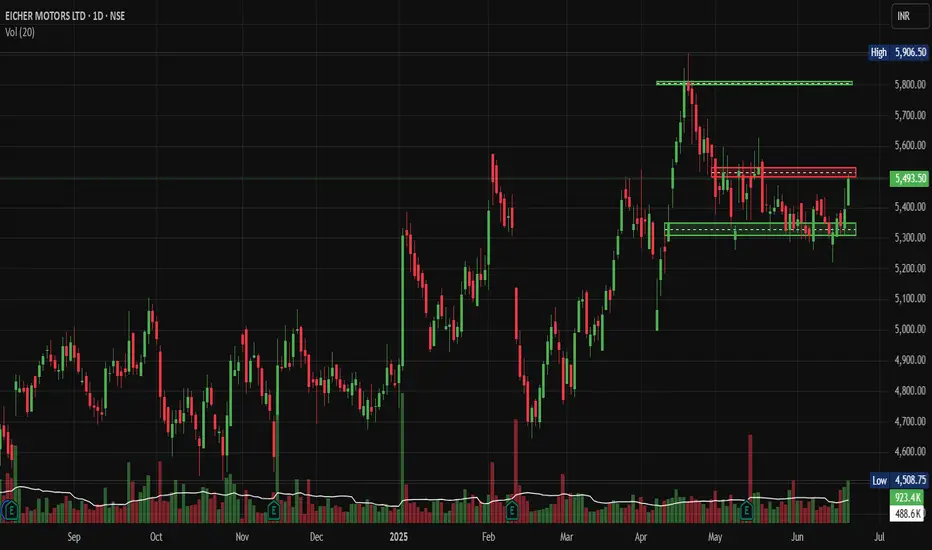
Eicher Motors: Hits Swing Highs, Signal More Upside AheadNSE:EICHERMOT Hits Swing Highs: This Technical Setup Could Signal More Upside Ahead
Price Action Analysis:
- Current Price: ₹5,493.50 (as of June 19, 2025)
- Day's Range: ₹5,410.00 - ₹5,506.50
- Price movement shows strong bullish momentum with recent breakout above resistance
- The stock has gained approximately 100.50 points (+1.86%) in the session
Volume Spread Analysis:
- Current session volume: 923.4K (89% above average)
- Average volume: 488.6K
- Volume surge during breakout phases confirms institutional buying
- Declining volume during consolidation phases shows controlled profit-taking
- Volume spike of 923.4K against average of 488.6K indicates institutional participation
- Volume has been increasing over the past 3 Days.
Volume Pattern Insights:
- Volume expansion on up moves and contraction on down moves
- Accumulation pattern visible in the base formation phase
- Recent volume spike suggests renewed buying interest
Chart Patterns:
- A clear ascending triangle pattern formed between March and May 2025
- Breakout above the ₹5,800 resistance level in April with strong volume confirmation
- Current consolidation phase between ₹5,300-₹5,500 range
- Higher lows pattern since March 2025 indicates underlying bullish sentiment
Key Technical Levels:
Support Levels:
- Immediate Support: ₹5,300 (previous resistance turned support)
- Secondary Support: ₹5,100 (20-day moving average zone)
- Major Support: ₹4,800 (previous consolidation base)
- Critical Support: ₹4,500 (long-term uptrend line)
Resistance Levels
- Immediate Resistance: ₹5,600 (short-term ceiling)
- Key Resistance: ₹5,800 (previous breakout level)
- Major Resistance: ₹5,900 (all-time high zone)
- Extended Target: ₹6,200 (measured move projection)
Base Formation
- Primary base formed between September 2024 - March 2025
- Consolidation range: ₹4,400 - ₹5,200
- Duration: 6 months (healthy accumulation phase)
- Breakout confirmation in April 2025 with volume expansion
Technical Indicators Assessment:
Momentum Indicators:
- Price trading above key moving averages
- Bullish crossover pattern maintained
- Momentum favours bulls in the short to medium term
Trend Analysis:
- Primary trend: Bullish (uptrend intact since September 2024)
- Secondary trend: Consolidation within an uptrend
- Trend strength: Strong (confirmed by volume analysis)
Trade Setup:
Long Position Strategy:
- Entry Strategy: Buy on dips approach
- Accumulation zone: ₹5,300 - ₹5,400
- Momentum entry: Above ₹5,550 with volume confirmation
- Investment horizon: 3-6 months
Entry Levels:
- Conservative Entry: ₹5,320 (near support)
- Aggressive Entry: ₹5,480 (current levels)
- Breakout Entry: ₹5,560 (above resistance)
Exit Strategy:
- Target 1: ₹5,800 (12% upside from current levels)
- Target 2: ₹6,000 (20% upside potential)
- Target 3: ₹6,200 (extended target for long-term holders)
Stop-Loss Levels:
- Conservative SL: ₹5,200 (below key support)
- Aggressive SL: ₹5,350 (tight stop for short-term trades)
- Investment SL: ₹4,800 (major support violation)
Position Sizing & Risk Management:
Position Sizing Guidelines:
- Conservative approach: 2-3% of portfolio allocation
- Moderate approach: 4-5% of portfolio allocation
- Aggressive approach: 6-8% of portfolio allocation (only for high-risk tolerance)
Risk Management Framework:
- Maximum risk per trade: 2% of total capital
- Risk-reward ratio: Minimum 1:2 preferred
- Portfolio correlation: Consider auto sector exposure
- Stop-loss discipline: Strict adherence to predetermined levels
Capital Allocation Strategy:
- Entry in tranches during the consolidation phase
- Average up strategy on breakout confirmation
- Profit booking at predetermined target levels
- Position sizing adjustment based on volatility
Sectoral Backdrop:
Automobile Sector Overview:
- The two-wheeler segment is showing a strong recovery post-COVID
- Rural demand improvement supporting premium motorcycle sales
- Electric vehicle transition creating new opportunities
- Government infrastructure spending boosts commercial vehicle demand
Industry Trends:
- The premium motorcycle segment is growing faster than the mass market
- Export opportunities expanding in international markets
- Supply chain normalisation is improving production efficiency
- Raw material cost pressures are stabilizing
Fundamental Backdrop:
Company Fundamentals:
- May 2025 sales up 26% YoY with a total of 89,429 units sold
- International sales up 82%, showing strong export growth
- Achieved a significant milestone of selling over 100,000 units in March with 33.7% YoY growth
- Fundamentals look strong and suitable for long-term investment
Market Position:
- Continues to dominate >350cc space with >85% market share
- Increased market share from 32.9% in Q4FY22 to ~36% in Q1FY23 in >125cc segment
- Market cap of ₹1,50,676 crores, appearing financially stable compared to competitors
- Average analyst price target of ₹5,426 from 21 research reports
Financial Health:
- Trailing 12-month revenue of $2.19 billion as of March 2025
- Strong balance sheet with healthy cash flows
- Consistent dividend payment track record
- Efficient capital allocation and ROE metrics
Growth Catalysts:
- New product launches, including Hunter 350, are receiving a positive response
- Market share expansion in the premium segment
- International market penetration opportunities
- Electric vehicle portfolio development
Risk Factors:
Company-Specific Risks:
- Dependence on Royal Enfield brand performance
- Raw material cost inflation impact on margins
- Competition intensification in the premium motorcycle segment
- Regulatory changes in emission norms
Market Risks:
- Economic slowdown affecting discretionary spending
- Interest rate changes may impact vehicle financing
- Commodity price volatility
- Currency fluctuation impact on exports
Technical Risks:
- Breakdown below ₹5,200 could trigger selling pressure
- Volume declining during upward moves would be concerning
- Broader market correction affecting sector sentiment
- Profit booking pressure at higher levels
My Take:
Overall Assessment:
The technical setup for NSE:EICHERMOT appears constructive, with the stock maintaining its uptrend structure. The recent consolidation phase provides an opportunity for fresh accumulation. Strong fundamentals support the technical outlook with robust sales growth and market share expansion.
Investment Recommendation
Buy on dips strategy recommended for medium to long-term investors. The risk-reward profile remains favourable with multiple technical targets achievable. However, strict stop-loss discipline and position sizing are crucial for risk management.
Time Horizon:
- Short-term (1-3 months): Consolidation with upward bias
- Medium-term (3-6 months): Bullish with a target of ₹6,000
- Long-term (6-12 months): Positive outlook with potential for new highs
The combination of strong fundamentals, healthy technical setup, and favourable sector dynamics makes NSE:EICHERMOT an attractive investment proposition for quality-focused portfolios.
Keep in the Watchlist.
NO RECO. For Buy/Sell.
📌Thank you for exploring my idea! I hope you found it valuable.
🙏FOLLOW for more
👍BOOST if you found it useful.
✍️COMMENT below with your views.
Meanwhile, check out my other stock ideas on the right side until this trade is activated. I would love your feedback.
Disclaimer: "I am not a SEBI REGISTERED RESEARCH ANALYST AND INVESTMENT ADVISER."
This analysis is intended solely for informational and educational purposes and should not be interpreted as financial advice. It is advisable to consult a qualified financial advisor or conduct thorough research before making investment decisions.
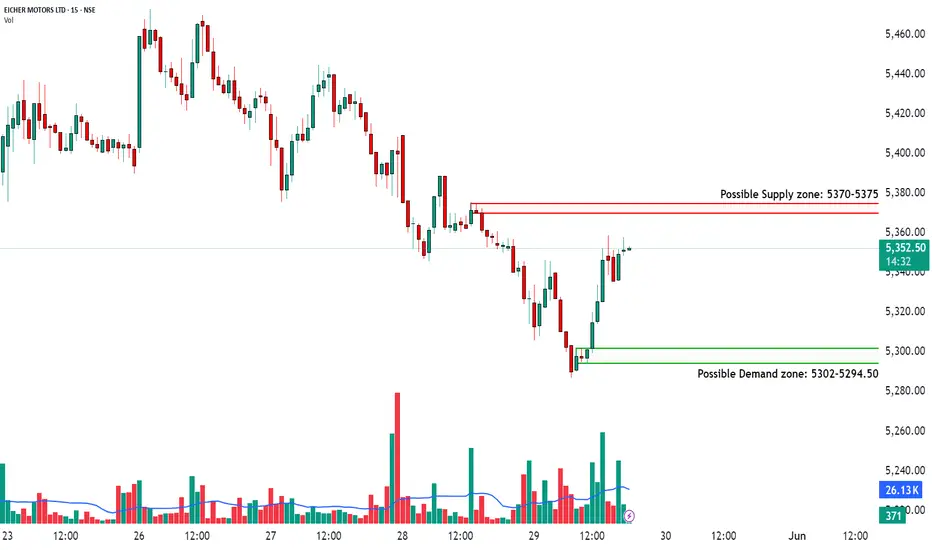
How to Trade Supply & Demand Zones📉 SUPPLY ZONE TRADES (5370–5375)
🔴 Scenario 1: Reversal from Supply Zone
Price action: Price moves up near 5370–5375 and forms a bearish candle (e.g., Doji / Engulfing)
Trade Type: Short (Sell)
🛒 Entry: Around 5372
📉 Stop Loss: 5378 (above zone)
🎯 Target: 5330 (previous structure / 40-point move)
Risk Type: Medium
Rationale: Price faced rejection from the supply zone multiple times.
🔴 Scenario 2: Break & Fail Retest
Price action: Price breaks above 5375 but quickly falls back below it and retests from underneath.
Trade Type: Short (Sell on breakdown confirmation)
🛒 Entry: 5370 (after breakdown and retest)
📉 Stop Loss: 5380
🎯 Target: 5325
Risk Type: Medium
Rationale: Trap breakout buyers and trade the reversal.
📈 DEMAND ZONE TRADES (5302–5294.5)
🟢 Scenario 1: Reversal from Demand Zone
Price action: Price dips to 5300 zone, shows strong bullish reversal candle (e.g., hammer / bullish engulfing)
Trade Type: Long (Buy)
🛒 Entry: 5300
📉 Stop Loss: 5290
🎯 Target: 5345
Risk Type: Medium
Rationale: Clean bounce from a strong demand zone.
🟢 Scenario 2: Breakout and Retest of Demand
Price action: Price breaks below 5294.5 but recovers strongly and retests the zone from above.
Trade Type: Long (Buy on successful retest)
🛒 Entry: 5302
📉 Stop Loss: 5288
🎯 Target: 5350
Risk Type: Medium
Rationale: Demand flipped to support again with bullish confirmation.
Reversal trades from demand/supply zones can offer high risk-to-reward setups.
Always wait for strong price action confirmation like pin bars or engulfing candles.
Avoid jumping in blindly — volume and structure matter.
Use tight stop loss just outside the zone to manage risk smartly.
Ideal for range-bound markets — not during strong trends.
⚠️ Risk Management Tip: Always trade with a clearly defined stop loss. Avoid entering positions impulsively. It is advisable to start with a smaller quantity and increase your exposure only if the price action confirms the continuation of the trend. Capital protection should always be the priority.
📢 Disclaimer
This content is created purely for educational and informational purposes. It is not intended as investment advice, stock recommendations, or trading tips. Trading and investing in the stock market involves risk. Please consult with a SEBI-registered financial advisor before making any investment decisions. The author/creator is not registered with SEBI and shall not be held responsible for any losses incurred based on this information. Always do your own research and use proper risk management.
👉 If you found this analysis helpful, don’t forget to Follow, so you never miss out on a trade-worthy setup, breakout opportunity, or valuable educational insight again. Stay updated and trade smarter! 💡📈
40% gains in 2-3 yrs - Eicher Motors - Long Term Compounder40% returns in next 2-3 years - Eicher Motors - Long Term Compounder
Fundamental Outlook
Almost debt free D/E ratio is 0.02, High ICR (110)
PE of 31.53, IND PE is 45.12, 0.7X of INdustry PE, expensive stock
PEG of 1.51, reasonable
ROE = 26.24%
ROCE = 32.43% , ROCE 5yrs = 25.16%
Sales growth = 14.12%, Sales Growth 5 yrs =15.57%
Profit growth = 18.3%, Profit Growth 5 yrs = 20.95%
Promoter holding at 49.08%, marginally reducing every quarter
Cumulative FII/DII holding making up for promoter dilution
Very less public holding, continually decresing, signalling strong hand holding
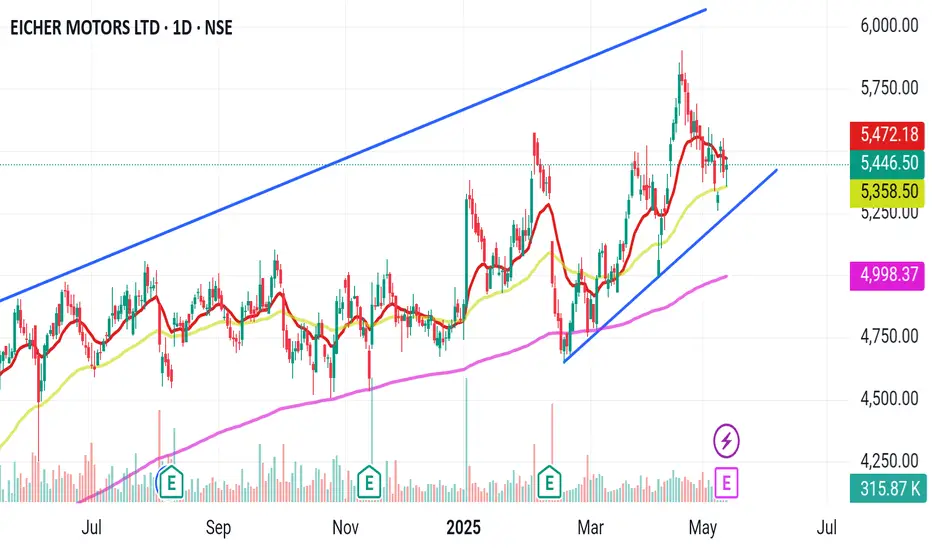
Technical Outlook
CMP : 5446
On Monthly charts ,
Stock has clearly followed a parallel channel since 2019
On Weekly charts ,
Stock is bullish, CMP is above all periodic EMAs
On daily charts
Relative strength and momentum on 20 day time period is lagging. Stock has not moved much in recent days
RS = 97, relatively weak strength compared to Nifty 500
Momentum = 99, relatively weak momentum compared to NIfty 500
RSI = 50 , neither oversold nor overbought , reasonable
Chart Patterns
On Monthly charts ,
Stock has clearly followed a parallel channel since 2019
Industry Outlook
Sector/Industry - Automobiles/2-3 Wheelers
Nifty auto is a leading index compared to other sectoral indices in the past 20 days.
Nifty Auto has formed a W pattern/double bottom in the recent past and is recovering appreciably.
Continuing momentum should take the Index past recovery to bullish phase
Latest Q4 Results
Mar 2025
NSE:EICHERMOT
QOQ
👉Revenue rose 5.39% to 5241
👉EBITDA rose 4.75% to 1258
👉EBITDA Margin drops -0.15% BPS to 24.00%
👉Net Profit rose 16.41% to 1362
👉EPS rose 16.35% to 49.68
YOY
👉Revenue rose 23.14% from 4256
👉EBITDA rose 11.52% from 1128
👉EBITDA Margin drops -2.50% BPS from 26.50%
👉Net Profit rose 27.29% from 1070
👉EPS rose 27.06% from 39.1
Fundamentals
👉Stock Price is 5446.5 as of 5/14/2025
👉Stock PE is 31.53
👉Stock EPS is 172.73
👉Dividend announced of Rs.70 per share
Growth
👉2 year Revenue CAGR is 14.31%
👉2 year Profit CAGR is 27.42%
👉2 year EPS CAGR is 27.32%
👉2 year Price CAGR is 35.90%
Disclosure 1 - Invested
Disclosure 2 - Not SEBI Registered
Disclosure 3 - This is Not investment advice. Treat it as educational

Call on eicher motor Eicher motors has announced its earnings above estimates top line and bottom line numbers.
The stock trading near its support level around 5400. Enter into the stock around 5300 keep sl at 5200 tgt 5600 for 2 months.
Eicher Motors can be good buy at current levels for 9% upsideEicher Motors can be good buy at current levels for 9% upside.
LTP - 5575
Targets - 6050+
Timeframe - 2 Months.
Happy Investing.
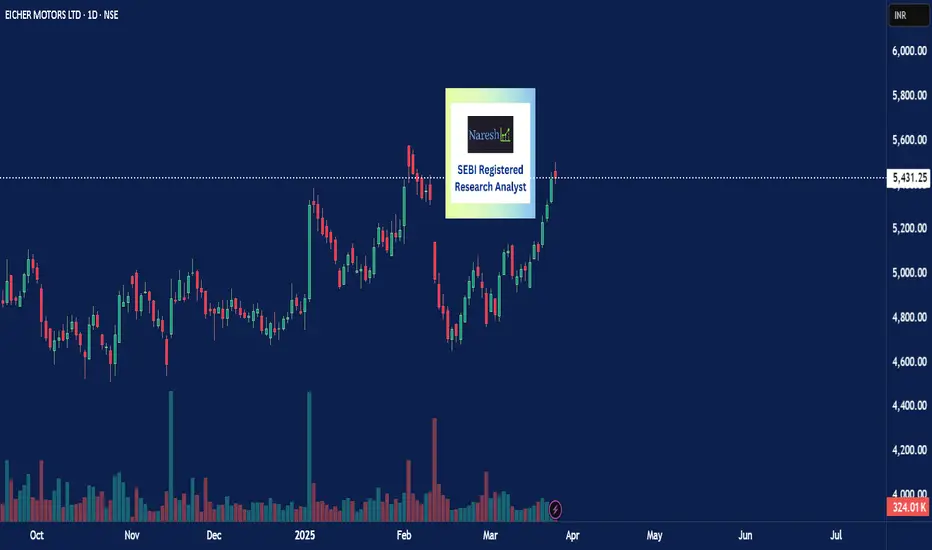
Royal Enfield EICHER MOTORS LTD
LTP 5430
Add on dips SL CLB 4995 or Buy now SL CLB 5150
Tgts 5700-6k-6200-6500
if you like this idea 💡 --- Plz don't miss to Boost 🚀
For more info - Plz visit my profile & Follow me
Rgds,
Naresh G
SEBI Reg.RA
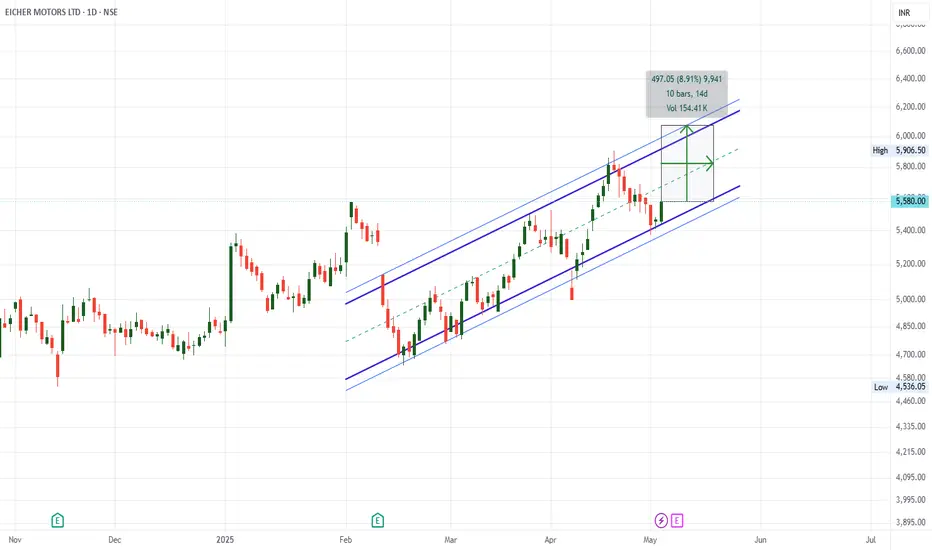
Eicher Motors Unshaken in Bullish UptrendTopic Statement:
Eicher Motors is in a strong bullish momentum and has remained unaffected by the recent market correction.
Key Points:
- Price is moving within a bullish up-trending channel, indicating strength.
- The stock mostly trades above the 180-day EMA, reinforcing its bullish trend.
- Stock can be accumulated near the lower band of the channel using the channel trading method.

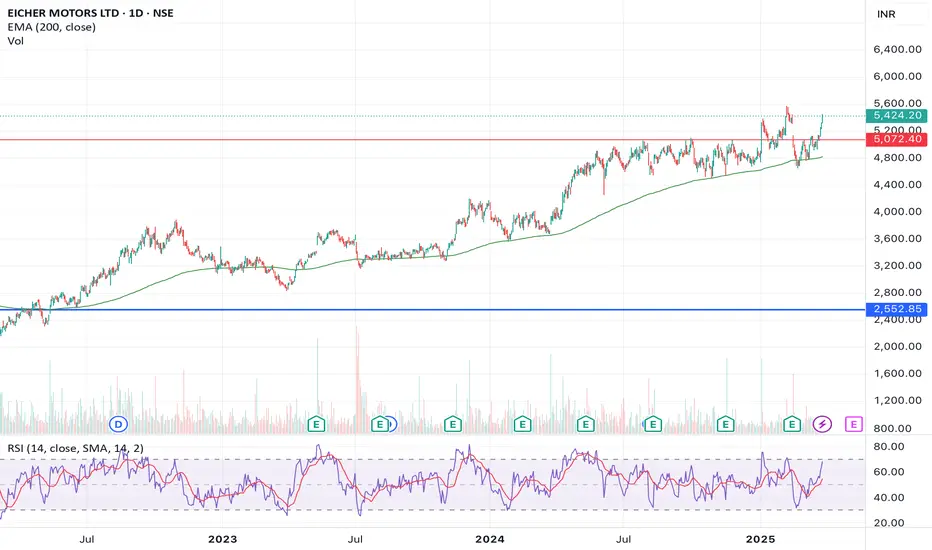
Strongest Stock in the Auto Sector1. Eicher Motor outperforming the Auto Sector and Broader Market
2. Consolidation near its 52 week high with beautiful support from 200 SMA
3. The Stock near its 52 week high looking for a strong breakout
4. Good for long term with a min horizon of six months
gap on weekly time frame.Gaps act like strong magnets, as one sentence from Trading in the Zone states. I want to experience this gap-filling theory.
If the 5150 Rs resistance is breached, possibly I am looking for the 50% gap to be filled immediately. if someone has experience on this, please have a word with me. thank you.
Eicher Motors LimitedEicher Motors Limited leading player in the Indian automobile industry. After breakout Aug, 2022 already give the target price and still holding above 50 SMA . If not break 50 SMA then hold for long term again

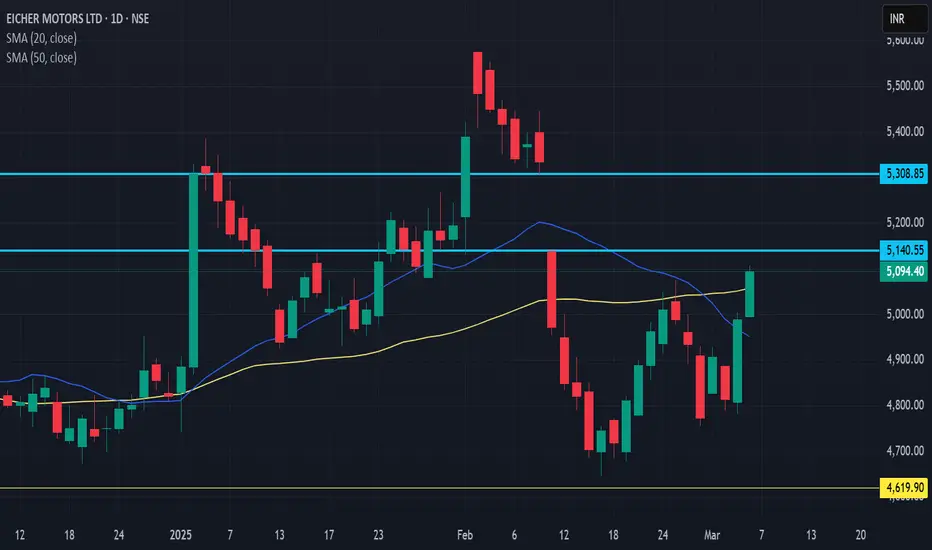
view on eicher motorsStock name: Eicher Motors
current price: 4773
If it take support at 4760-4740, it can retest 4860-4900 and may remain in 4900-4750 range.
below 4740 stock can see more fall to 4660-4540-4440
If it breaks resistance above 4900, upside target would be 5040+

Eicher Motors Date 02.03.2025
Eicher
Timeframe : weekly
Technical Remarks
1 Currently under right-angled ascending broadening wedge
2 Neckline confluence with 60 weekly exponential moving average + 23.6% retracement
3 Trade shorts only once breakdown mentioned above zone (point #2)
4 Target for wave 4 would be 38.2%, 3947
5 Remember as trade confirmation rsi should remain below mean reversion then momentum will be high
Some Fundamental Highlights :
1 Company is almost debt free.
2 Company has been maintaining a healthy dividend payout of 34.6%
3 Current earnings were including an other income of Rs.1,813 Cr
4 Good promoter holding with 49% followed by FIIs 25% & DII 16%
5 Healthy ROCE of 30%, PE at 29 & healthy OPM at around 26%
Latest FEB Month Sales
FEB CV TOTAL SALES 8,092 UNITS VS 7,424 UNITS (YOY)
Regards,
Ankur

Eicher - Seeing A ReversalCMP 4703 on 17.02.25
All important levels are mentioned on the chart.
In the last 6 months, the stock price has taken support many times on the dotted line shown on the chart. This time again comes to the support.
The price is corrected around 10% after the earnings declaration.
Though it is a risky setup, the risk-reward ratio is quite good at present.
If gives a bounceback, upside targets may be 4910/5100 and 5300.
Keep your stop-loss strict according to risk management.
This is only for learning and sharing purposes, not a trading recommendation in any way.
All the best.
