Breakout soon in EICHER MOTORSAscending Triangle Breakout Setup
RSI above 65 and rising
Trading above EMA50
Volume increasing
Enter after confirmation
Disc: for study, not a recommendation
EICHERMOT trade ideas

Eicher Motors Bullish Upward-moving channelThe stock is currently trading within an upward-moving channel, consistently forming higher highs and higher lows on the daily chart. This presents a favorable opportunity for a swing trade.

Eicher Motors Ltd: Ascending Triangle PatternEicher Motors Ltd: Ascending Triangle Pattern
Breaks out soon stock
12% upside potential
9 Week long base.
Plan your trade accordingly.
Views are for ‘’EDUCATIONAL PURPOSE ONLY’’,trade at your own risk.
"Trade what you see, Not what You Think"
Happy Trading(:)

#EICHERMOT Gearing Up for a Bull Run!🚗💨 Stock Alert: #EICHERMOT Gearing Up for a Bull Run! 🚗💨
📈 Momentum Building: With recent volume build-up and most stocks in the Auto industry showing strong breakouts, #EICHERMOT is set to follow the trend. As we approach the Diwali festival, this stock is primed for a bullish run alongside other auto stocks. The momentum suggests it’s a strong candidate for a swing trade.
Target: 5400-5890
Stop Loss: 4845
Trade Risk Free Exit (20-30%): 5250
R/R Ratio: 3.5
You can follow a tight stop loss here to manage risk. 🔥
💡 Keep #EICHERMOT on your radar during this massive bull run in Auto stocks! 👀
📢 Disclaimer: This post is for educational purposes only. Always do your own research before making any investment decisions. 💼
#StockMarket #AutoStocks #DiwaliRally #Trading #InvestSmart

EICHERMOT // Levels // 1h"Welcome to SkyTradingZone "
Hello Everyone 👋
For Eicher Motors Ltd (EICHERMOT) on the 1-hour time frame, here are the key levels:
Support Levels:
First Support: ₹4,860
Second Support: ₹4,820
Resistance Levels:
First Resistance: ₹4,940
Second Resistance: ₹4,980

EICHERMOT // Level // 1H"Welcome to SkyTradingZone "
Hello Everyone 👋
You're referring to the Eicher Motors Ltd (EICHERMOT) stock!
As of my last update, the current price of EICHERMOT is around 3,120-3,140.
Here are some key levels related to the EICHERMOT 1-hour chart:
Resistance Levels:
Immediate Resistance: 3,160-3,180
Medium-term Resistance: 3,200-3,220
Long-term Resistance: 3,300-3,320
Support Levels:
Immediate Support: 3,080-3,090
Medium-term Support: 3,040-3,050
Long-term Support: 2,900-2,910
Trend Lines:
Short-term Trend Line: The EICHERMOT has been trending upwards since the November 2020 low, with a short-term trend line around 2,500
Medium-term Trend Line: The EICHERMOT has been trending upwards since the August 2020 low, with a medium-term trend line around 2,800
Long-term Trend Line: The EICHERMOT has been trending upwards since the February 2020 low, with a long-term trend line

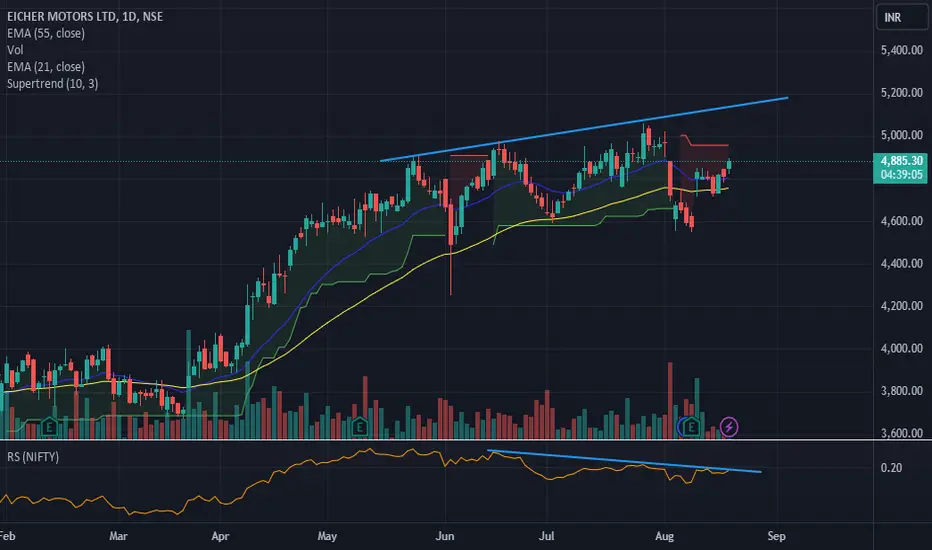
Eicher Motors Showing RS Nifty Divergence Eicher Motors is showing divergence between price trend and RS Nifty trend. Price trend is upwards while RS Nifty trend is downwards. This is showing weakness in the stock.
Eichermotors BullishOn the Monthly time frame this stock was in range of 3108 to 1215.70 from 01Aug 2017 to 01Aug2020
and given a break out on 01Aug2022 and range breakout retest confirmed on 03Juy2023 . consolidate for 3 months and rally started, as per range breakout targets are derived as Range High - Range Low i.e., 3108-1215.7 = 1892, by adding these points to Breakout of Range high that is 3108+1892 = 5000 as Target. This is one of the caluculation made for a Range Breakout deriving Target.
Accordingly we use Trend lines and channels to ride the trend on lower timeframe in other words we do call it as Top Down Analysis...
This is for Educational purpose only. i may be wrong too, i just shared this on my personal experience and knowledge. JUST A VIEW NOT A RECO...

Eicher MotorsSecret of rounding bottom. Now see the chart of FSL posted . You will get confidence and conviction.
sharing my idea based on chart reading.
no buying recommendation only for educational purpose

Higher Highs Higher Lows - EICHERMOT📊 Script: EICHERMOT
📊 Sector: Automobile
📊 Industry: Automobiles - Motorcycles / Mopeds
Key highlights: 💡⚡
📈 Script is trading in Upward moving channel and forming Higher Highs Higher Lows on daily chart.
📈 One can go for Swing Trade.
⏱️ C.M.P 📑💰- 4941
🟢 Target 🎯🏆 - 5073
⚠️ Stoploss ☠️🚫 - 4808
⚠️ Important: Always maintain your Risk & Reward Ratio.
✅Like and follow to never miss a new idea!✅
Disclaimer: I am not SEBI Registered Advisor. My posts are purely for training and educational purposes.
Eat🍜 Sleep😴 TradingView📈 Repeat 🔁
Happy learning with trading. Cheers!🥂

Eicher motors Channel Eicher motors Channel for trading
Buy near channel bottom and sell near or above channel high

FAalling wedgeThe Descending Broadening Wedge is the opposite of the Ascending Broadening Wedge. It is generally formed during a downtrend. Divergent to the Falling Wedge, where the price action contracts as the pattern mature, the Descending Broadening Wedge widens as the two trend lines that have formed diverge from one another.
The descending broadening wedge is measured to be a reversal pattern and is bullish. Although the pattern is typically a reversal signal, a continuation of the downtrend is still possible.
On a continuation, the wedge will still slope to the downside, but the down-slope will characteristically be found as a pullback within an uptrend. The pattern will slope to the downside within a downtrend on a reversal. Despite continuation or reversal, descending broadening wedges are always bullish.

Eicher motor Elliot view pattern- can consider during correction
- wait for correction wave 4
This analysis is my own idea.
I don't recommend to take trade based on this idea.
Know the market risk before trade.

Eicher Motor Long position
Hold few Weeks to Months
Please consult your financial advisor before investing
All research for educational purposes only.
Reversal from bottom, RSI is shifting in upper direction. Stock is ready to cross past barriers with good volumes.

EICHER MOTORS - Swing Trade - 27th February #stocksEICHER MOTORS (1D TF) - Swing Trade Analysis given on 27th Feb, 2024
Pattern: ASCENDING TRIANGLE BREAKOUT
- Resistance Breakout - Done ✓
- Volume buildup at Resistance - Done ✓
- Retest & Consolidation - In Progress

Trading Idea on Eicher MotorsNSE:EICHERMOT
Stock is near support level of 4200 level. Long may be initiated with Trailing Stop Loss near 4135 level. Daily close above 4320 may lead to stock to 1.618 Fibonacci extension level near 4595 level.

EICHERMOTNSE:EICHERMOT Add to your watchlist this stock trade in channel pattern so long as it's break the resistance we can get some move.

BOS - Eicher Motors (Daily)Break of structure pattern formed in Eicher Motors. Price can be bounced back from previous structure's high considering as a potential demand zone.

All time high breakoutGood volume buildup in the past few candles both in daily and weekly timeframe.
All time high breakout with good volume, if breaks the high of current candle then good opportunity for long or else wait for retest conformation.
Price has taken support twice from 200EMA, good sign for bullishness.
NOTE: i do my analysis, do your before trade.

EICHER MOTORS Breakout🚀Hey Family, there is a one more stock Which is showing a great opportunity and formed a Symmetrical Triangle pattern, Stock break's resistance zone and retest the resistance zone, let's see breakout sustain or not. what is your view please comment it down. We are Certified. All views shared on this channel are my personal opinion and is shared for educational purpose and should not be considered advise of any nature.

EICHERMOTOR - Big move aheadEICHER MOTOR has given strong breakout on weekly chart. New targets are 4500 and 5000. chart has given advance RS breakout and our magic indicator turn in green.

Double Bottom Neckline Breakout - EICHERMOT📊 Script: EICHERMOT
📊 Sector: Automobile
📊 Industry: Automobiles - Motorcycles / Mopeds
Key highlights: 💡⚡
📈 Script is trading near Double Bottom Neckline which is resistance level 4010, and giving breakout of it.
📈 MACD and Double Moving Averages are giving crossover.
📈 RSI is around 61.
📈 One can go for Swing Trade.
⏱️ C.M.P 📑💰- 4019
🟢 Target 🎯🏆 - 4200
⚠️ Stoploss ☠️🚫 - 3921
⚠️ Important: Always maintain your Risk & Reward Ratio.
✅Like and follow to never miss a new idea!✅
Disclaimer: I am not SEBI Registered Advisor. My posts are purely for training and educational purposes.
Eat🍜 Sleep😴 TradingView📈 Repeat 🔁
Happy learning with trading. Cheers!🥂

