EICHER Motors near high in 2017The share value is near the high it reached in 2017. Will it serve as a support ?
EICHERMOT trade ideas

Can go long post 3400Correction till 0.786 levels is complete. Above 3400, can look at +3800 levels. Plus it has retested 3346 levels.

Eichermot diagonal breakout.Eichermot can go long wave 4 seems to be completed, as wave c looks diagonal and breakout has happened, can retest but high possibility of going long.

Eicher motors 15 min time frameIt gives a breakout to flag pattern, what I'm trying to say eicher motors in larger time frame also shows down trend.

EICHER MOTORSfalling wedge pattern form by eicher motors in 1D time farm once stock stock break supply zone up side then only take entry otherwise avoid it.

Double bottam formation GOOD to buy at cmp for target of 3504 & 3583
only for educatinal purpose
not sugesstion

Breakout retest or fibo 0.618 support Eicher motors very good setup
in an uptrend retest ATH breakout level
and fibo 0.618 level
one can look for buy opportunity
sl as mentioned or as per your system
i am not a sebi register adviser
its my own analysis
pls make sure you do your analysis dont jump on the trade

channel pattern reversal in EICHERMOT.EICHERMOT
Key highlights: 💡⚡
📊On 1H Time Frame Stock Showing bullish flag Pattern.
📊Strong Bullish Candlestick Form on this timeframe.
📊It can give movement upto Reversal target of 3440+.
📊There have chances of Breakout of Resistance level too.
📊Can Go Long in this stock by placing stop loss below 3250 or last swing low.

#EicherMotor, Short setup for 1.5-2.25% gains in F&OOn Weekly TF Eicher motor has made inverted hammer candle and I am looking to initiate short trade below 3325. If Eicher open flat on Monday then will initiate short trade below 3325, if open gap up then will wait for rejection around 3370 and then initiate trade this will give great risk reward. If open gap down then need to wait to take rejection around 3325 level which is friday's low. My final target will 3280 & 3240 and SL would be 3380 or 3330 depending on which scenario get's played out.
Let's see how market will react on Monday. Happy trading , enjoy :)

Falling wedge pattern reversal in EICHERMOTEICHERMOT
Key highlights: 💡⚡
📊On 1H Time Frame Stock Showing Reversal of Falling wedge Pattern .
📊 It can give movement upto the Reversal target of above 3445+.
📊There have chances of breakout of Resistance level too.
📊 After breakout of Resistance level this stock can gives strong upside rally upto above 3885+.

Eicher giving a break down.Eicher motors closed below the 20 ema kn the weekly time frame with high volumes.
On daily analysis the stock has also breaker down the support level of 3355.
The stock seems to be in a down trend and can trade to even lower levels.
3 point confirmation.
1. Closed below 20 ema ( weekly time frame).
2. Retest of 20 ema and going below the resistance level on daily time frame.
3. High volume break down .
Markets are in a bull run and before another up move can retest the lower levels.
Targets :- 3240, 3166
Stop loss:- 3355
Wait for the stock to start trading below the previous day low i.e. 3325 after a retest.
The stock can even touch the daily 200 moving average.
Intraday and swing trades can be initiated in the stock.
Wait for the price action near the levels before entering the trade.

Eicher Motors Cmp 3414 dated 25-11-2022 Bullish Candle @ bottomEicher Motors Cmp 3414 dated 25-11-2022
1. Fridays Candle has Engulfed last 4 days
candle.
2. RSI reversal & BO.
Buy above 3425 for target 3450-3500-3550-3600
SL 3350 (closing basis)
Disclaimer :
I am not a Sebi registered Analyst so please do your own Analysis before taking any action.
The above view is shared just for educational purpose.
By no means shall be responsible for any losses amounting out of it incase if any trades on it.
It is just a view, pls trade at your own risk.

Eicher consolidating in a range.Eicher motors on the daily time frame has been trading in a narrow range of 50-60 points which is unusual of this kind of stock.
The stock on the weekly time frame has tested its 20 ema and formed a hammer doji.
The stock has been falling for 2-3 weeks and can give some retracement before continuing another leg.
3 point confirmation.
1. Taking support from 20 ema.
2. Box consolidation on daily time frame.
3. Hammer candle on daily and weekly time frame.
The markets are in bullish move and the stock can give a good up move.
Let the stock cross and sustain above 3415 levels. A swing and intraday trades can be initiated once the levels are sustained.
Target :- 3500, 3555
Stop loss :- 3356, 200 ema(4-hour time frame).
Wait for a price action near the price levels before entering the trade.

[POSITIONAL] EICHERMOT LONG BET
risk: Reward ratio is 1: 2
Rest as per Charts
********
Note -
One of the best forms of Price Action is to not try to predict at all. Instead of that, ACT on the price. So, this chart tells “where” to act in “what direction. Unless it triggers, like, let’s say the candle doesn’t break the level which says “Buy/Sell if it breaks”, You should not buy/sell at all.
=======
I use shorthands for my trades.
“Positional” - means You can carry these positions and I do not see sharp volatility ahead.
“Intraday” -means You must close this position at any cost by the end of the day.
=======
Always follow a stop loss.
In the case of Intraday trades, it is mostly the “Low/High of the Candle”.
In the case of Positional trades, it is mostly the previous swings
********

Rising wedge pattern breakdown in EICHERMOTEICHERMOT
Key highlights: 💡⚡
📊On 1D Time Frame Stock Showing Breakdown of rising wedge Pattern.
📊It can give movement up to the Breakdown target of below 2930-.
📊Breakout can give risk: reward up to 1:3+.

channel pattern reversal in EICHERMOT.EICHERMOT
Key highlights: 💡⚡
📊On 1D Time Frame Stock Showing Reversal of Channel Pattern Pattern .
📊 It can give movement upto the Reversal target of above 3990+.
📊 Can Go Short in this stock by placing stop loss below 3490- or last swing low.

Long Eicher Motors for target of 3990Eicher Motors has came down to the bottom of channel. From here we should long Eicher motors for the target price of 3990 which means a gain of 12%

Trendline BreakdownEicher motor gives trendline Breakdown with Good volume
Sell Below@3500
Target@3250
Stoploss@3590

Eicher Motors, Break of Trendline. BearishAs per Price Action , Eicher Motor is ready for its downward journey.One Can sell Eicher Motors once it Retest Trend Line and Shows Bearish Candlestick Pattern. Targets are mentioned

A swing trade opportunity in EicherMotEICHER MOTOR NSE:EICHERMOT is in a reversal trend and according to my conviction, this will hit 4150.00 level soon. One should take 3500.00 level as a stop loss.
Get Daily Short-term tips on my app, Daily Intraday Stocks

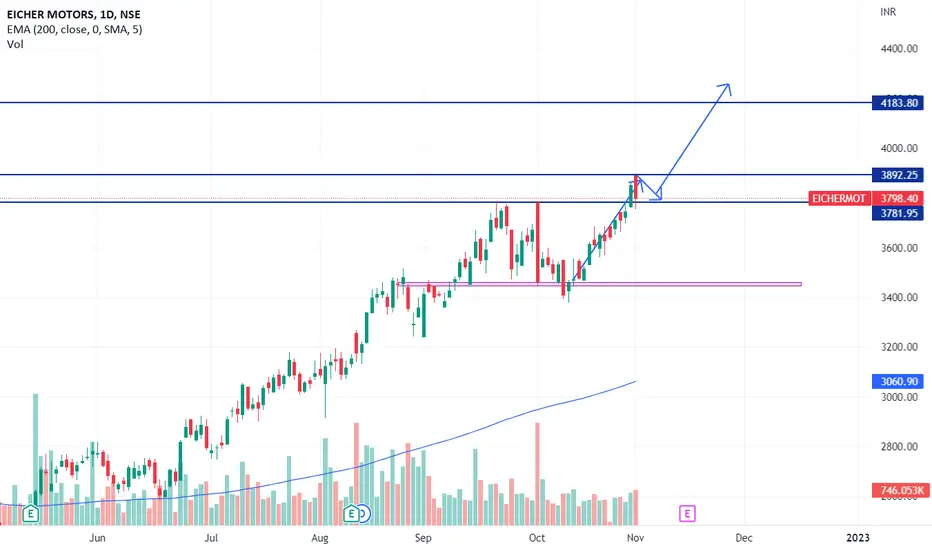
Eicher Motor will go up if cross and close over 3890Eicher Motors will go up if crosses and closes over 3890, the target will be 4180 stop loss will be 3780
Reason: break the resistance and retest
Eicher Motors Cmp 3798 dated 1-11-2022 Bearish Engulfing Candle Eicher Motors Cmp 3798 dated 1-11-2022
1. Bearish Engulfing Candle at the top of the Chart.
2. RSI breakdown
Sell for the target of 3750-3670-3625-3570 SL 3890
Disclaimer :
I am not a Sebi registered Analyst so please do your own Analysis before taking any action.
The above view is shared just for educational purpose.
By no means shall be responsible for any losses amounting out of it incase if any trades on it.
It is just a view, pls trade at your own risk.

EWT - Is EICHERMOT Forming Wave (5) Of Its WaveCycle?Timeframe: Daily
NSE EICHER motors have accomplished the corrective wave (4) and started forming impulsive waves (5). The price is currently forming sub-waves of the impulsive waves (5).
Wave (2) was a sharp zigzag, so wave (4) formed the choppy structure triangle. Since wave (3) was an extensive wave, we cannot expect wave (5) to extend with a high probability.
Eicher motors have given a good breakout and broken out wave 2 of the triangle and impulsive wave (3). If the price sustains above 3790 , traders can trade for the following targets: 3948 -3992 - 4030+ .
I will update further information soon.
